fxDreema

    • Register
    • Login
    • Search
    • Back to the main page
    • Categories
    • Recent
    • Tags
    • Popular
    • Search

    Decisive indicators, supporting indicators

    Tutorials by Users
    9
    42
    5596
    Loading More Posts
    • Oldest to Newest
    • Newest to Oldest
    • Most Votes
    Reply
    • Reply as topic
    Log in to reply
    This topic has been deleted. Only users with topic management privileges can see it.
    • P
      PhiLykia last edited by

      As a result of my studies, I saw that some indicators are indicative and some are supportive. How does?
      I have studied hundreds of indicators and oscillators over time. I would like to explain how I elaborate on the indicators and oscillators that I have studied, and how I use them in an EA. Maybe my goal is to give someone a clue.
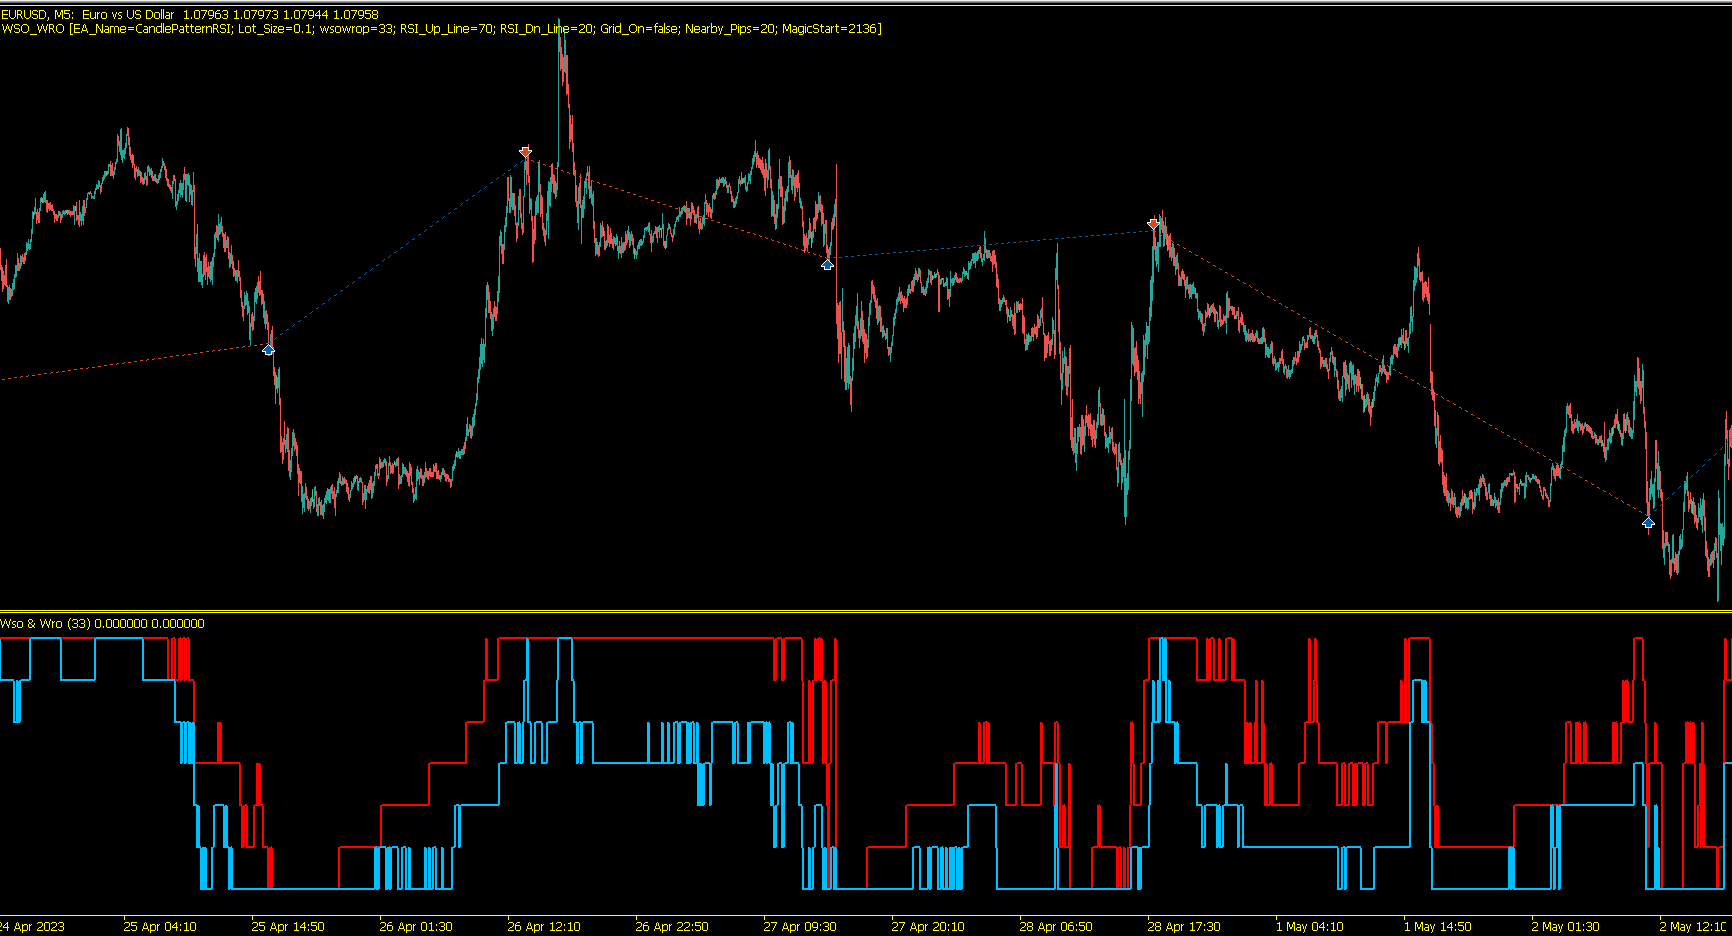
      (Sorry for my English, I will have mistakes, forgive me)

      Let's start with a random indicator, for example the WSO&WRO indicator.When we apply it to the chart, we see this:

      2b712403-8ff8-4b09-aa97-519304a1baec-image.png

      What should the indicators be doing for us? should show the entry and exit points of the position perfectly.
      Here are the points I want in this indicator:

      d1417b6c-54ff-4492-9ede-1828b8362907-image.png

      What dots do these dots correspond to on the indicator? I see that when both buffers meet at the same point (0 and 100) it should generate a signal to me.

      If the two buffer outputs are at the same level, close in case of open position opposite.
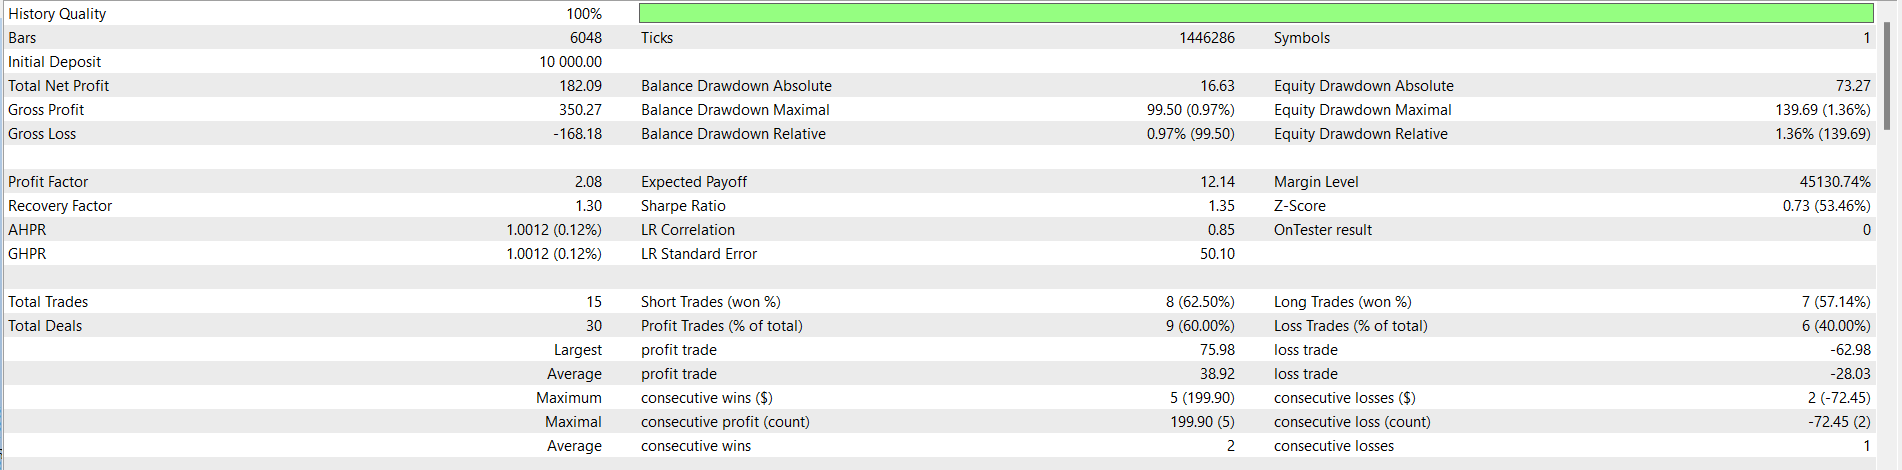
      https://fxdreema.com/shared/cUCaIgHic

      this is the result of this EA:
      14db5942-4073-44c6-8f02-0089c3b80210-image.png

      Here is the trading report:
      f1d8ae27-bd97-4bf4-996d-44aba7a5aa98-image.png

      when we remove the "no trade/position" block from this EA:

      bda72ebc-3bb3-4d2a-a95f-13e3e031c744-image.png
      7f3b4e52-7809-4c16-9e79-d5b5243eae2c-image.png

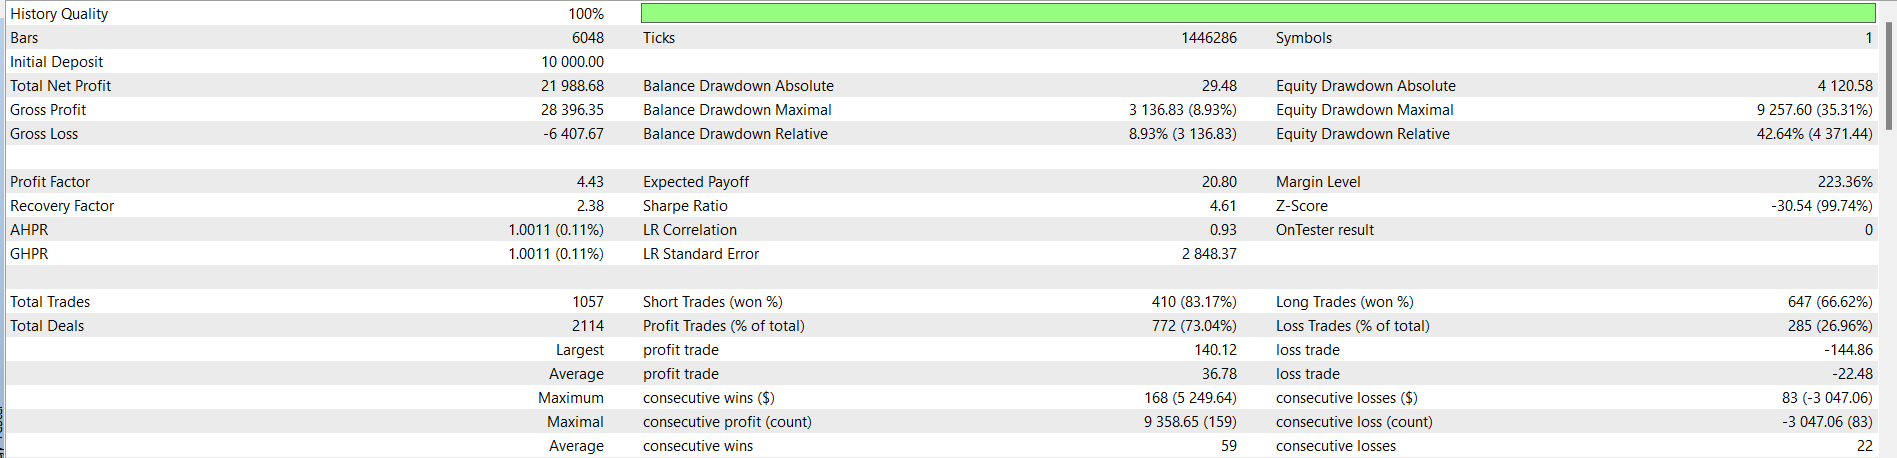
      If we apply a grid system, the EA is like this:
      https://fxdreema.com/shared/Bn9S4PwEd

      As a result, the WSO&WRO indicator is a "decisive" indicator. but it cannot produce a perfect trade report by itself. in this case we need to develop this indicator with "supporting" indicators.
      Separate your indicator pool in these breakdowns, it will be of great benefit.

      I tried to briefly explain the determining indicator, I would like to talk about supporting indicators in my next post.

      1 Reply Last reply Reply Quote 1
      • T
        tec.nacks last edited by

        Great content man.

        What is the WSO_WRO Indicator by the way, can you attach it to the post?

        1 Reply Last reply Reply Quote 0
        • P
          PhiLykia last edited by

          The "WSO" (Williams' %R with Overbought/Oversold) and "WRO" (Williams' %R Oscillator) indicators are based on a technical analysis tool called Williams' %R.

          Williams' %R is a momentum oscillator that measures the level of overbought or oversold conditions in a trading instrument. It was developed by Larry Williams and is also referred to as "%R" or "Williams Percent Range". The indicator calculates the relationship between the current price and the high and low prices over a specific period, typically 14 periods.

          The Williams' %R formula is as follows:
          %R = (Highest High - Close) / (Highest High - Lowest Low) * -100

          The resulting value oscillates between 0 and -100. Readings above -20 are considered overbought, indicating a potential reversal or correction to the downside. Readings below -80 are considered oversold, indicating a potential reversal or bounce to the upside.

          The "WSO" indicator typically includes additional levels to define the overbought and oversold thresholds, such as -20 for overbought and -80 for oversold. It helps traders identify potential trading signals when the price reaches extreme levels.

          https://www.abysse.co.jp/mt5-e/indicators/Wso and Wro.mq5

          T 2 Replies Last reply Reply Quote 0
          • T
            tec.nacks @PhiLykia last edited by

            @PhiLykia amazing stuff here

            1 Reply Last reply Reply Quote 0
            • T
              tec.nacks @PhiLykia last edited by

              @PhiLykia Can I have a MT4 version of this indicator?

              1 Reply Last reply Reply Quote 0
              • Alex81
                Alex81 last edited by

                Amazing concepts here, thaks @PhiLykia ! Seems like you used my martingale code!

                The only edge on the market is to lose less than you win...

                1 Reply Last reply Reply Quote 0
                • Alex81
                  Alex81 last edited by

                  Another way to use this indicator: put 2 instances with different periods in the same window, and look when all lines crosses over or under 50. It seems a good trend spotter.

                  image.png

                  The only edge on the market is to lose less than you win...

                  1 Reply Last reply Reply Quote 0
                  • P
                    PhiLykia last edited by

                    Let's see if we can achieve the "perfect" Expert Advisor using the indicator we took as an example.

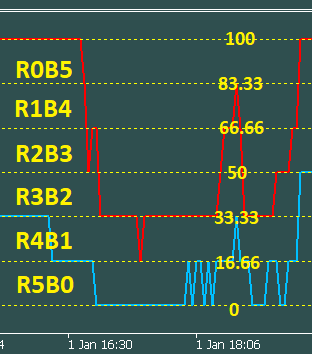
                    In this indicator, there are 6 zones with a range of 16.66. Let's see, what happens if you open a high lot BUY on R0B5, a low lot BUY on R1B4, a low lot SELL on R4B1, and a high lot SELL on R5B0?

                    Positions will only be opened at these levels, and outside this level is close position.

                    image.png

                    T 1 Reply Last reply Reply Quote 1
                    • T
                      tec.nacks @PhiLykia last edited by

                      @PhiLykia OOH, cool share the test link.

                      I'm here for you man

                      P 1 Reply Last reply Reply Quote 0
                      • T
                        themanking last edited by

                        This is awesome

                        Alex81 1 Reply Last reply Reply Quote 0
                        • P
                          PhiLykia @tec.nacks last edited by

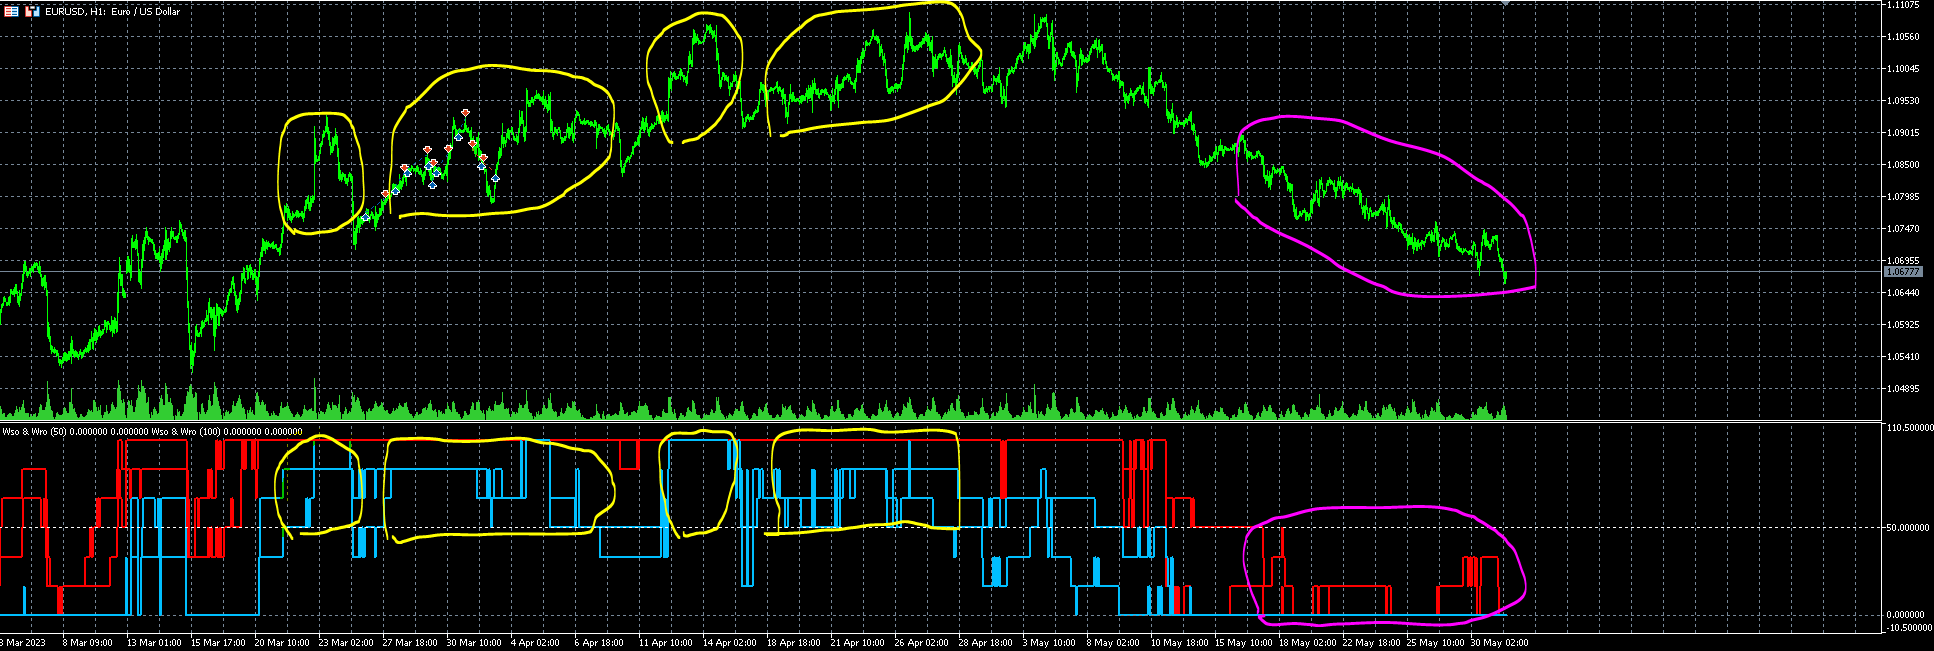
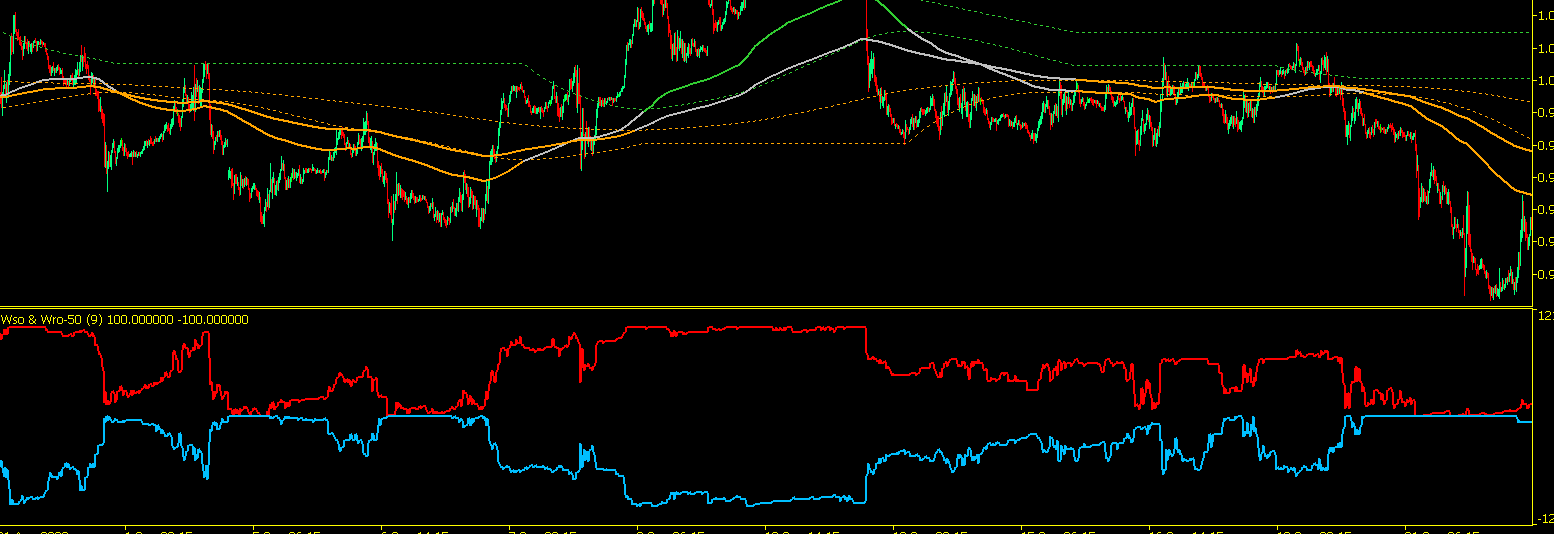
                          @tec-nacks Hello friend, I converted this indicator to 25 and 50 for smoother querying, you can find it in the attachment. As I mentioned in the previous message, you can use it to predict the trend direction. (If the red buffer exceeds the x value, it is considered a buying direction; if the blue buffer falls below the z value, it is considered a selling direction.)

                          Both reaching 0 and 100 values can indicate certainty. (For example, when both buffers are 100, the bull market can be said to have become clear; when both buffers are 0, the bear market can be described as starting.)

                          As I conveyed, it is a supporting indicator.

                          Wso and Wro_50.mq5 Wso and Wro_25.mq5

                          T 1 Reply Last reply Reply Quote 0
                          • T
                            tec.nacks @PhiLykia last edited by

                            @PhiLykia Hello man, Ohh that's interesting

                            1 Reply Last reply Reply Quote 0
                            • Alex81
                              Alex81 @themanking last edited by

                              Hi @themanking, very interesting upgrade! Could you explain the differences between the 2 versions?

                              The only edge on the market is to lose less than you win...

                              P 2 Replies Last reply Reply Quote 0
                              • P
                                PhiLykia @Alex81 last edited by

                                @Alex81
                                In principle, there is actually no difference. Only the levels get sharper.

                                For example, in one case you base the level of 24.33, while in the other you base it on the net figure of 25. This allows you to enter the level value more precisely when creating the condition. Like cutting above/below x level, up/down.

                                This version is sharper :

                                Wso and Wro_50.mq5

                                1 Reply Last reply Reply Quote 0
                                • P
                                  PhiLykia @Alex81 last edited by

                                  @Alex81

                                  In this version, one of the indicators is reverse (negative), which can be interpreted differently. Like when the indicators move further/closer. It can be used for trend reversals.

                                  Wso and Wro_neg50.mq5

                                  1969224d-a875-4340-920e-d82dbb7ead6f-image.png

                                  1 Reply Last reply Reply Quote 0
                                  • Alex81
                                    Alex81 last edited by

                                    Very very interesting, I will play with them to see which suits better my trend-following style.

                                    The only edge on the market is to lose less than you win...

                                    1 Reply Last reply Reply Quote 0
                                    • P
                                      PhiLykia last edited by

                                      image.png

                                      1 Reply Last reply Reply Quote 0
                                      • Alex81
                                        Alex81 last edited by

                                        My only concern is that your indicators are very heavy on the cpu, so the backtests are insanely slow... did you noticed it too? Any way to improve the code?

                                        The only edge on the market is to lose less than you win...

                                        1 Reply Last reply Reply Quote 0
                                        • P
                                          PhiLykia last edited by

                                          Although I have not experienced much negativity, it may be preferable to use the indicator ending in 25 rather than the one ending in 50, as it will be faster in terms of calculation.

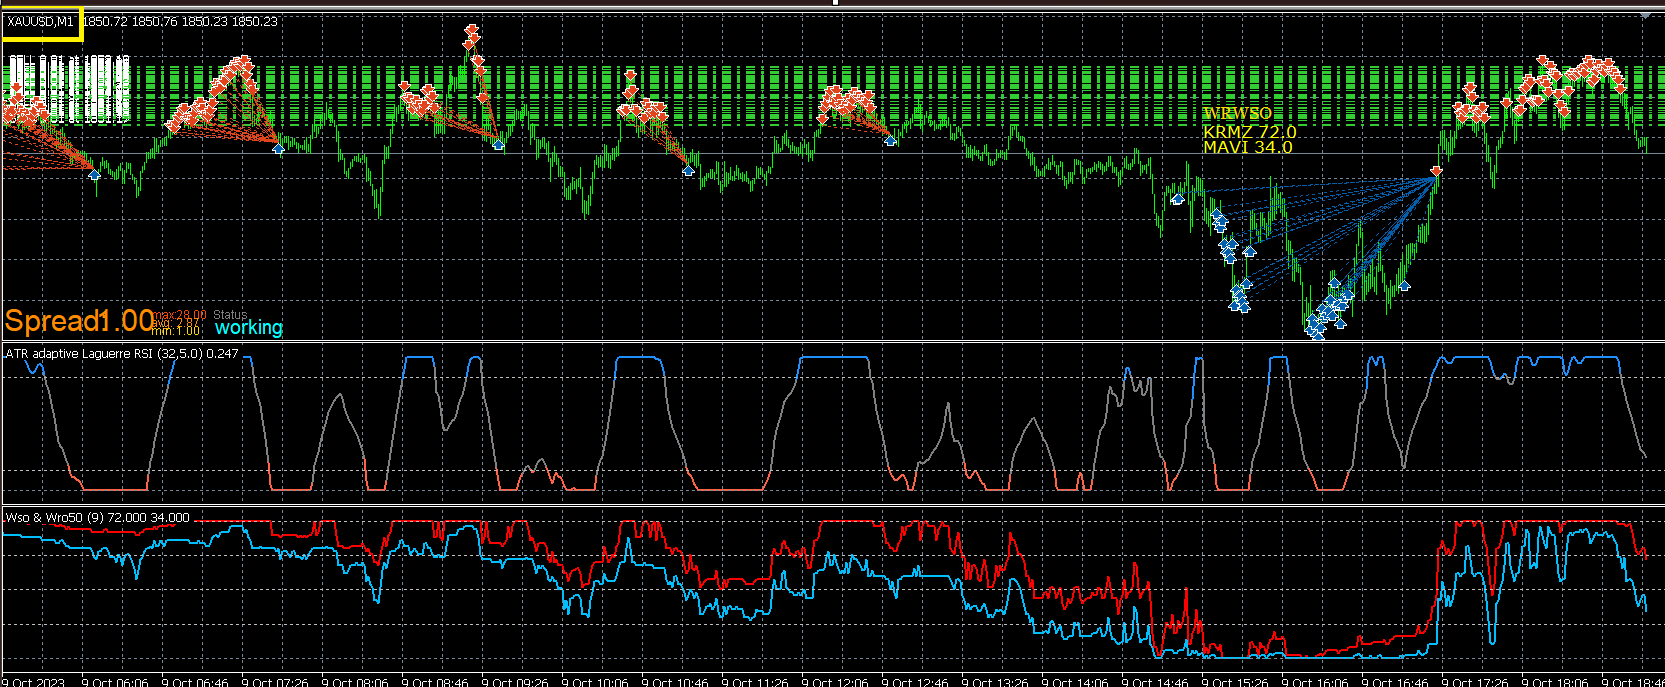
                                          However, if you use this indicator in front of the check box (ATR Leguare RSI v2 (By Mladen) in the example screenshot), this box will notice before the check.

                                          One more piece of advice. If you add the trend indicator control in the 2-3 upper periods, I'm sure the results will be more positive. For example, Half Trend, PTL, Alpha Trend etc. This way, you can continue buying or selling in the direction of the main trend.

                                          1 Reply Last reply Reply Quote 0
                                          • Alex81
                                            Alex81 last edited by

                                            50 is more accurate than 25, I mean it seems to avoid many false signals when used as a trend follower system.
                                            I saw you are using it as a reversal instead. I am having an insanely high accuracy on indices and gold on m1, but don't like it as a mean reversal indicator.

                                            The only edge on the market is to lose less than you win...

                                            1 Reply Last reply Reply Quote 0
                                            • 1
                                            • 2
                                            • 3
                                            • 1 / 3
                                            • First post
                                              Last post

                                            Online Users

                                            H
                                            E
                                            A
                                            G

                                            19
                                            Online

                                            146.7k
                                            Users

                                            22.4k
                                            Topics

                                            122.6k
                                            Posts

                                            Powered by NodeBB Forums | Contributors