fxDreema

    • Register
    • Login
    • Search
    • Back to the main page
    • Categories
    • Recent
    • Tags
    • Popular
    • Search

    need help creating

    Questions & Answers
    2
    28
    2276
    Loading More Posts
    • Oldest to Newest
    • Newest to Oldest
    • Most Votes
    Reply
    • Reply as topic
    Log in to reply
    This topic has been deleted. Only users with topic management privileges can see it.
    • G
      gunji80 last edited by

      this is just strange i do candle close id 1 is above mac-d mainline,
      candle close id 1 is below mac-d mainline and it just do all sells so then I do mac-d line is above candle id 1 for buys then candle id 1 is below mainline for sells and it still do all buys even tho when both set to same it sell then change for both buy and sell and it just buy i dont understand it make no sense

      1 Reply Last reply Reply Quote 0
      • T
        trader.philipps @gunji80 last edited by

        @gunji80 So signal line you don't care on MACD at all, right?

        Check this chart.
        0_1569563263735_Auswahl_585.png

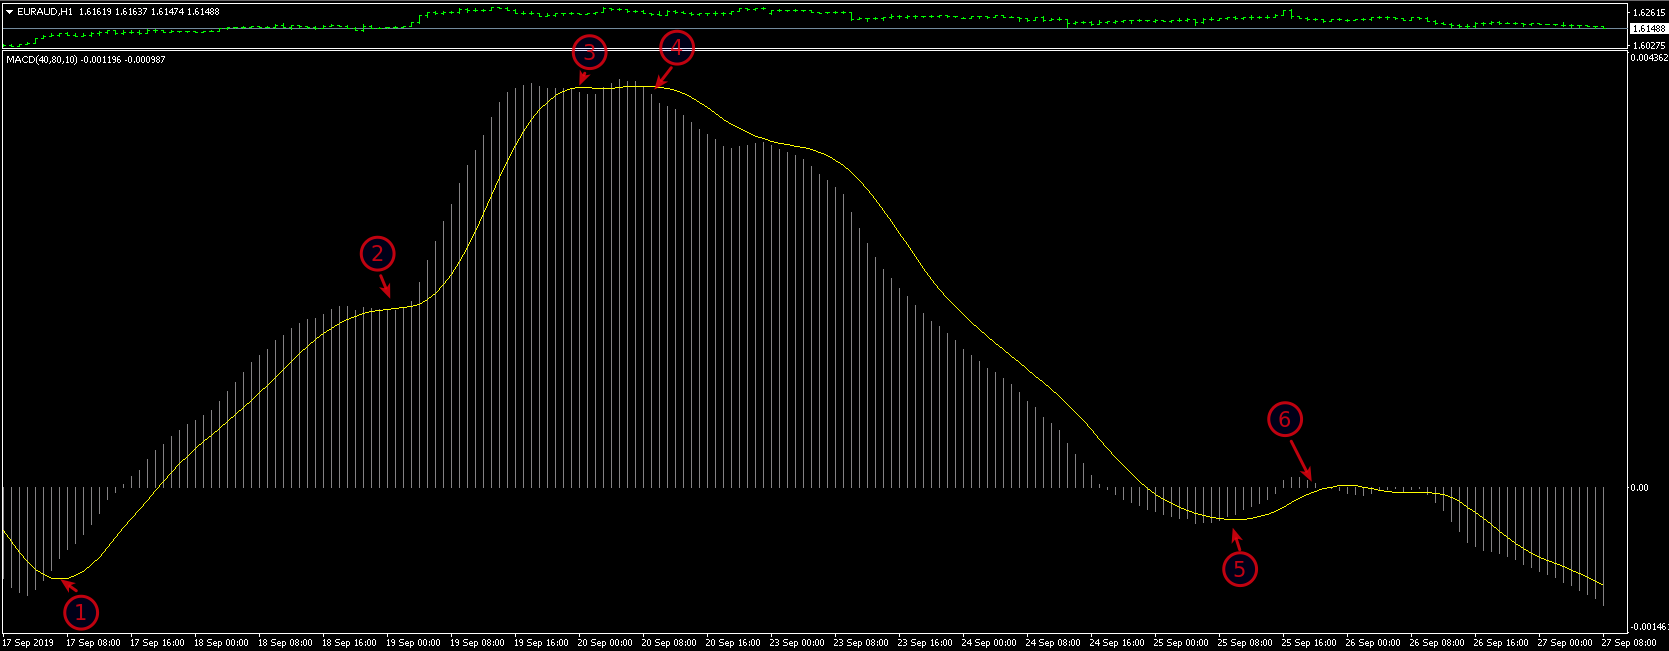
        Where woul you enter?

        I like to share my knowledge, but expect the others to contribute as well.

        1 Reply Last reply Reply Quote 0
        • G
          gunji80 last edited by

          ok i give up it not make sense it half work so either all buys or all sells and not work together on buy and sells explains why mac-d is a hard indicator to use in a project. I personaly think the indicator has been programed wrong in the block but that is just my opinion

          1 Reply Last reply Reply Quote 0
          • G
            gunji80 last edited by

            no i do care about the signal line it must be above or below the current candle on the histo but it s not really that important if the candles on the chart work the same way. as long as your number 1 trades till your 3-4 min but would be better if traded till your 6 as i would think that is change of trend right?

            1 Reply Last reply Reply Quote 0
            • G
              gunji80 last edited by

              or your 5 as it crossed the 0.00 line

              1 Reply Last reply Reply Quote 0
              • G
                gunji80 last edited by

                normally i would enter trade near 1 and exit at 3 for buy then sell at 4 and exit at 5 but that chart indicates that that trend has changed and continued to go down from for even tho it cross below and above the 0.00 3 times so trading manually i would enter at 4 then close some point after 6 as trend not finished

                1 Reply Last reply Reply Quote 0
                • G
                  gunji80 last edited by

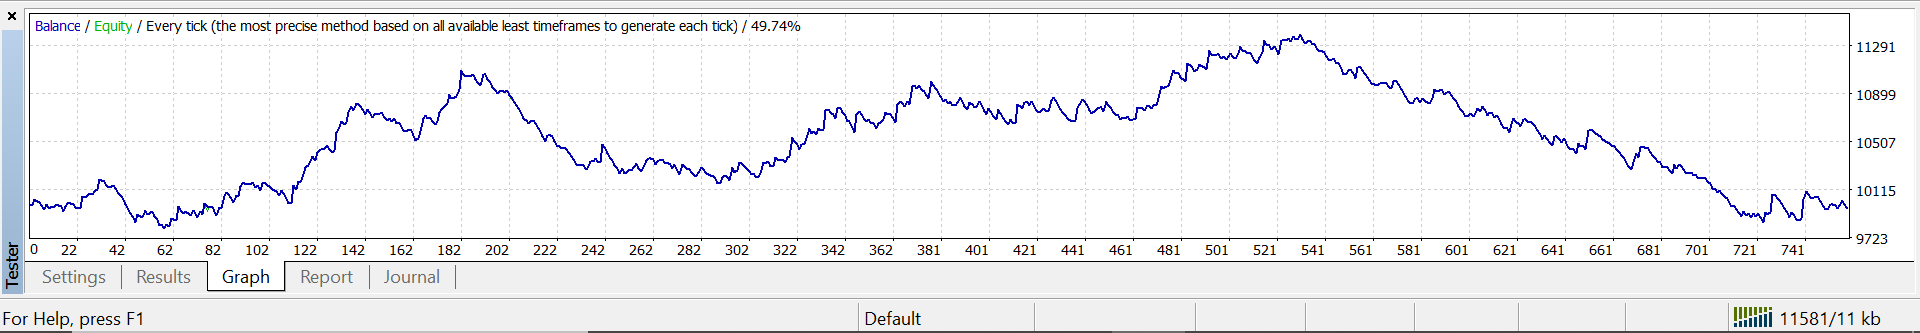
                  https://fxdreema.com/shared/vo3GCbLzb
                  got a buy and sell trade to work finally using this set up 🙂 just need to fine tune and pt some variables in and should be good

                  1 Reply Last reply Reply Quote 0
                  • G
                    gunji80 last edited by

                    0_1569569661279_Screenshot (62).png
                    standard input results much better than just x> or x<

                    1 Reply Last reply Reply Quote 0
                    • 1
                    • 2
                    • 2 / 2
                    • First post
                      Last post

                    Online Users

                    S
                    T
                    A
                    Y
                    H
                    B
                    K

                    32
                    Online

                    146.7k
                    Users

                    22.4k
                    Topics

                    122.6k
                    Posts

                    Powered by NodeBB Forums | Contributors