@roar okie dokie..... i see now... thanks ever so much!!
if only we could predict the future......
F
Best posts made by fxgjg
-
RE: Why doesn't my EA place trades when i use a negative (-) value for the MA shiftposted in Questions & Answers
-
RE: EA error for no stop loss and no take profitposted in Bug Reports
i'm not sure what had happened.. but the stop loss error seemed to have resolved itself.... i have no clue what i may have done wrong....
thanks for all your help -
RE: Problems to check average profit or check profitposted in Questions & Answers
@l-andorrà ok so ive moved the block over to the 'on tick' tab... works fine BUT puts in multiple orders...i.e so as long as the trade is in profit by over 10 pips it will keep placing new orders...... hmmmm. how can i solve this?
Latest posts made by fxgjg
-
How can plot on the chart an MA line from a higher time frame to a lower time frame?posted in Questions & Answers
How can plot on the chart an MA line from a higher time frame.
For example while viewing the 5 minute chart, how can i draw a SMA line from the 15 minute time frame so i can see it on the 5 chart?
Thanks -
RE: How to plot on the chart an MA line from a higher time frame.posted in Questions & Answers
This does not seem to work can you explain further?
-
How to plot on the chart an MA line from a higher time frame.posted in Questions & Answers
How can plot on the chart an MA line from a higher time frame.
For example while viewing the 5 minute chart, how can i draw a SMA line from the 15 minute time frame so i can see it on the 5 chart?
Thanks -
How can I place trades above and below Horizoltal Linesposted in Questions & Answers
Hi
I have created red and blue horizontal lines on the chart but i cannot place my buy and sell trades above the blue line and below the sell line. Help please.
I have attached to link to my project below. Please let me know where i am going wrong?
Thanks -
RE: How to place BUY/SELL trades above and below horizontal lines on the chartposted in Questions & Answers
Thanks jstap. but this will not work as I need to has stricked an specific buy and sell points.
In your reply if multiple candles open and close but candle 1 never closes 10 pips in profit over candle 0 then no trades will be placed.
This will not work well -
How to place BUY/SELL trades above and below horizontal lines on the chartposted in Questions & Answers
Hi
I have created red and blue horizontal lines on the chart but i cannot place my buy and sell trades above the blue line and below the sell line. Help please.
I have attached to link to my project below. Please let me know where i am going wrong?
Thanks -
RE: Renko Chartsposted in Questions & Answers
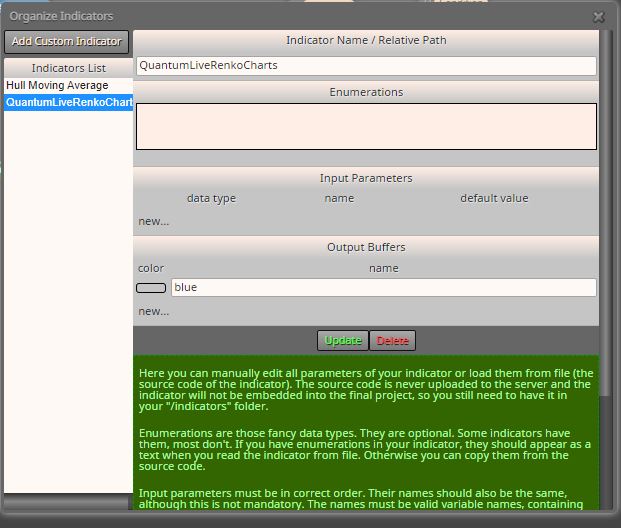
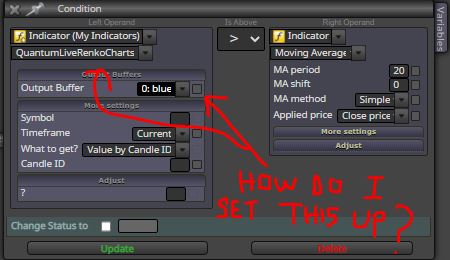
@l-andorrà ok... so i have already uploaded the Renko offline chart as a custom indicator...but in the condition settings i have no uption to identify the candle high/low, bullish or bearish.. To be honest i don't know how to set up the input and output parameters and the enumerations...
-
RE: Renko Chartsposted in Questions & Answers
@l-andorrà thanks ALL...
i inly need to know if it is posible to identify with fxDreema, a bullish renko candle and a bearish renko candle.?Thanks
-
RE: Renko Chartsposted in Questions & Answers
@l-andorrà thanks, sorry for the late reply.
link below.The condition i would like to set up is to be able to read the highs and lows of the Renko bricks and/or whether the brick is bulish or bearish on close
i have make a feeble attempt of setting up the enumerations and buffers... HELP -
Renko Chartsposted in Questions & Answers
Hi there...
I've placed my renko chart (mt4), uploaded as costum indicator.
However, I cannot seem to get it to work in the condition block.. I.E. brick high/low, brick open/close etc.
Browsed through the forum but could not find a suitable answer..