You can use objects (such as Arrow Down) to draw your fractal highs based on your specified conditions (such as the attached image).
Then, to compare between FH2 and FH1:
- Use the loop operation block - "Loop for Chart Objects" > "For each Object".
- Include 2 conditions under this block,
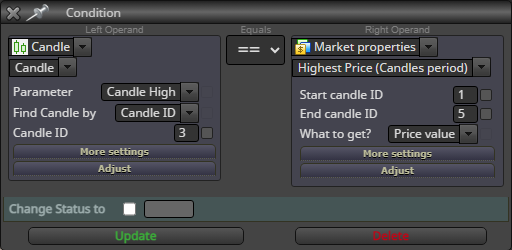
- The same condition as the image and
- Candle(3) high < (is below) Price level 1 of the object taken from the loop
You may need another separate object (Arrow Up) for your fractal lows and just switch the above conditions to the opposite.