Drawing a line in another chart
-
Does someone know a way to draw a line (or any object) in a secondary chart? I:e using AUDUSD variables to draw a line in EURUSD within the same EA logic. There doesn't seem to be a "Symbol" option like in other blocks.
Thank you.
-
You select AUDUSD in the 'Symbol' option in all necessary condition blocks but run the EA on the EURUSD chart.
(English) I will try to help everyone in these fxDreema forums. But if you want to learn how to use the platform in depth or more quickly, I can help you with my introductory fxDreema course in English at https://www.theandorraninvestor.eu.
(Català) Miraré d’ajudar tothom en aquests fòrums d’fxDreema. Tanmateix, si vols aprendre a fer servir la plataforma amb més profunditat o més de pressa, t’hi puc ajudar amb el meu curs d’introducció a fxDeema en català a https://www.theandorraninvestor.eu/ca.
(Español) Intentaré ayudar a todo el mundo en estos foros de fxDreema. Sin embargo, si quieres aprender a usar la plataforma en profundidad o más deprisa, te puedo ayudar con mi curso de introducción a fxDreema en español en https://www.theandorraninvestor.eu/es.
-
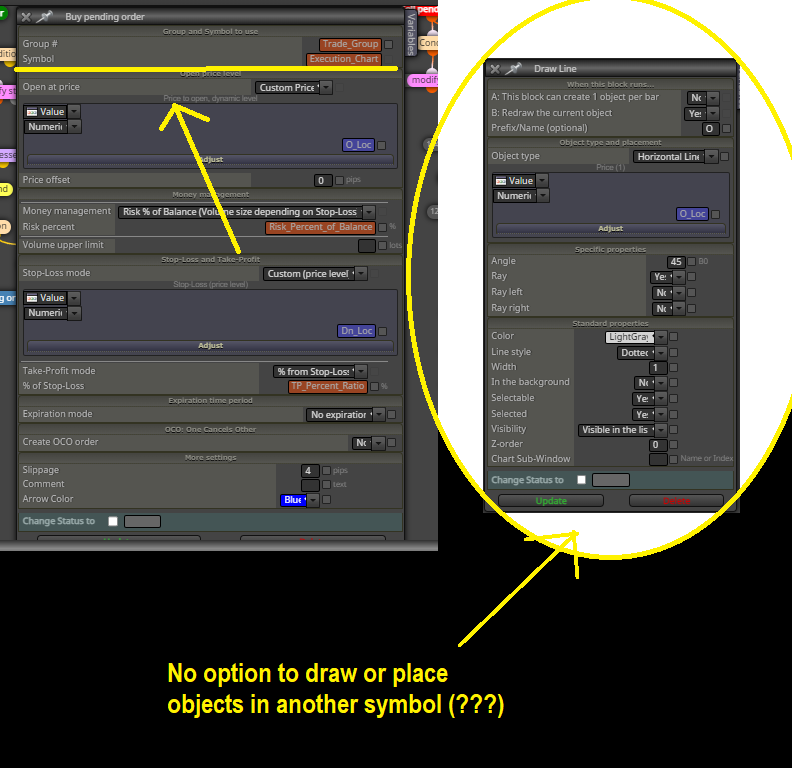
Hi @l-andorrà, thanks for the response, but if I do that I would be able to see the line on EURUSD (or whatever instrument the EA is attached to), but it would NOT draw and update on AUDUSD because there is no secondary "symbol" option in the "draw" block configuration. In other words, it only seems to be able to draw objects on the current symbol the EA is attached to.
I could use global variables and two EAs to synchronize these objects, but I would like to know if there is a simpler solution that can be executed from a single EA instead of using two.
This is the EA I try to use: https://fxdreema.com/shared/BUf6SjRVc . It is a scalping tool that uses horizontal level variables and objects (for visualization) to trade renko charts.
MT5 doesn't allow trading/execution on custom charts directly, but the EA can handle that already. I just need help to synchronize the objects in both charts using the same EA.
-
The problem here is for this to work you would need the two charts open, but then the EA would have to know the chart number, in case you have 2 or more charts of the same symbol open.
Learn fxDreema Without the Wait!
My comprehensive book, available on Amazon, is packed with examples and invaluable insights to help you fast-track your learning journey.
The paperback and hardback editions include MT4 & MT5 QR codes for easy access to all prebuilt projects and robots, including my latest gold trading robot!
Don’t miss out
Click here➡️ https://mybook.to/fxDreema to get your copy today!
Enjoy! 😊
-
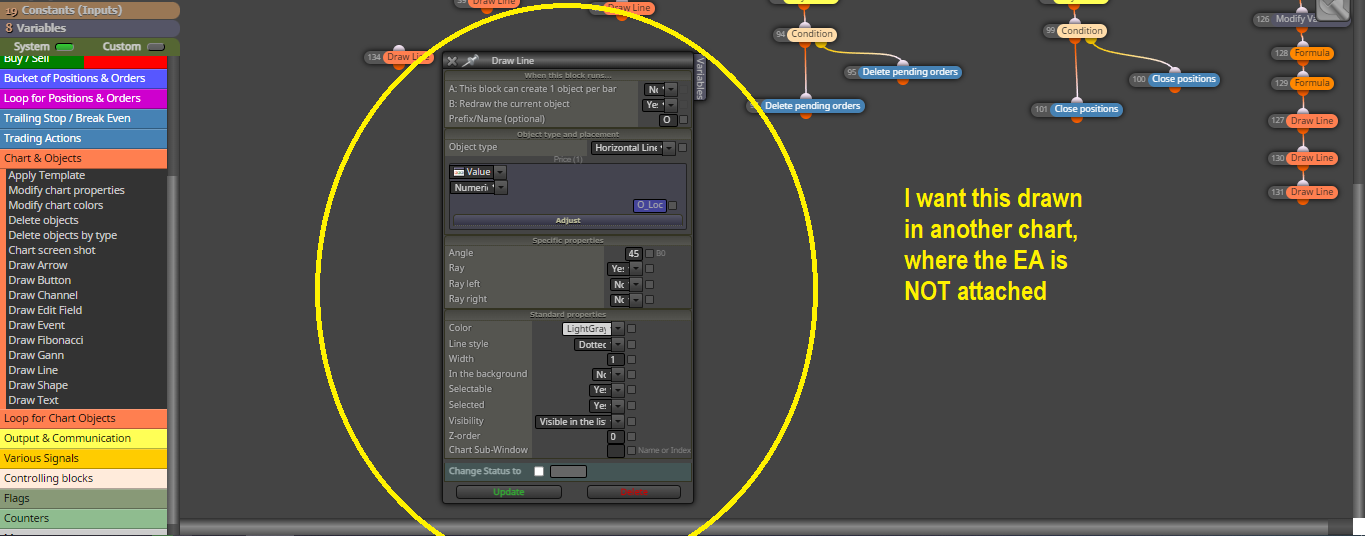
@jstap Yes! An example to clarify: Chart #1 is "EURUSD_Renko" which is a custom chart I create and attach the EA into. The EA plots different lines for entry, TP and SL of hypothetical pending orders, this helps me visualize the ranges before I put an order. But it is impossible to execute directly on custom charts (MT5), so the EA sends an order to the original live chart "EURUSD" (chart #2) to do this. I have no problem reading or executing on a second chart, the problem is that I cannot draw or update an object on the second chart because there doesn't seem to be an option for any "draw" blocks:
I want to be able to analyze/view these ranges/objects in both the custom chart (renko chart) and the execution chart (time bar chart).
-
This would be a lot of work and custom code.