How to find divergences in the graph and indicator?
-
Hello friends, could someone help me find divergence
 in a different way?
I know that there is a "MACD" divergence block and even a topic that the target teaches how to use.
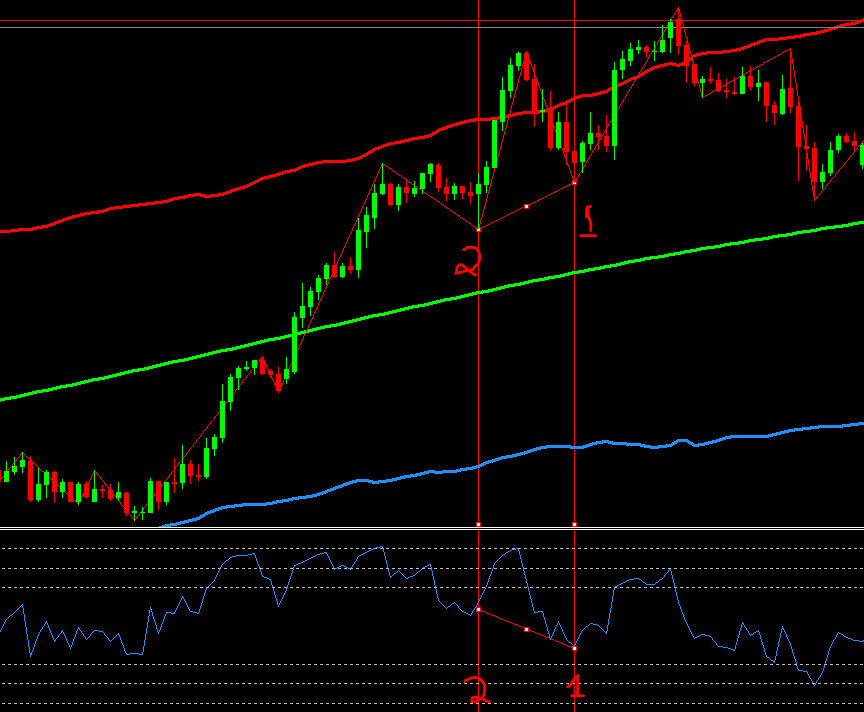
But my question goes a little further ... come on:In the image I found with the help of the RSI and the Zig Zag a divergence, while the RSI registered that fund 1 was lower than fund 2 in the graph it was registered that fund 1 was higher than fund 2, so in this case I think there was a difference.
What I would like to do is to know when this happens but in the following way:
- Create a rule to always check the last 2 funds on the currency chart.
- Insert 2 vertical lines marking the respective candles that correspond to these 2 located funds.
- Take advantage of these lines to then locate on the RSI (or any other indicator, it may be the macd) 2 funds in the same range of candles.
- Identify if the "divergence between them occurred in this interval.
- If it happened then to place a warning, perhaps a mark indicating that it happened to be a sign of possible entry.
-
@fabiobioware The most efficient way to get that is hiring a programmer to create that specific custom indicator and the import it into your EA here. Trying to do that here with conditions can be simply a headache.
-
@l-andorrà it's true my friend, i already realized that many people had a headache with this subject, thanks for the information.
-
In your picture you must know 1=ZZ low id 0,2=ZZ low id1
in block"condition "
indicator ZigZag mode low by id 0 > mode low by id 1
and then you must know ZigZag mode low by id 0 and ZigZag mode low by id 1 == candle id ?
in block"condition "
indicator ZigZag mode low by id 0 == candle candle id [you replace with "variable1 "]
in block"condition "
indicator ZigZag mode low by id 1 == candle candle id [you replace with "variable2 "]
For indicator [macd,rsi]
in block"condition "
indicator macd candle candle id [you replace with "variable1 "] < macd candle candle id [you replace with "variable2 "]
if you want EA draw line ,you can add draw line block below block"condition " -
@worapongk1 I have something similar to this which I am working on, maybe quite simpler because it is synthetics, can you be of help to me on it? I'll share details with you in your personal chat
-
I am not very good at divergences, but if it helps, if you have the candle ID for high and low, you can compare indicator values vs candle price values
-
Posted a divergence with zigzag and stochastic you you can download that project and use it change the stochastic to RSI the condition is practically thesame , go on my profile and you will find it