Open trade when market shows uptrend or downtrend based on candle
-
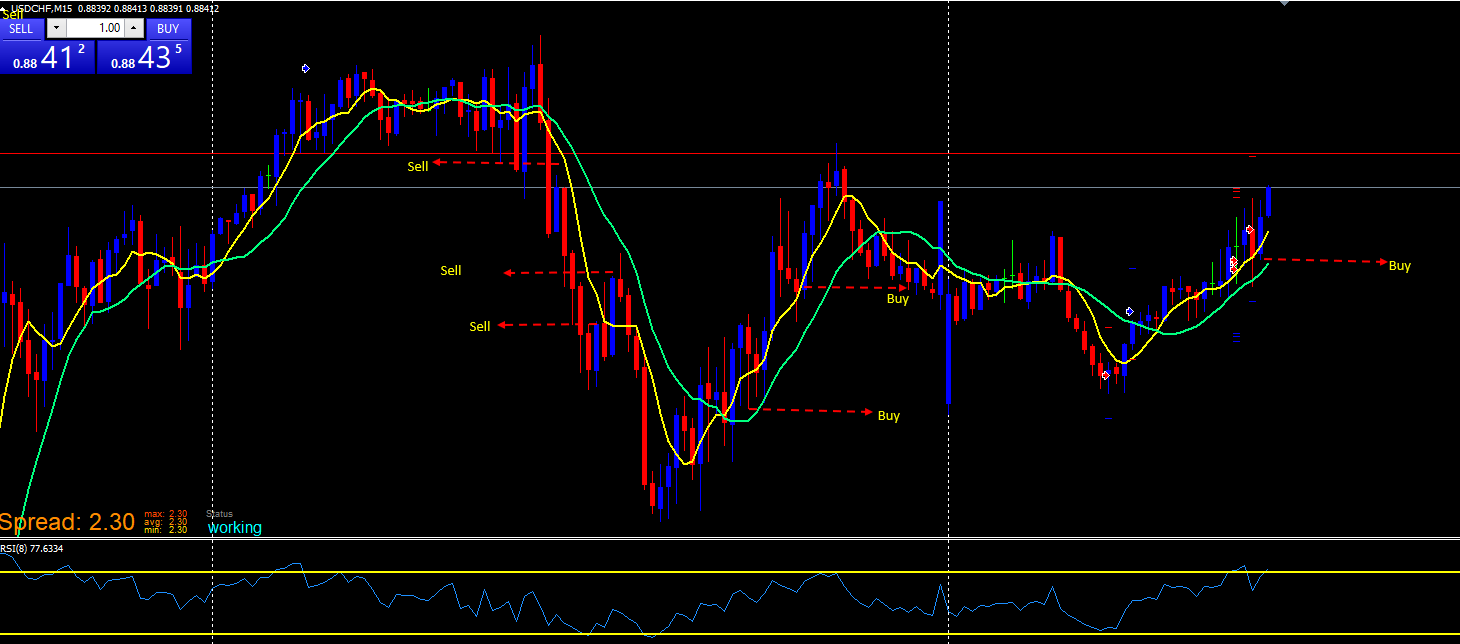
How to open buy trade when candle crosses above the EMA6 & EMA26 and it will open after one bar of bearish candle and followed by bullish candle as shown below. And how to set sell trade when the trend shows instead with the same condition.
-
I don't fully understand the image. I see 3 sell positions pointing out three high prices on bullish candles that are in different positions through both MA. Could you please be more specific?