What is your opinion on this backtest?
-
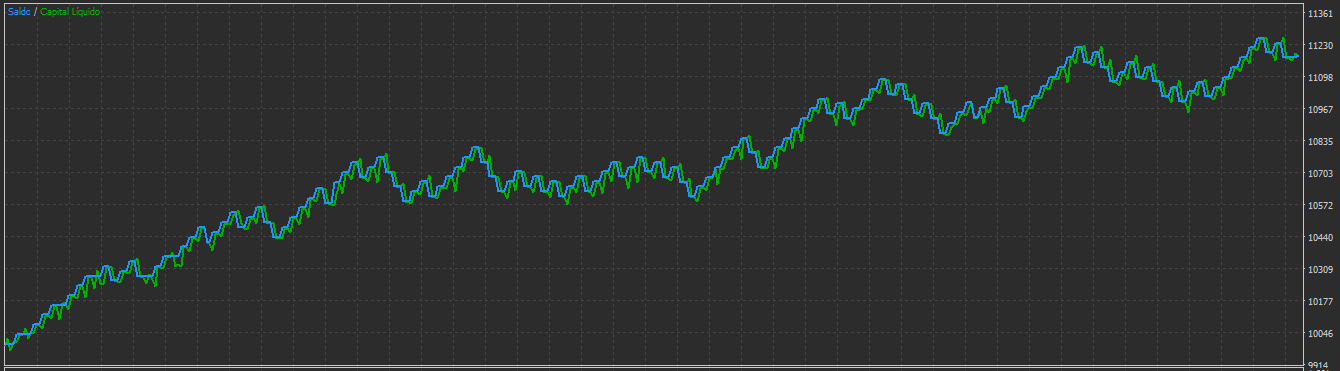
I created an indicator and automated its use in an EA here at Fxdreema and I realized that it looked cool, I did a backtest this year, what did you think of this result?
XAUUSD H1 TP 4000 points and SL 6000 pointsResults Backtes below:
-
I asked ChatGPT to translate and asses. On a personal note, Gold is generally bullish, so maybe cut sells entirely, but seems to work, now set it on demo and painfully watch to check account results are same as backtest (probably will be as your stops are sensible).
Here’s the full translation of the trading report from Portuguese to English:
 Trading Report Summary
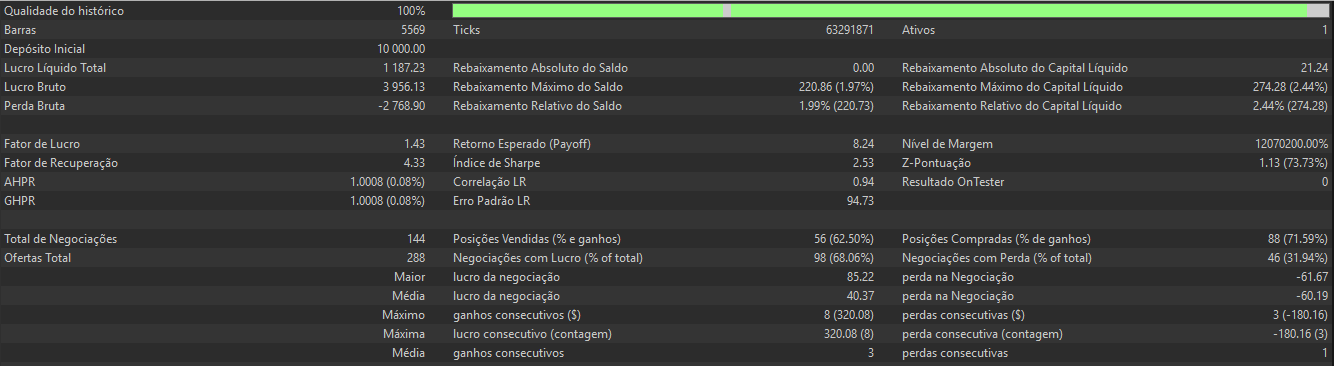
- History Quality: 100%
- Bars: 5,569
- Ticks: 63,291,871
- Assets: 1
 Account Performance
- Initial Deposit: 10,000.00
- Total Net Profit: 1,187.23
- Gross Profit: 3,956.13
- Gross Loss: -2,768.90
 Drawdown Metrics
Balance Drawdown:- Absolute: 0.00
- Maximum: 220.86 (1.97%)
- Relative: 1.99% (220.86)
Equity Drawdown: - Absolute: 21.24
- Maximum: 274.28 (2.44%)
- Relative: 2.44% (274.28)
 Risk & Return Indicators
- Profit Factor: 1.43
- Recovery Factor: 4.33
- AHPR (Average Holding Period Return): 1.0008 (0.08%)
- GHPR (Geometric Holding Period Return): 1.0008 (0.08%)
- Expected Payoff: 8.24
- Sharpe Ratio: 2.53
- Linear Regression Correlation: 0.94
- Linear Regression Standard Error: 94.73
- Margin Level: 12,072,000.00%
- Z-Score: 1.13 (73.73%)
- OnTester Result: 0
Trade Statistics- Total Trades: 144
- Total Orders: 288
Trade Breakdown: - Sell Positions (win rate): 56 (62.50%)
- Buy Positions (win rate): 88 (71.59%)
- Profitable Trades (% of total): 98 (68.06%)
- Losing Trades (% of total): 46 (31.94%)
 Trade Outcomes
- Largest Profit per Trade: 85.22
- Largest Loss per Trade: -61.67
- Average Profit per Trade: 40.37
- Average Loss per Trade: -60.19
 Strengths
• Net Profit: £1,187.23 on a £10,000 deposit is a solid 11.87% return.
• Profit Factor (1.43): Indicates the strategy earns £1.43 for every £1 lost—respectable, though not elite.
• Sharpe Ratio (2.53): Excellent. Suggests strong risk-adjusted returns.
• Drawdown Control:
• Max equity drawdown: 2.44%—very low, showing tight risk management.
• Max balance drawdown: 1.97%—also minimal.
• Trade Consistency:
• 68% win rate overall
• Buy trades win 71.59%, sell trades 62.5%—suggests directional bias is well-handled.
• Recovery Factor (4.33): Shows resilience after losses. ️ Weaknesses or Areas to Watch
• Average Loss (-60.19) vs. Average Win (40.37):
You're losing more per losing trade than you're gaining per winner. This could be a red flag unless the win rate compensates—which it mostly does here.
• Largest Loss (-61.67) vs. Largest Win (85.22):
Not extreme, but worth monitoring. If losses spike, it could erode the edge.
• Z-Score (1.13, 73.73% confidence):
Indicates some statistical edge, but not overwhelming. Could be improved with more trade data or tighter entry logic.🧠 Strategic Takeaways
- This strategy is stable and scalable. The low drawdowns and high Sharpe ratio suggest it could handle larger capital without breaking.
- Risk-reward ratio needs tuning. If you can reduce average loss or increase average win—even slightly—you’ll compound gains faster.
- Directional bias is working. Long trades outperform shorts. You might consider optimizing short entries or even filtering them out if they’re dragging performance.
Want help visualizing the equity curve or comparing this to another strategy? I can chart it out or run a deeper analysis.
 Streaks
- Max Consecutive Wins ($): 8 trades (320.08)
- Max Consecutive Losses ($): 3 trades (-180.16)
- Max Consecutive Profit (count): 320.08 (8)
- Max Consecutive Loss (count): -180.16 (3)
- Average Winning Streak: 3
- Average Losing Streak: 1
Learn fxDreema Without the Wait!
My comprehensive book, available on Amazon, is packed with examples and invaluable insights to help you fast-track your learning journey.
The paperback and hardback editions include MT4 & MT5 QR codes for easy access to all prebuilt projects and robots, including my latest gold trading robot!
Don’t miss out
Click here➡️ https://mybook.to/fxDreema to get your copy today!
Enjoy! 😊
-
My opinion: It is crap.
-
@jstap Thank you very much, I appreciate your analysis, you are very talented.
Sou do Brasil e utilizo o sistema Fxdreema a alguns anos, sempre que tenho tempo disponível eu tento ajudar alguém por aqui, mas se quiser uma ajuda mais próxima me contacte:
Site: https://www.ontradingx.com.br
Youtube: https://www.youtube.com/@ontradingx
Boa sorte a todos nós!English - I'm from Brazil and I've been using the Fxdreema system for a few years, whenever I have time available I try to help someone here, but if you want more help, contact me:
Website: https://www.ontradingx.com.br
Youtube: https://www.youtube.com/@ontradingx
Good luck to all of us! -
@OntradingX You are welcome