HOW I CAN USE MACD LINE (0) TO BUY AND SELL through WILLIAMS R%?
-
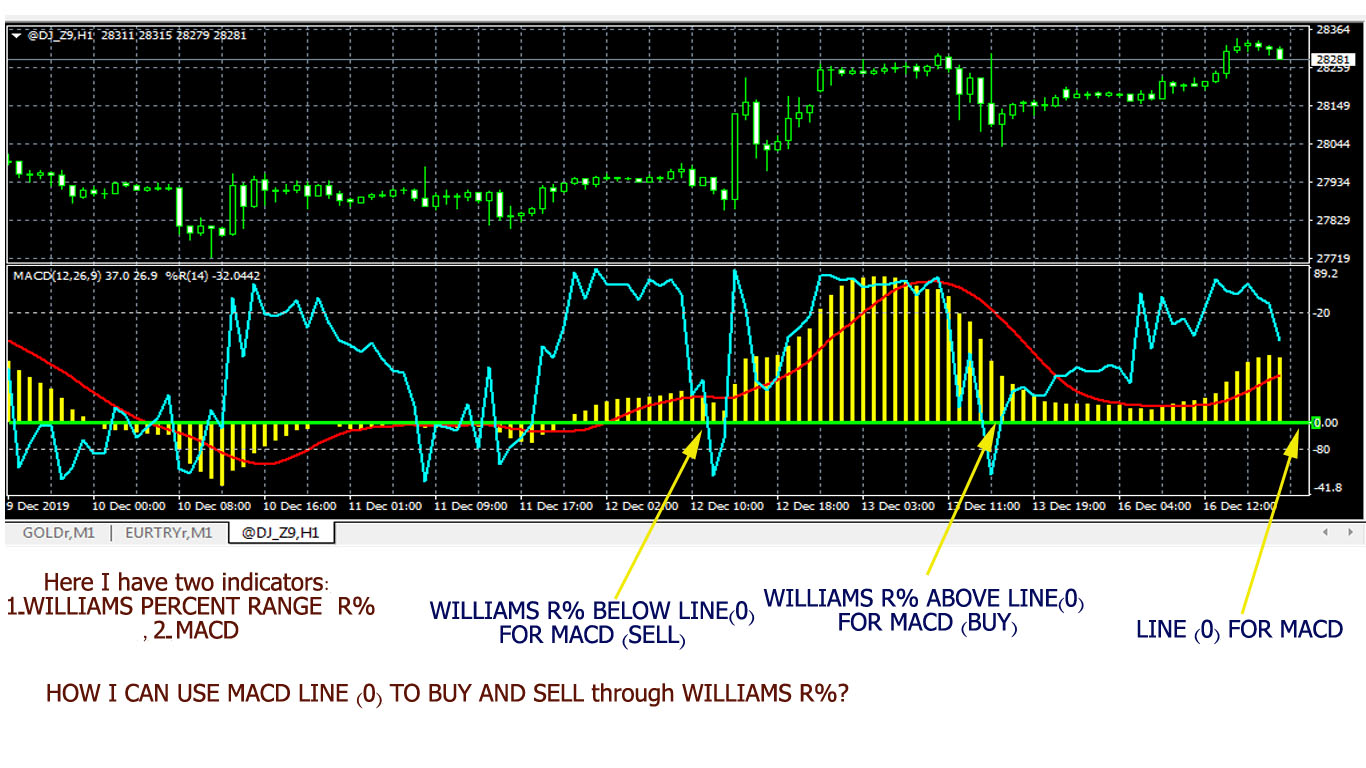
In the picture two indicators were used
1- MACD
2- WILLIAMS PERCENT RANGE R%As is known, the first (MACD)has a positive and negative value around zero .
The second (WILLIAMS R%)is all negative value.I WANT When William crosses the zero line for the MACD ABOVE, I want to start buying AND When William crosses the zero line for the MACD BELOW, I want to start SELLING .
How can I use the zero line in the MACD with William IN EA ?
-
You want to compare MACD and W% ?
Why? They dont use the same scale.Williams never crosses the zero line.
Need small help? Tag me in your post
Need big help? https://www.fiverr.com/big_algo/automate-your-winning-strategy-in-mql4-or-mql5 -
@roar YES I WANT USE LINE 0 (MACD) ONLY.
These settings give better results, the default settings should wait for the rise or fall.I found that these settings give better and powerful results.
On a quarter hour candleI want to merge the MACD zero line in the William Index so that only EAs can understand it
-
@khalids222 Williams does not cross 0 line.
It only looks like it crosses the macd, because you force the two indicators to the same window. If you move the chart backwards, you will see that the "0-line cross" will change its place, because its just a graphical phenomenon.Need small help? Tag me in your post
Need big help? https://www.fiverr.com/big_algo/automate-your-winning-strategy-in-mql4-or-mql5 -
@roar said in HOW I CAN USE MACD LINE (0) TO BUY AND SELL through WILLIAMS R%?:
@khalids222 Williams does not cross 0 line.
It only looks like it crosses the macd, because you force the two indicators to the same window. If you move the chart backwards, you will see that the "0-line cross" will change its place, because its just a graphical phenomenon.Thank you, I mentioned that, when I said negative values.
I know the William index does not cross zero.
I want to use the zero for the MACD specifically, to cross it from the William line.
I hope the issue is clear.
The merging of the two indices is required so that if William crossed the zero line for the MACD, it would be a buy and vice versa -
You can literally "make the Williams to cross the MACD 0-line" by just scrolling with your mouse, or changing the scale setting. Its only graphical, you can't make an ea of that.
From your picture, you can estimate that the corresponding Williams level would be something like -70. Go ahead and make a condition: williams cross -70 level. If you then put the MACD to the same window, it will look like the william crosses the MACD 0-line. But when you scroll the chart, the level is suddenly -75, -65, -35, anything..
Need small help? Tag me in your post
Need big help? https://www.fiverr.com/big_algo/automate-your-winning-strategy-in-mql4-or-mql5 -
@roar thank you very much