Trend on m1 timeframe
-
I would like to know, it is possible to create a condition that allows to identify possible trends, or trend formations in the timeframe graph m1.
If so, could you give some examples?
-
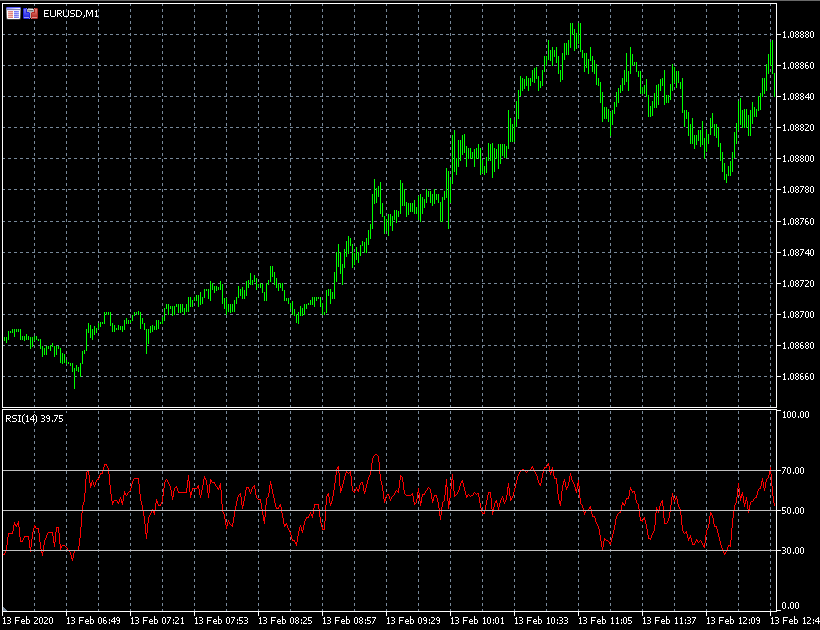
A long trend on m1 is just a small swing on m5, everything is relative.. This is why I would use the RSI, even though its not usually referred as a "trend indicator"
In my opinion, trying to hunt stable trends is very problematic anyway. The better "trend" you want to find, the more likely that trend is approaching its end.
-
I agree, i personally stopped using trend strategies(as secondary signal) as it made me miss a lot of opportunities(with EMAs) and often worst results. As well you can see that the EMA crossing over strategie is mostly losing.
How do you use the RSI tho, the longer the value has been under 70 the stronger is the trend ? -
@seb-0 RSI 50-line is often a rough measure of up/down. To get more filtering, add a longer period RSI...
Need small help? Tag me in your post
Need big help? https://www.fiverr.com/big_algo/automate-your-winning-strategy-in-mql4-or-mql5 -
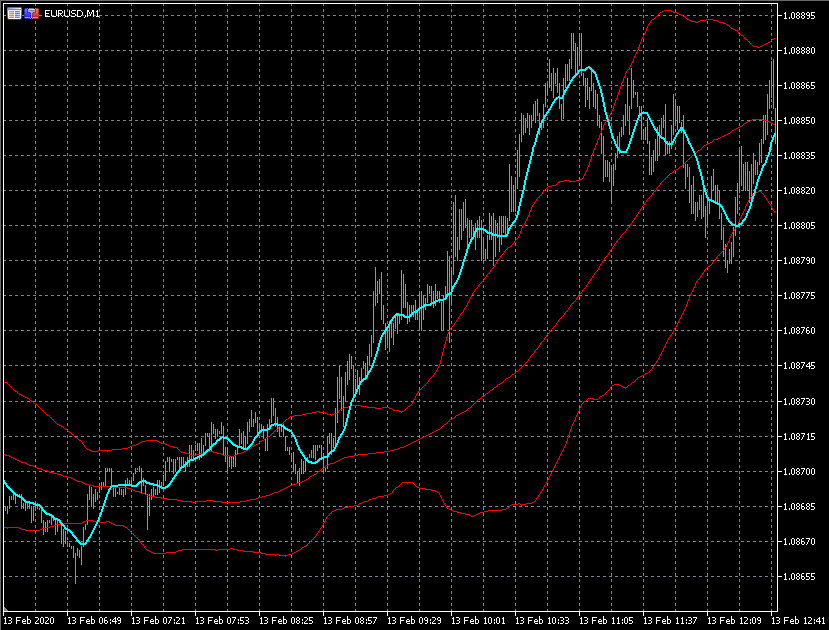
Another trick I like to use is shifted bollinger bands. If the price is above/below the bands, it has broken the recent range. To get more filtering, compare bb to moving average instead of candle closes.
Anyway, indicators are just tools, it's the implementation that matters.
-
@roar
stronger is the down trend*
Spotting trends seems actually more complex than i thought. I guess I can use these indicators to spot a trend when they are converging: rsi above 50 line for a minimum time, MA above upper bollinger band for a minimum time -> possible up trend.
I'm gonna try that : )