Draw High-Low Lines in Chart
-
Hello, I want to create an EA that draws the lines of the previous day's high and low on the chart. However, the lines should only be drawn until the next signal or, alternatively, the old ones should be deleted when the new signal comes.
I've already started a project, but I'm not getting anywhere right now ... It would be nice if someone could tell me the mistakes in my project.
-
@jjot Try this for daily highs:
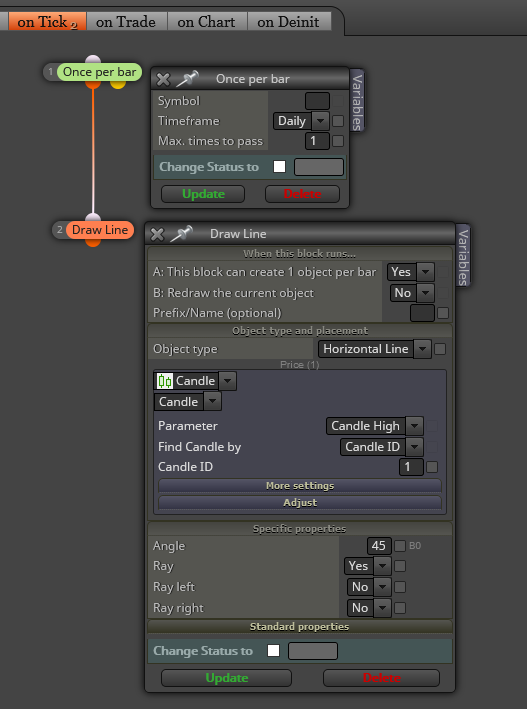
Now add another 'Draw line' for lows. However, I'm not completely sure about the second requirement. Can you please specify a bit more?
-
@l-andorrà Thanks for the answer, I tested it. Unfortunately, all lines of the past days are still continued in the chart. Only the signal lines of the last day in the current day should be displayed.
My idea is to develop an EA as an indicator function that plots the highs and lows as well as the opening and closing prices of the previous day, based on a selected period (e.g. 9:00 a.m. - 5:30 p.m.) in the chart for the current day.
Do you have any idea how I could implement this?
-
@jjot Then add this part:
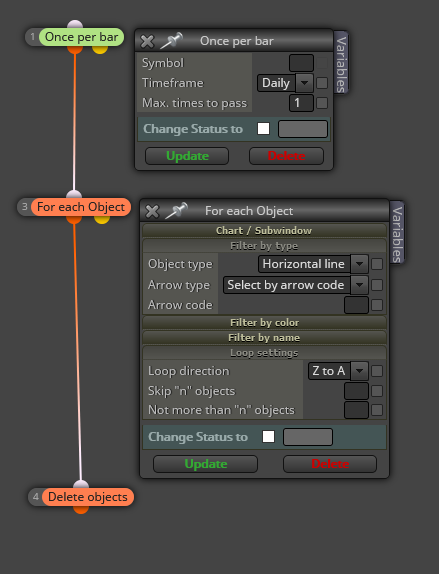
And then change the number of the 'Once per bar' block in my previous image from 1 to 2.
-
@l-andorrà Thank you! I have created my EA indicator, but unfortunately not all lines are displayed correctly. I want to draw the following lines:
Previous day high - time period 09:00 - 23:00
Previous day low - time period 09:00 - 23:00
Previous day opening - 9:00 am
Previous day close - 23:00 am
Current day high - time period 09:00 - 10:00
Current day low - time period 09:00 - 10:00https://fxdreema.com/shared/o8EzkqM5d
Is it possible that fxdreema has an error here? only four lines are drawn and some of them are not correct...
-
@jjot I guess the ones that are not charted are those of previous day opening and close. Right? Choose open and close daily option instead oh highest/lowest prices within blocks 7 and 8.