Is there a way to identify the candle that the high or low happened on in the past 10 candles
-
and to use that as a variable for a candle ID? meanwhile for each subsequent new candle, take that status as being a new id'd candle, for example, on one minute chart at 12:00 the high may occur at candle 10, but at 12:01 its identified as occurring at candle 11?
How can that be done? I see there is ways to designate a range to find that high, but not a way to reverse that. Possible?
As always, whoever would kindly respond, I appreciate your input!!!
")
-
You need to use average volume with candle 11
-
Volume? Volume won't identify candle ID.
A better question is , how can I find that RSI value on that candle? How can I identify that candle? The only option I know of, that has the option of drawing (or getting) a high, is on the market properties tab under "candle high" (over x amount of range of candles). It does not show how to get that candle ID, however under properties on that tab, an option is what to get, ... and candle ID is one of the options,...but I cannot get that either....
-
@len-1 Are you asking this same question in your other thread? If so, could you please focus one question per thread?
-
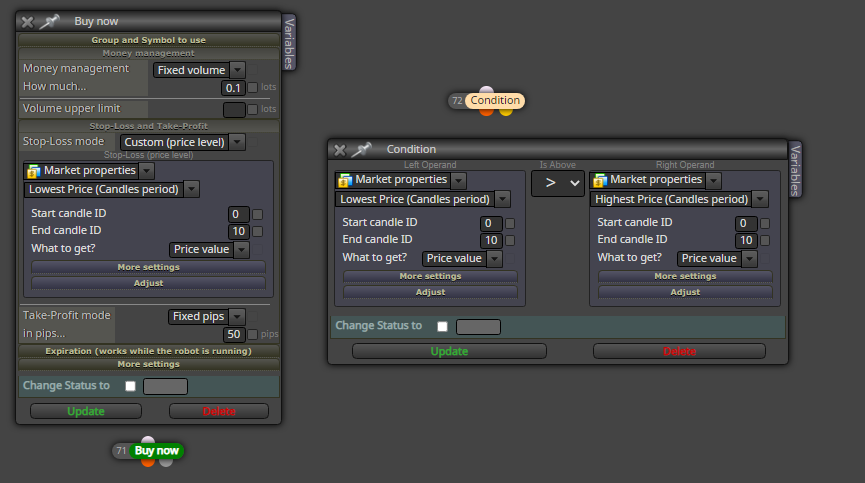
@len-1 Following you Title question (just the title question...) , yes its possible. I don't know why do you want it, but just open a condition or whatever that you want to work with it, select market properties > and choose the option that you wish