Draw Horizontal Line of value variable
-
Hello all,
I am trying to draw a horizontal line based on a variabe value that generated by previous formula (variable output is varRange4). But there is no drawn horizontal line yet.
Any suggestion?
Tank you very much
-
@zedeai2 So if I understand it correctly what you need is that the price value of a horzontal line is stored into a variable so that you can use it later as a number (ie, price level). Right?
-
@l-andorrà Hello,
the price value of a horzontal line is stored into a variable--> yes
so that you can use it later as a number (ie, price level)-->yes, so then I can show up this price level on the chartHow to do that?
Thank you @l-andorrà
-
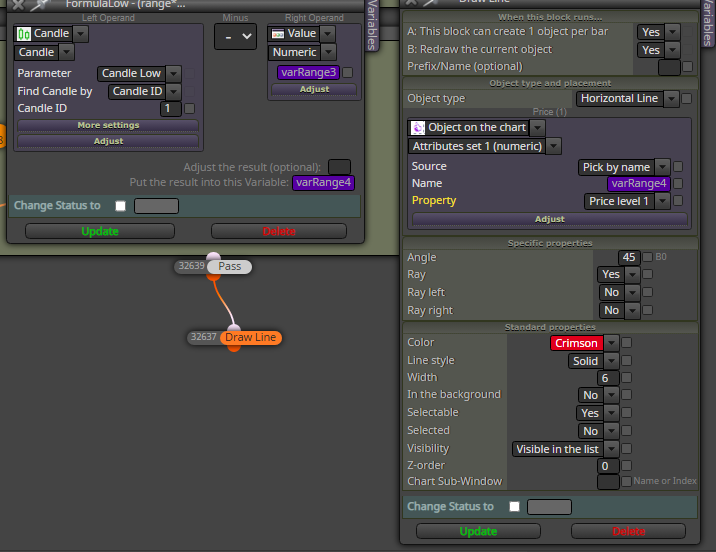
@zedeai2 In the Draw Line block, under Price(1) change the first pull down to value and the second to numeric then put your variable in the box for the value. This will draw a line at the value set by your variable. Note. your other settings will mean this line is redrawn every bar.
-
@cpbonzo Hello, I just tried. And it's working. Thank you
")
Another question : how to show the value of this horizontal line at around of this line?
Thank you very much!
-
@zedeai2 You could use the Draw Text box. This allows you to place the text, or number, anywhere on the chart using price and time. In the Time(1) section you could place the text at candle 1(or any other) and then locate it at the same height (price value) as the line by setting the Price (1) section as you did for the line and use the variable in the value box. Then use the variable again to replace the "sample text " in the text box and that should then show the value of the line i.e. the variable, at the location of the line.
-
@cpbonzo Hello,
Thank you for you reply. I will try it
By the way, do you have any sample?
Because I have no idea on this caseRegards