Draw lines at price Levels
-
Hello everybody,
I looked though the forum and google but did not find an answer which I got working. I want to draw lines at certain price level such as ???.500 and ???.000
I tried to use the round number block but I was not able to get that working as it uses ranges instead of exact levels and then I tried to create a custom mql code block by reading the price, rounding it to the first digit after the comma, splitting it by "." and get the first array... but I failed as I am not used to mql coding...
Has someone an idea how I can achieve that? Is there a simple way?
This is what I have tried ... I don't know how to share that:
Now here is the link:
https://fxdreema.com/shared/uhJF7mSodThank you and have a nice day!
btw. this tool is fantastic!!!
Markus Maria
-
@mmbinvest hello,
So how many lines did you want and what are they relative to?
I mean is it only the .000 and .500 above and below the line? Or is it every .000 and .500 on the chart? -
Hello,
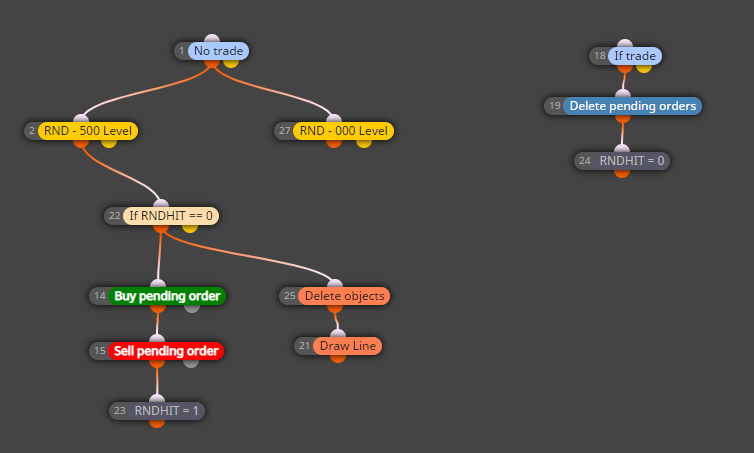
when the current price (bid/ask) crosses a .000 or .500 level, I want it to draw one line at this very moment. In addition it should place a pending order and do other things later on, but I struggle already with the line. Only one line at .000 or .500 to highlight once price crosses such a level. I set a variable/flag that it does not continue to draw lines as it crosses over and over again ...
-
@mmbinvest Just a note, for me to get notified with your reply, you will need to tag me @q8carpenter
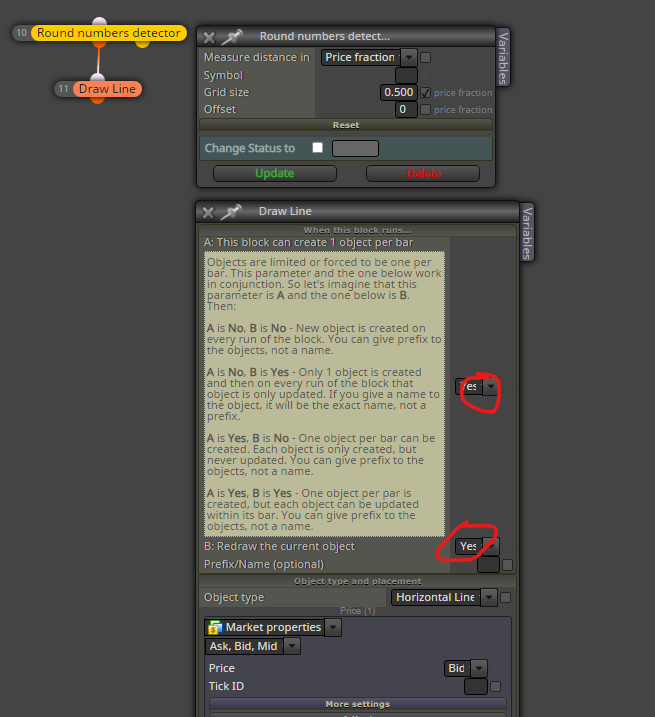
As for your idea, let me show you a simple way that i would do the drawing part without the rest of your strategy and you can go from there.
As you can see in the screenshot, if you chose YES and YES, then the line will be drawn as soon as you pass .000 or .500 , but if you chose NO and YES, then the same line will be redrawn keeping only one line on the chart.
Now that on my image I have visually backtested tested and it works. As I don't know what exactly you want for the rest of your strategy, I can not say what you should do but if this doesn't work for you, then there must be a problem with another block in your chain where it is not passing.
-
@q8carpenter thank you for your input and advise to mention you ...
That got it working ....