Market aggression meter.
-
Hello friends, I know that some will say that there is already an indicator but in reality what I see is that most indicators are not delivering true data.
So I wanted to create my own calculation for this but I would like your idea.
I would like to perform a tick count and separate this amount for sellers and buyers.
Can someone help me?So let's use an example of investigating Candle (0-current)
1st part.
If the opening of the candle happened at the price 1000 and the bid price oscillated down by 1 point or 999, this (1) tick is a seller.
But if it fluctuated above 1001 then this (1) tick is a buy.
Any tips on how I can create this condition and separate it into variables?2nd part.
After part 1, we can then continue adding this information for every new candle id 0 that appears and we will then be able to identify who is acting more strongly (buyers or sellers).3rd part. Perhaps the most difficult.
Identify if in candle 0 there was some kind of very fast price variation, either for buying or selling.
If we are on the 1 minute timeframe, then let's say that as a rule most candlesticks have about 1000 ticks being (500 buyers and 500 sellers) but there happened to be 5000 ticks (4000 buyers and 1000 sellers) this could then be considered an aggression by buyers on the current candlestick.Sou do Brasil e utilizo o sistema Fxdreema a alguns anos, sempre que tenho tempo disponível eu tento ajudar alguém por aqui, mas se quiser uma ajuda mais próxima me contacte:
Site: https://www.ontradingx.com.br
Youtube: https://www.youtube.com/@ontradingx
Boa sorte a todos nós!English - I'm from Brazil and I've been using the Fxdreema system for a few years, whenever I have time available I try to help someone here, but if you want more help, contact me:
Website: https://www.ontradingx.com.br
Youtube: https://www.youtube.com/@ontradingx
Good luck to all of us! -
@ontradingx This will count buy and sell ticks per candle, hope it helps.
Learn fxDreema Without the Wait!
My comprehensive book, available on Amazon, is packed with examples and invaluable insights to help you fast-track your learning journey.
The paperback and hardback editions include MT4 & MT5 QR codes for easy access to all prebuilt projects and robots, including my latest gold trading robot!
Don’t miss out
Click here➡️ https://mybook.to/fxDreema to get your copy today!
Enjoy! 😊
-
@jstap Thanks for your help.
Can you help me a little more?
I notice that he is resetting the values with each new candle.
Would it be possible that he didn't reset?
I wanted to add the total values in real time.Sou do Brasil e utilizo o sistema Fxdreema a alguns anos, sempre que tenho tempo disponível eu tento ajudar alguém por aqui, mas se quiser uma ajuda mais próxima me contacte:
Site: https://www.ontradingx.com.br
Youtube: https://www.youtube.com/@ontradingx
Boa sorte a todos nós!English - I'm from Brazil and I've been using the Fxdreema system for a few years, whenever I have time available I try to help someone here, but if you want more help, contact me:
Website: https://www.ontradingx.com.br
Youtube: https://www.youtube.com/@ontradingx
Good luck to all of us! -
@ontradingx Yes this is your choice, if you want it to permanently count create a diffront variable or 2 then use other blocks to calculate as you want, if you generate other variables to hold values then every time it resets put6 into 5,5 into 4, 4 into 3 Etc until all values are held.
Learn fxDreema Without the Wait!
My comprehensive book, available on Amazon, is packed with examples and invaluable insights to help you fast-track your learning journey.
The paperback and hardback editions include MT4 & MT5 QR codes for easy access to all prebuilt projects and robots, including my latest gold trading robot!
Don’t miss out
Click here➡️ https://mybook.to/fxDreema to get your copy today!
Enjoy! 😊
-
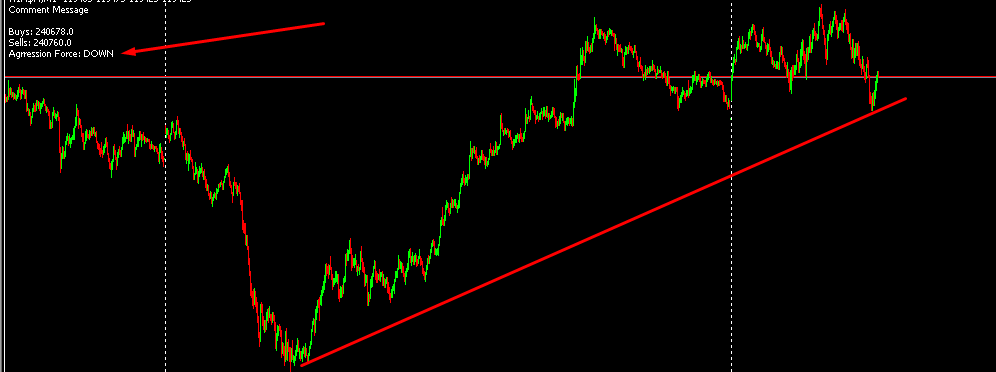
I'm not understanding why it just gets Down.
Can you help me?
It is as if the counter is only favoring the ticks down, but notice that the market has gone up.
https://fxdreema.com/shared/y6tBFsV9eSou do Brasil e utilizo o sistema Fxdreema a alguns anos, sempre que tenho tempo disponível eu tento ajudar alguém por aqui, mas se quiser uma ajuda mais próxima me contacte:
Site: https://www.ontradingx.com.br
Youtube: https://www.youtube.com/@ontradingx
Boa sorte a todos nós!English - I'm from Brazil and I've been using the Fxdreema system for a few years, whenever I have time available I try to help someone here, but if you want more help, contact me:
Website: https://www.ontradingx.com.br
Youtube: https://www.youtube.com/@ontradingx
Good luck to all of us! -
@jstap
In my understanding it is:
If I have more buy ticks it means the market is going up
If I have more sell ticks it means the market is going down.So if we have a day when the market goes up, my variable will indicate UP
If we have a day when the market went down, my variable will indicate DOWNDo you understand it this way too?
Sou do Brasil e utilizo o sistema Fxdreema a alguns anos, sempre que tenho tempo disponível eu tento ajudar alguém por aqui, mas se quiser uma ajuda mais próxima me contacte:
Site: https://www.ontradingx.com.br
Youtube: https://www.youtube.com/@ontradingx
Boa sorte a todos nós!English - I'm from Brazil and I've been using the Fxdreema system for a few years, whenever I have time available I try to help someone here, but if you want more help, contact me:
Website: https://www.ontradingx.com.br
Youtube: https://www.youtube.com/@ontradingx
Good luck to all of us! -
@ontradingx I think your logic is correct but in your picture you have more sell ticks than buy, so probably working as expected.
Learn fxDreema Without the Wait!
My comprehensive book, available on Amazon, is packed with examples and invaluable insights to help you fast-track your learning journey.
The paperback and hardback editions include MT4 & MT5 QR codes for easy access to all prebuilt projects and robots, including my latest gold trading robot!
Don’t miss out
Click here➡️ https://mybook.to/fxDreema to get your copy today!
Enjoy! 😊
-
@jstap I believe then that the number of ticks is not so important to define a trend even if this trend is short.
Sou do Brasil e utilizo o sistema Fxdreema a alguns anos, sempre que tenho tempo disponível eu tento ajudar alguém por aqui, mas se quiser uma ajuda mais próxima me contacte:
Site: https://www.ontradingx.com.br
Youtube: https://www.youtube.com/@ontradingx
Boa sorte a todos nós!English - I'm from Brazil and I've been using the Fxdreema system for a few years, whenever I have time available I try to help someone here, but if you want more help, contact me:
Website: https://www.ontradingx.com.br
Youtube: https://www.youtube.com/@ontradingx
Good luck to all of us! -
@ontradingx Maybe, the number of ticks don't necessarily equate to candle movement.