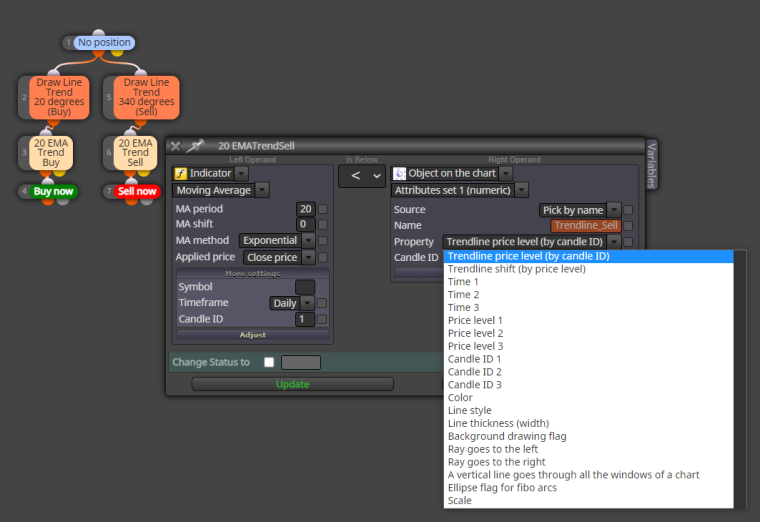
Trendline by angle - Trendline price level (by candle ID)
-
Greetings
I have a problem, and I hope someone can solve it for me.
The following link is not a complete EA yet. It's just to illustrate the problem.
https://fxdreema.com/shared/3XE2WJamc
- When the MA is above the 20° trendline, we should buy.
- When the MA is below the 340° trendline, we should sell.
- When the MA is between the two trendlines, no trades should be made.
Currently, the EA is kind of ignoring both trendlines, and it only seems to recognise the point where the lines begin as both "trendlines". So, it does NOT stop trading when the MA is between the trendlines, which defeats the purpose of even having trendlines.
I found a thread where someone else had the same kind of problem, but the solution was unclear. It just said to "change" a setting in "block 5" to "No" (block 5 in their project; not mine).
Unfortunately, several settings in that block could've been changed to "No."
I hope someone can figure this out for me.
Thanks.
Chris
-
@chris-6 Have never done it but you are using price level which is a fixed point, there are other ways that don't use a fixed point, not sure how though.
-
@jstap , thank you for the response. I've tried many of the options already. If you scroll down on that dropdown menu, you'll see a plethora of methods to pick from.
I'm obviously aware that the method I have currently selected doesn't work. That's the reason I'm asking for help. So, if you can help me beyond identifying the problem, I would be very grateful. In other words, I already know that the method I picked doesn't work. I was hoping you or anyone else could figure out what might work.
Thank you in advance.
-
@chris-6 , I'm replying to myself in order to help others who might run into the same problems with objects drawn using the angle function.
The angles of objects on a chart are fixed, while the chart itself is dynamic. So, when you draw an object using an angle, the angle will remain the same even if you change the vertical scale of the chart.
For this reason, an object drawn using the angle function can probably not be used in an EA.
Anyway, that is the only reason I can think of why it doesn't work.
Price on a chart is scalable, but an object on a chart drawn using "angle" is not. This means you can basically shrink the vertical scale on a chart until you only see a flat line. However, the angled object on the chart will not change in any way.
Anyone can correct me if I'm wrong or if you've found a way to do it.
There probably is a way to do it, using the vertical scale of MetaTrader.
MetaTrader basically automatically changes the vertical scale to fit into a computer screen. So, you'd basically have to change the visible chart into some kind of temporary constant, but I'm not a programmer and I have no idea how to do it... although I still really want to do it to see how it will work.
The reason is that most traders use the charts to make decisions, which means that even though the vertical axis of the chart is scalable, most traders see their charts as a constant when they study charts. What they see obviously affects the market. It seems like 20 degree angles are significant on visible charts when something is moving sideways when you look at the 20 period EMA. When the 20 EMA is below 20 degrees, we tend to move sideways for extended periods of time.
Obviously, when you pull the vertical scale all the way down, you'll just see a flat line. But I doubt that traders ever do that. They scale it to fit their screens.
So, basically human behaviour again.
Cheers, guys.
-
@chris-6 To calculate a slope, I calculate pips, by subtracting prices. For example for an MA I subtract MA candleID 1 from MA candleID (20... for MA 20). If >0 then it means slope is positive, if <0 slope is negative. You can also add conditions ... if variable nr. > than some nr. Calculating the slope is chart independent, as it is calculated in pips.
-
@cpxiom , this is what I've always done. However, as I pointed out, such a slope can't be expressed in degrees since the vertical axis is scalable. So, a trendline by angle is more or less unusable in an EA.
I wanted it to be usable.
A degree by angle will always be a subjective reference unless somebody can find a way to make the vertical scale as we see it on a computer screen a constant. The distance between pips changes based on time and the size of your computer screen. So, the ergonomics of the workspace of a trader affects the way he interprets different trading instruments and analyses a chart.
We use angles. However, objectively there are no angles. Charts only give the appearance that we can measure things in angles. So yes, pips are the only constant we have to work with, which is an incomplete measurement since, visually, it represents a market differently depending on the scaling of the vertical axis we're looking at.
I was hoping to find a way to exploit what traders see when they look at charts.
-
@chris-6 yes, it's not easy to find a way to represent what you see to an EA. A robot does what it does, without discernment. Finding ways to feed context to it... is one of the biggest part of the work, as market conditions change. That's why I would say it's a very good thing to find something that is a constant in the market environment. It is like something we can hold on to, and elaborate on that, as it is something certain. That's why I use Renko for example, where I don't have the surprise of a candle 10 times bigger than the average, and mess with the MA or make it meaningless for example. I know what you say... I work as a graphic designer, illustrator, so I see the market like a drawing :).