How to keep horizontal lines for the last 50 candles?
-
How can I draw horizontal lines on the highs of the last 50 candles?
-
This is a initial Project.
https://fxdreema.com/shared/Trg60KbP
I have the impression that he is drawing the lines, but he is not leaving them fixed.
Ideally, for each new candle, the EA draws the 50 lines at the top of each candle and keeps them updated for each new 50 candles. -
Do you mean drawing the previous 50 candles, then waiting for the next 50 candles doing nothing and finally deleting the initial ones and drawing the last ones again?
(English) I will try to help everyone in these fxDreema forums. But if you want to learn how to use the platform in depth or more quickly, I can help you with my introductory fxDreema course in English at https://www.theandorraninvestor.eu.
(Català) Miraré d’ajudar tothom en aquests fòrums d’fxDreema. Tanmateix, si vols aprendre a fer servir la plataforma amb més profunditat o més de pressa, t’hi puc ajudar amb el meu curs d’introducció a fxDeema en català a https://www.theandorraninvestor.eu/ca.
(Español) Intentaré ayudar a todo el mundo en estos foros de fxDreema. Sin embargo, si quieres aprender a usar la plataforma en profundidad o más deprisa, te puedo ayudar con mi curso de introducción a fxDreema en español en https://www.theandorraninvestor.eu/es.
-
@l-andorrà
imagine the following:
I'm on Candle 0 (current) and it's part of the 50 candles.
I want to put a horizontal line on the price of its high in real time and the high of the past 49 candles.
When this candle closes, I want the process to pass to another candle as this next candle becomes the current (0) candle again.
And so consequently the horizontal lines are always being redrawn over the new candles.
I believe I've seen someone drawing numbers on top of candles, but I've never seen anyone draw horizontal lines on a sequence of previous candles. -
My logic that I tried was the following:
Every tick (but could be every candle)
Execute 50x the variable block that will only add the value of the variable +1, this would generate from 1 to 50 in the variable that is linked to the candle ID of the "Draw Line" block.
As the Draw Line block is being repeated 50x with the Loop variable, then it would draw a horizontal line on top of each candle from candle 0 to candle 50.
But none of this is happening. -
So if I understand it correctly, you need this to happen every time a new candle is open:
- Look to back to the previous 49 candles.
- Find the high and the low prices for that 49 candles.
- Delete the previous plotted horizontal lines.
- Draw new lines on those new high and low.
And repeat again and again. Is that what you need?
-
Exactly that.
You explained in a few words what I want to do. -
-
@Byens
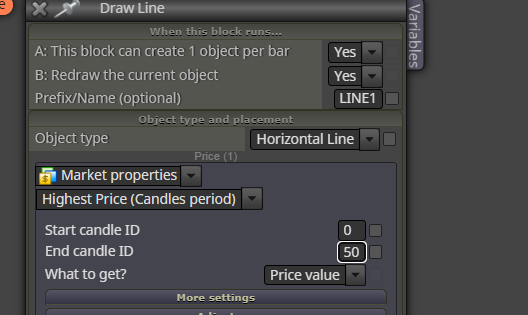
Thank you for your attention, but this only draws 1 line at the maximum price found in the period of 50 candles, I want 1 line for each of the 50 candlesSou do Brasil e utilizo o sistema Fxdreema a alguns anos, sempre que tenho tempo disponível eu tento ajudar alguém por aqui, mas se quiser uma ajuda mais próxima me contacte:
Site: https://www.ontradingx.com.br
Youtube: https://www.youtube.com/@ontradingx
Boa sorte a todos nós!English - I'm from Brazil and I've been using the Fxdreema system for a few years, whenever I have time available I try to help someone here, but if you want more help, contact me:
Website: https://www.ontradingx.com.br
Youtube: https://www.youtube.com/@ontradingx
Good luck to all of us! -
@OntradingX That's just an example. You need to duplicate that for lows too. That is the way to do it.
(English) I will try to help everyone in these fxDreema forums. But if you want to learn how to use the platform in depth or more quickly, I can help you with my introductory fxDreema course in English at https://www.theandorraninvestor.eu.
(Català) Miraré d’ajudar tothom en aquests fòrums d’fxDreema. Tanmateix, si vols aprendre a fer servir la plataforma amb més profunditat o més de pressa, t’hi puc ajudar amb el meu curs d’introducció a fxDeema en català a https://www.theandorraninvestor.eu/ca.
(Español) Intentaré ayudar a todo el mundo en estos foros de fxDreema. Sin embargo, si quieres aprender a usar la plataforma en profundidad o más deprisa, te puedo ayudar con mi curso de introducción a fxDreema en español en https://www.theandorraninvestor.eu/es.
-
I need only for high price.
Have one example? -
@l-andorrà I need only for high price.
Have one example? -
If you need highs only then you can use the recommended configuration above.