draw line at the next open price (stock)
-
Hello everyone
When I look at the price of a stock chart its have some times a huge difference between closing price form yesterday and the opening price of today.
Does anyone know how to draw a line base on the picture below.
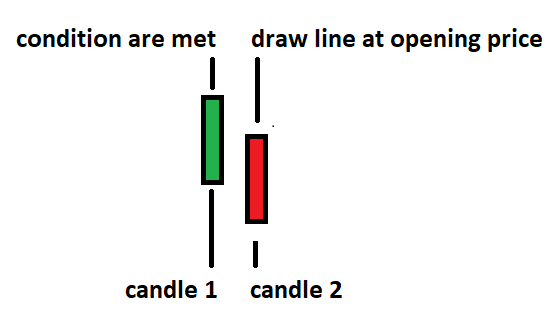
-
Why do you need a line when you can store that value on a variable? Are you trading manually maybe? That why not doing it manually?
-
@l-andorrà I like to make a analyses. If the gap between candle ID 1 (close) and candle ID 0 (opening) is equal or more then 2%. there will put a arrow on the opening price in ID 0
-
Then horizontal lines are not necessary, you just need the calculation for the arrow, right? When you say 2%, you mean a 2% in price level, correct?