Drawing variables on the graph
-
Hi;
I have 1 line custom indicator in fx dreema and with formula blocks I multiply the value of indicator with (1+0.005) and other formula block (1-0.005) also put them in 2 variables..
How can I see the 2 lines on the graphics in metatrader5?I try the drawline block, but this doesnt work doesnt draw the changing variables(two lines)..Pls help me
thx.. -
Add a shared link
-
Hello thank you.Exactly for ex I work to do this:
MOV15*(1-0.005)
How can I see this on chart ?.I tried but I can not do that pls help..
thx.. -
Add a shared link so what you have done can be looked at.
-
@jstap
okey thank you so much.I am working to do this with different blocks and tried but no conclusion.This is the last try.Link below..
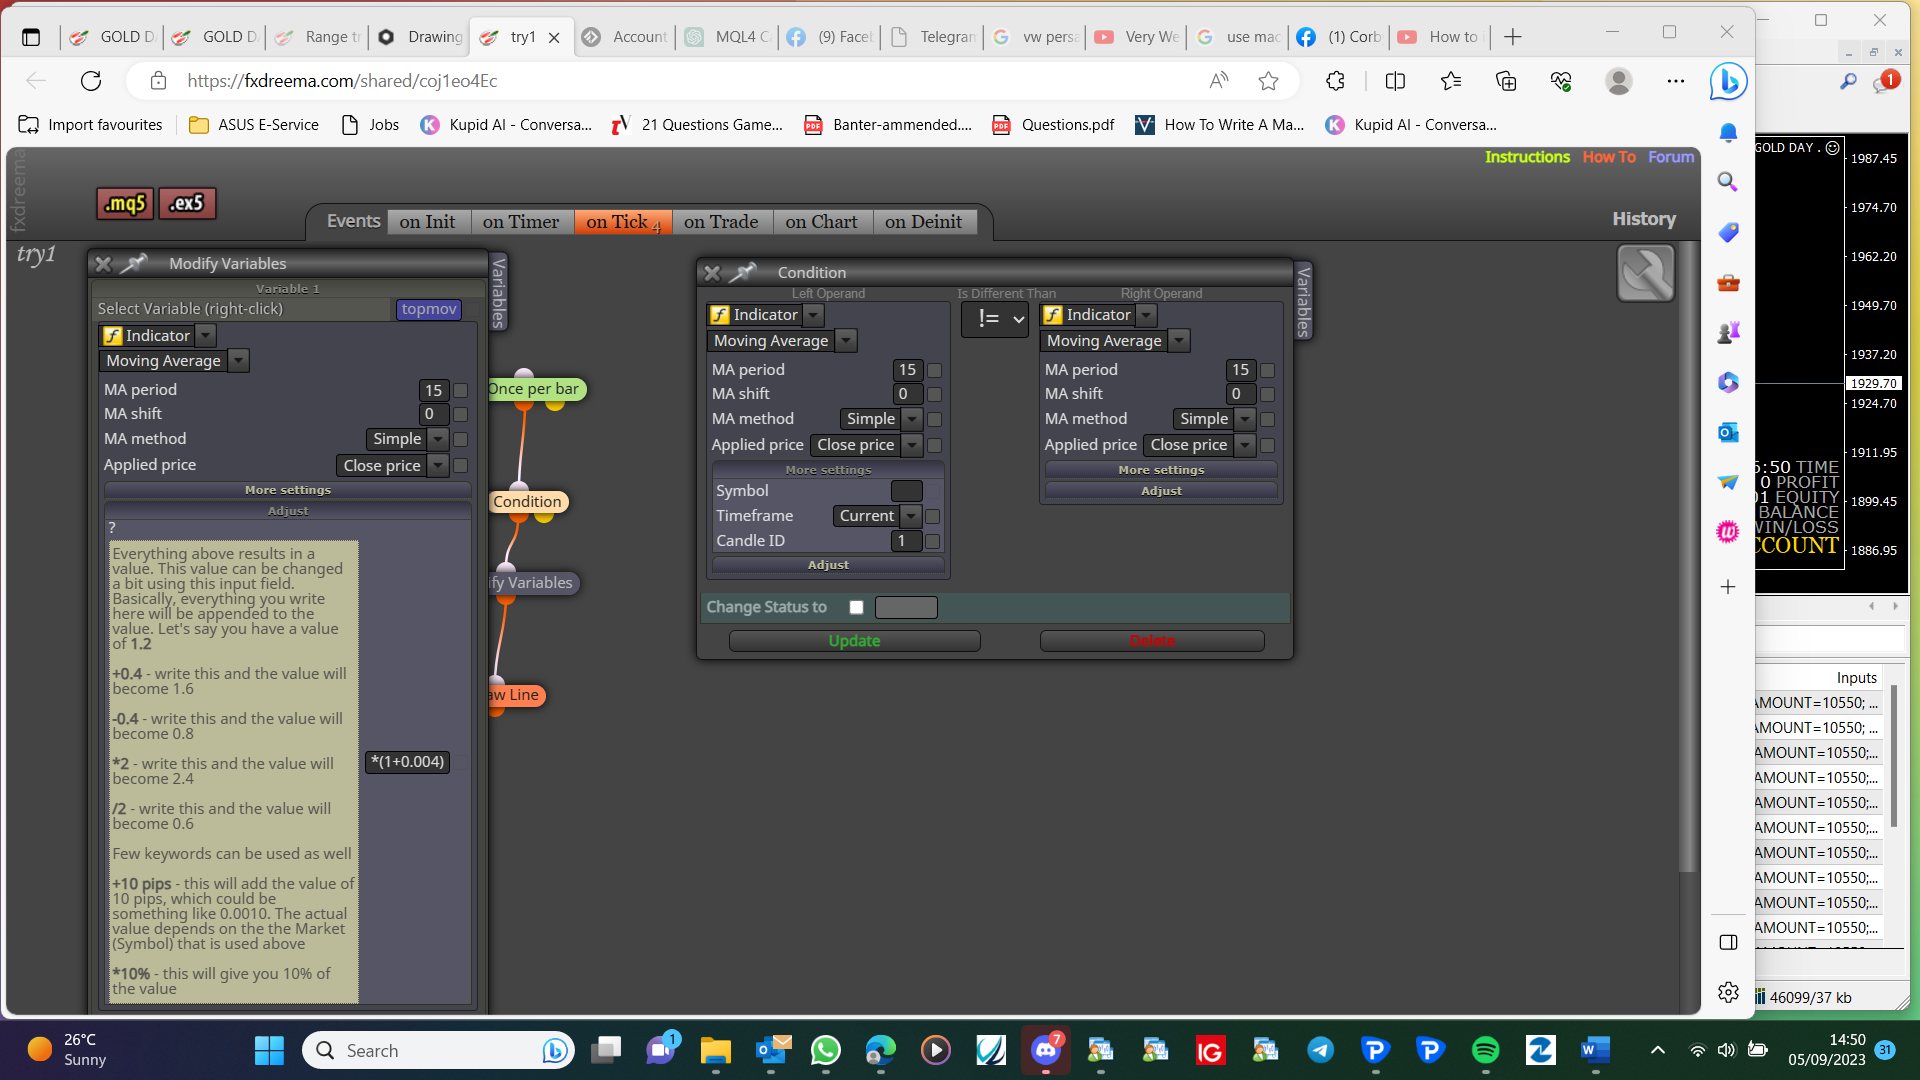
https://fxdreema.com/shared/coj1eo4Ec -
@adentist MA on 0 will almost always be different, close on 0 is current price. as you can see in the picture, this value will be approximately 1% of the value.
-
@jstap
i understand this .Its important for me that I want to multiply any number with any indicator ex:MOV15 and see on the chart .I am working to learn this.Numbers are not important which blocks needed and workflow?So i will expand it if I learn the logic..
can you give an example for me so i will learn this?
thx -
Put this into a comment so you can see what happens, I would multiply and save into a variable.
-
@jstap
hi;
sorry but I dont understand which is the example talk about? -
Can you create a variable?
-
@jstap
Yes I did and i put it in the comment I see the value while backtest.Changing but how can I see the line on the chart? -
The line can be drawn from the variable.
-
how ?
") can you help and give an example pls ?
can you help and give an example pls ? -
I can but is literally, pass block-draw line block, redrawing, but not once per bar.