I need some help. Busted. Keep trying
-
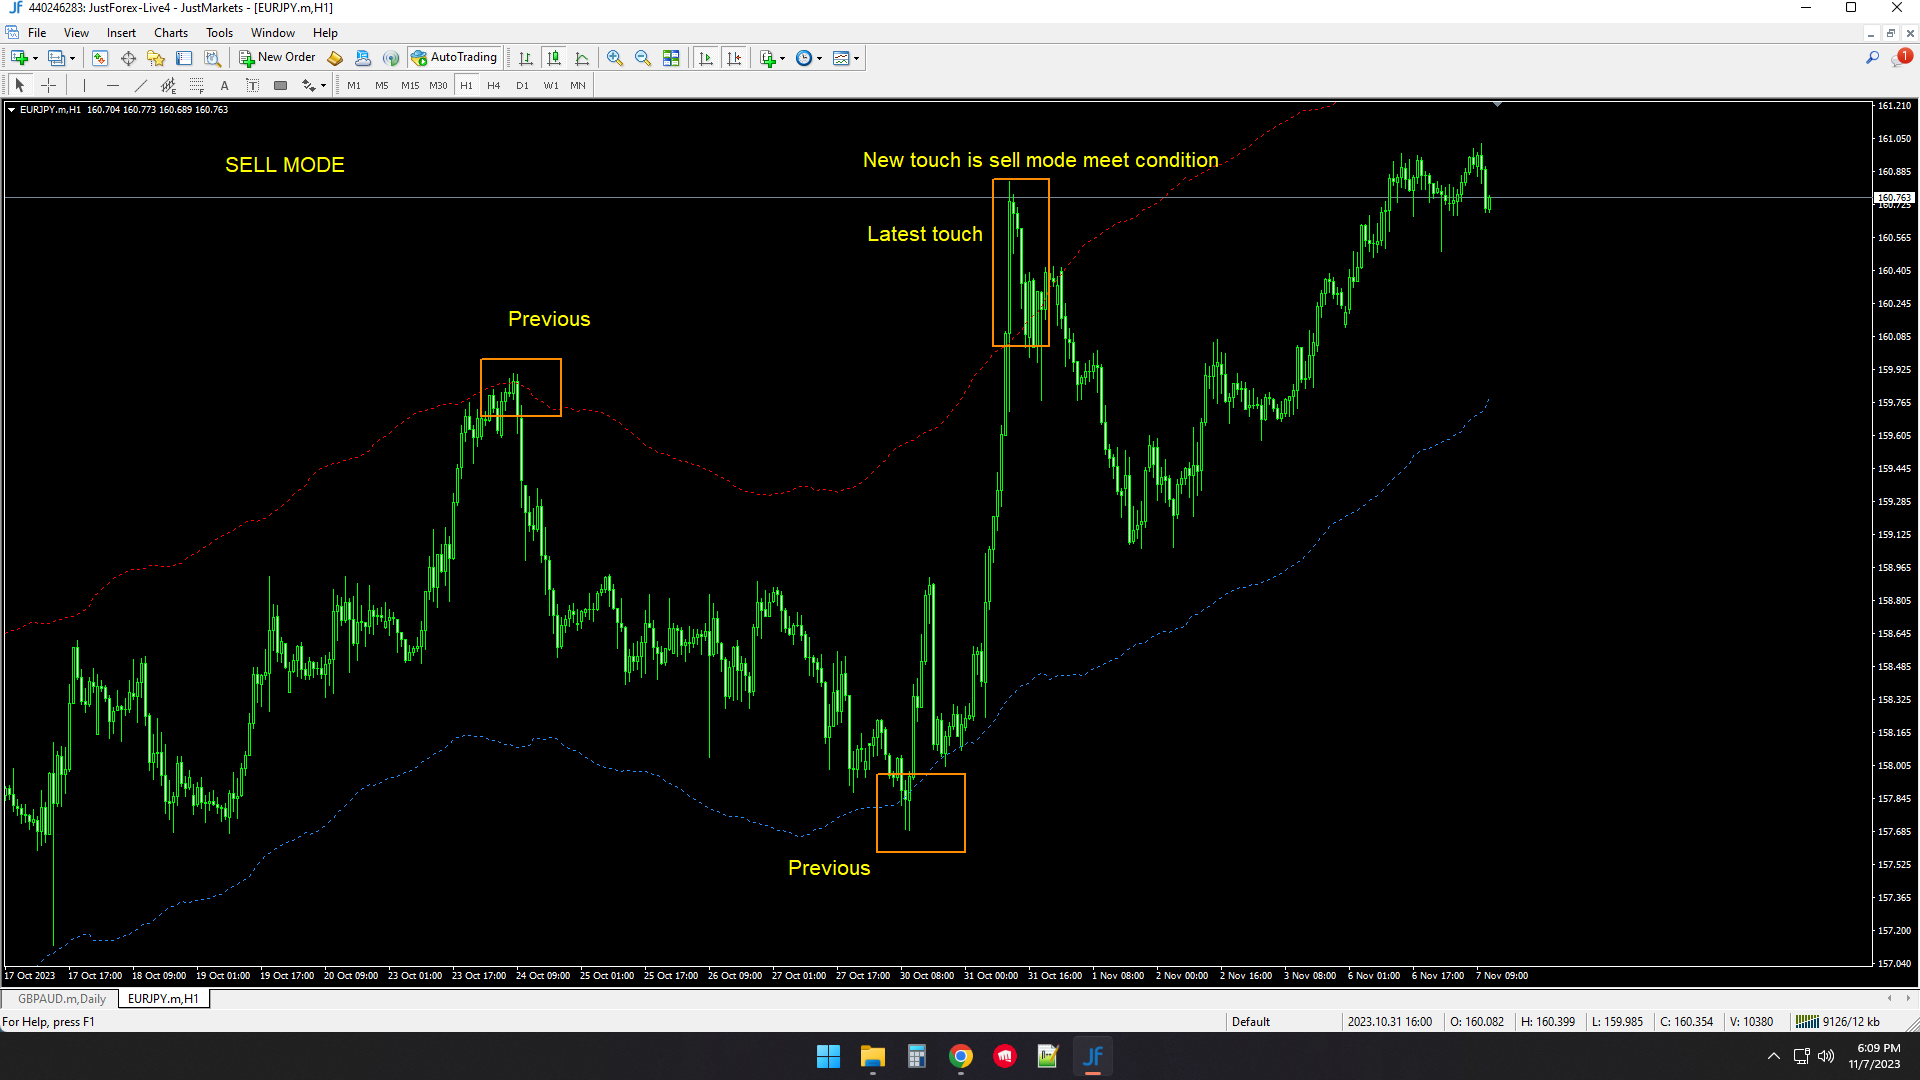
i want text display on chart. if price touch red line mean text SELL MODE, if price touch blue line mean text BUY mode. I want that text keep displayed on chart till meet next condition for BUY MODE/SELL MODE
i want any last price touch any line with condition i mentioned
This is my project link https://fxdreema.com/shared/DWqpfKoQd
Sorry if my english so bad.
-
You need to move all block to the 'on tick' tab.
-
@l-andorrà thanks, i want make any last price touch line. i need do candle id range?
-
What do you exactly mean by 'last price'?
-
@l-andorrà i dont know to explain but i give this hope u understand
-
The problem is identifying those points. Are they supposed to be indentified at at the exact moment the happen or some time later?
-
current moment happen. current time
-
Not sure I fully get it then. Do you need a maxmum distance in candles between the last touch and the previous one, maybe?
-
just need latest one
-
@wmyfx98 Then you can do something like this:
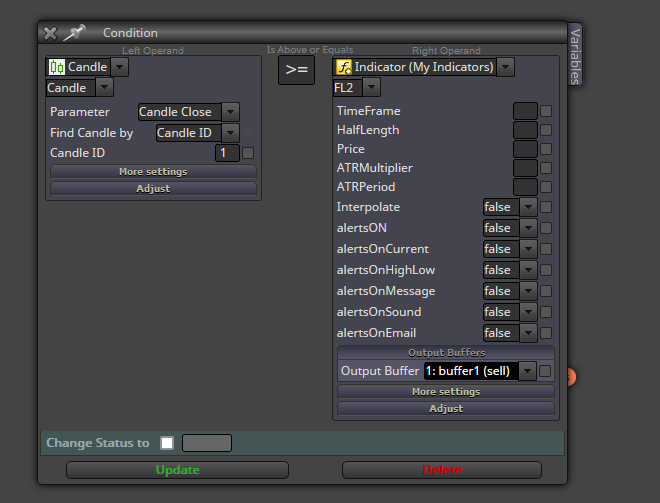
That will plot a lot of objects so you should use a 'once per bar' block on top of it to avoid that.