Level 61.8 move average ?
-
Hello my friends, I am trying to create the following rule:
When the previous closing candle is above the 61.8 level of fibonnaci of the 20-period moving average.
Which of these blocks are correct?
My question is whether I have to use the + or - signs and the word "pips"when it is negative it would be for example -61.8 or -61.8 pips?
when it is positive, would it be for example +61.8 or +61.8 pips or only 61.8? -
@ontrade Can you please share your project?
-
@l-andorrà my project about this have one block condition, i not have a complete project.
-
@l-andorrà https://fxdreema.com/shared/xcGBrPbMd
What is correct to insert constant to values on move average:
Simple
ExponentialHave one example?
-
@ontrade This is the easiest example:
https://fxdreema.com/shared/vq3BfAvwc
This mini EA draws a fibo from candle ID 20 to candle ID 1. Then teh second tree block is comparinf if candle ID 1's close is above 61.8% of that fibo. Please notice that ever new candle the fibo will change because new values for candles 1 and 20 are available.
-
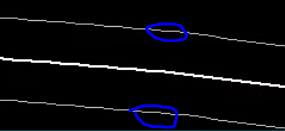
What I want is to create a condition where, for example, as the image shows.
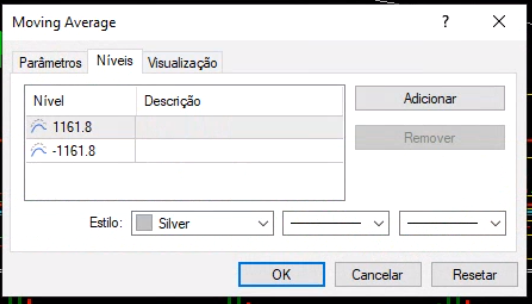
In the metatrader I put a moving average of 200 simple periods
In the settings of the moving average I want to set the levels 1161.8 positive and -1161.8 negative
It generated a line above and one below the 200 moving average.The condition I want to know how to create is:
Buy when the previous candle crosses above the 1161.8 line
Sell when the previous candle crosses below the line -1161.8how is the correct way to create this condition?
-
@ontrade Err...and what about the fibonacci suggestion? Was it what you were looking for?
On your question about those levels, just use the 'Envelopes' indicator to get those limits without having to add any new one.
-
@l-andorrà About Fibonnacci ...
explaining better, imagine that the average of 200 simple periods is at the price of 1000, but the price as ask or bid is higher around 1100 or 100 points above, I need to know where it is at the level of 61.8 above this average and below it .about envelopes can you give me an example of how to do this?
-
@ontrade Do the following:
- Plot your 200 SMA on chart.
- No plot the envelopes indicator exactly as 200 SMA. Then select different deviation values until you find those distances above and below the 200 SMA. Once found, use both upper and lower bands as your new levels for price to cross.