How to draw a block automatically on the chart?
-
Hello,
Does anyone know how to draw a box automatically on the chart using an EA?
The box should be drawn automatically once it's triggered by a block functionThank you
-
@zedeai2 There are several options. Will this box be static or dynamic? Should it be visualized forever or for a specici period of time?
-
@l-andorrà Hello, Thank you very much for your reply :). I have been waiting for your reply
")
I wanna have the box with this condition :
1 static box : it's only plotted at certain hours, let' say based on previous candles : 1st and 4th previous candles (it's trigerred by a block condition)2 Once it's visualized on the chart, it's seen able forever. And anytime new condition meet the block condition so there will be new box
So what I mean the block condition is : the box is plotted if the block condition is meet
Thank You
-
@zedeai2 Hello! "Draw shape" block, but i never used it.

-
@ambrogio Hello, thank you for your info. I had tried it but it's not working. I don't know yet how to create a block condition to trigger this shape block on the chart
Any idea?
-
@zedeai2 So you mean that you wantthe rectangle to be plotted covering all candles from 13:00 to 16:00 in a H1. Right? And what about the upper/lower limits? Which ones would you need?
-
@l-andorrà Hello,
Let me give a block condition example here : https://fxdreema.com/shared/YtEFdx6Jc
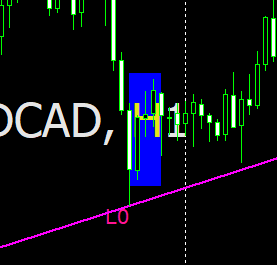
So once this block is happening, then the shape will be automatically plotted on the Time Frame H1 (The shape area are between candle 1st to 4th, and the limit max and minimum shape are based on the highest and lowest candle at that shape area)
Thank you
-
@zedeai2 Ok. I see you can create the rectangle. The problem is holding that same rectangle on those same candles as time passes by. Correct?
-
@l-andorrà Yes. But is this block correct? because I don't see any plotted rectangle yet
-
@zedeai2 Just change 'close' price in the two first options by 'high' and by 'low' in the other two. Then try again.
-
@l-andorrà Hello, thank you and I will try it and will come back with feedback
-
@l-andorrà Hello, it's working now. Thank you very much!
Any way, now I would like to create an fibbonacci that plotted to chart automatically . And it's also triggered by the same blocksAny suggestion on how to make it ?
Thank you
-
@zedeai2 That is a trickier thing to do. Did you try the 'Draw fibonacci' block? It is not so different from that of 'Draw shape'.
-
@l-andorrà Okay I wil try it :). So basically, all plotted object will not be so different with the draw shape, right?
-
@zedeai2 Yes, if you look at their setting, most of them are common. You are usualy required to selecy an 'initial' and a 'final' positions for the object to be drawn. Try it and if you don't make it, let us know.
-
@l-andorrà Hello, okay thank you very much! I will come back for any feedback