How to draw Trend Line between two points
-
Two questions if anyone could help me out at them :
-
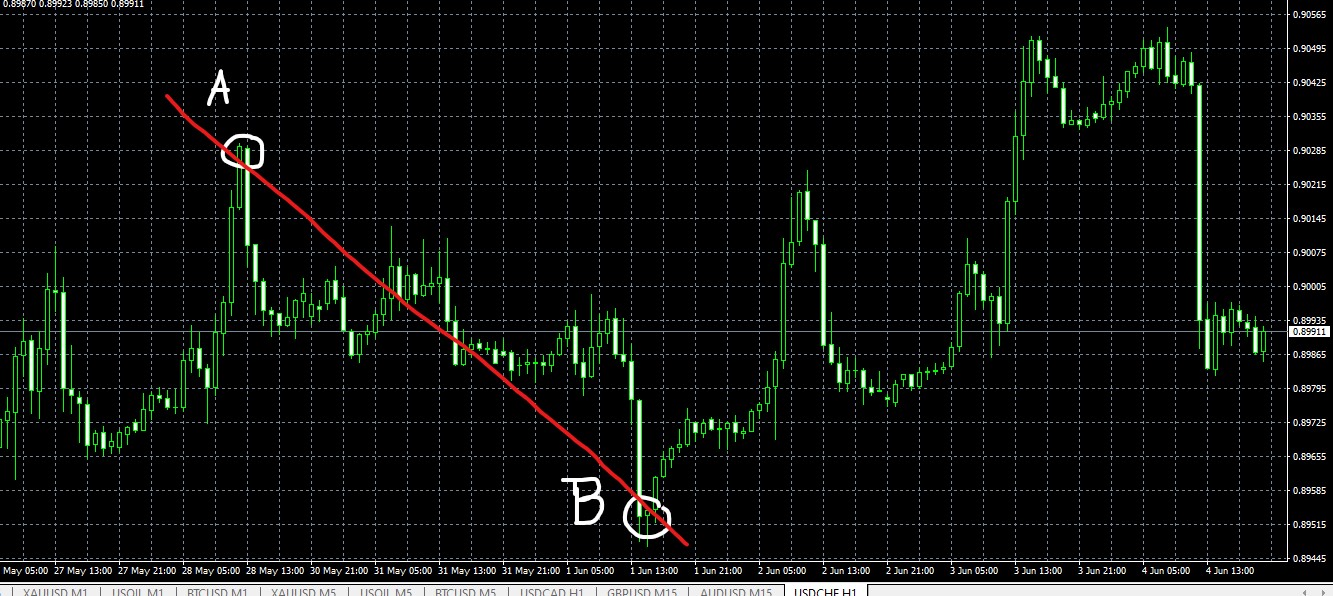
lets say i have two conditions ( A & B ) ... when both conditions created (as per attached picture ) .. i want to draw a trend line exactly at where they formed
-
if market price cross over or below the formed trend line at ( 1 ) .. how to open a trade based on that ?
thanks in Advance
-
-
 )
) -
Could anyone bypass and help please .. thanks
-
@saeed-2 Let's begin with the most important infor here. How are those A and B points calculated? Are they provided manually or via custom indicator? Do you know how to draw trendlines?
-
Thanks for replying
Strategy is first searching for condition to meet at ( POINT B ) condition still in progress improvement >>> when condition at POINT B is occured, i want EA to search backward X candle ( lets say last 50 candles ) and searching for highest market price between them and that will be POINT A
i want to draw trendline between these points
if market price cross over the trendline ( +3pips ) >> i want to open a buy trade
i explored many toturials and examples but still i dont know how
-
@saeed-2 Hello,
I worked with the assumption that you want the High of point A with the low of point B. After that, if the BID Crosses that line downwards, a BUY trade opened. I have attached a screenshot based on that which will be a great starting point. you can alter any part and candle IDs to suit what you exactly need.
Hope this helps

-
@q8carpenter thanks for useful visualize description
Point B will have a condition ( lets say MA cross over ) .. when condition met at this point then it will be assigned as a Point B and then at same time need to check last 50 candle highest price ( as described at your SCreenshot )
regarding Market property Bid price >> Tick ID suppose to be zero ( 0 ) correct ? or empty as shown
thanks again man for your support