frequency distribution
-
i'm trying to grab some values and print them on my chart. https://fxdreema.com/shared/qX60HhBJd (candle high minus candle open) (candle close minus candle low) along w a few other things.
basically, it's just these 2 formulas with the amount of bars it takes into calculation being customizable, and it should print how often candles in these amount of bars move a certain amount of pips over 100 bars or so(>=10pips, >=20 pips, >= 30 pips etc in 10 pip increments up to 100+). i literally have no clue how to do it though, any ideas?
-
@000111 This is how to put the constant change on screen:
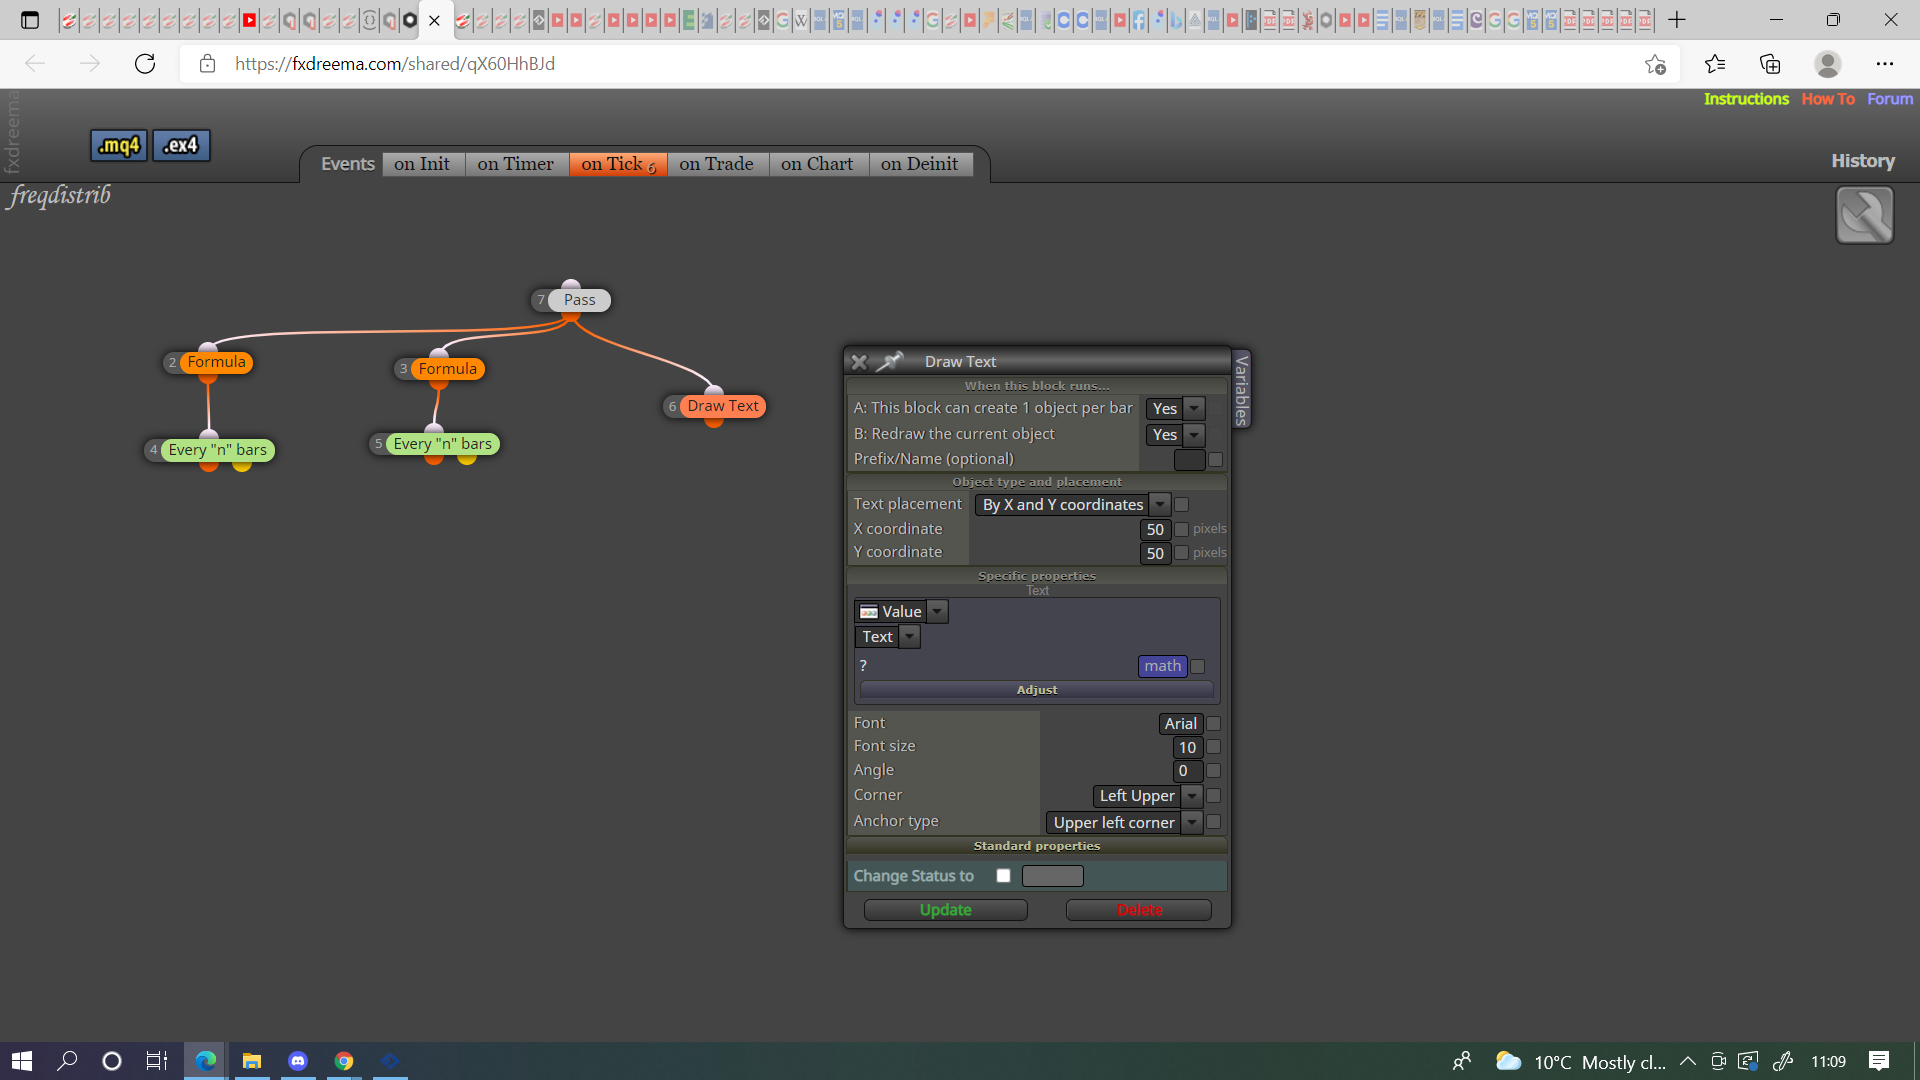
If you record the market properties price when you want to start checking, then every x pips from this point you can record what's happened.
-
@jstap awesome, thanks for your help.
does anyone have a clue on how to make the formula do the math the previous 100 bars, instead of just the previous one? i also have no clue how to make it print in percentage values how many times price goes past certain pip increments
-
@000111 You need a custom loop to do that. Probably a custom indicator doing it would be easier to get instead.

