Pivot point on a RSI input (NEED HELP)
-
Hi so ill get right into it,
Im wanting to create an EA that plots pivot point like areas on a RSI.
So like a support/demand level, Only on the RSI not the chart.
I also want the High/Low prior to going overbought/sold on the RsiThese levels i need to be determined of the RSI's data not the charts price.
So if RSI goes below 30 - The last support on the RSI line before it went overbought - draw line or just at least get to the point where it acknowledges that level.
Im having trouble with this as i cant think of how to plot these levels using the RSI data and not the charts price levels.
Any help would be SOOOO welcome
-
Sorry, to correct my question
So if RSI goes below 30 - The last RESISTANCE on the RSI line before it went overbought - draw line or just at least get to the point where it acknowledges that level.
same for above 70 (draw last support)_
-
@hello123starb
Not sure to exactly understand what you want.
Do yo want to draw a support line on the RSI every time it goes below 30, and vice-versa ? A showing pic would be good.
You can draw a line on the RSI :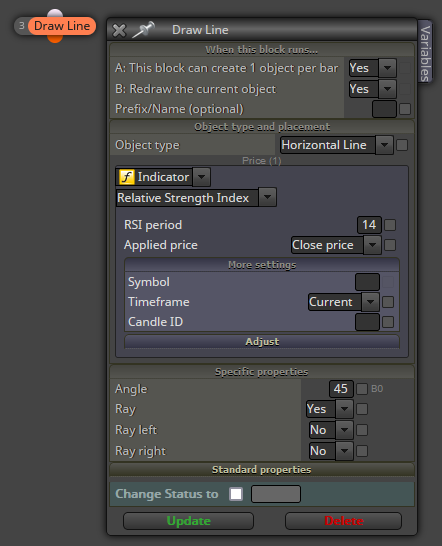
Also be aware that support-resistance strategies; based on indicators or price; coupled with "confluences" or not, are not reliable.