Range filter for Heiken Ashi
-
Hi guys,
does somebody know a simple way or default indicator to filter tight consolidation, or consolidation phases in general for heiken ashi for EA?
Similar to ADX, ATR or Bollinger Bands.
Thank you in advance.
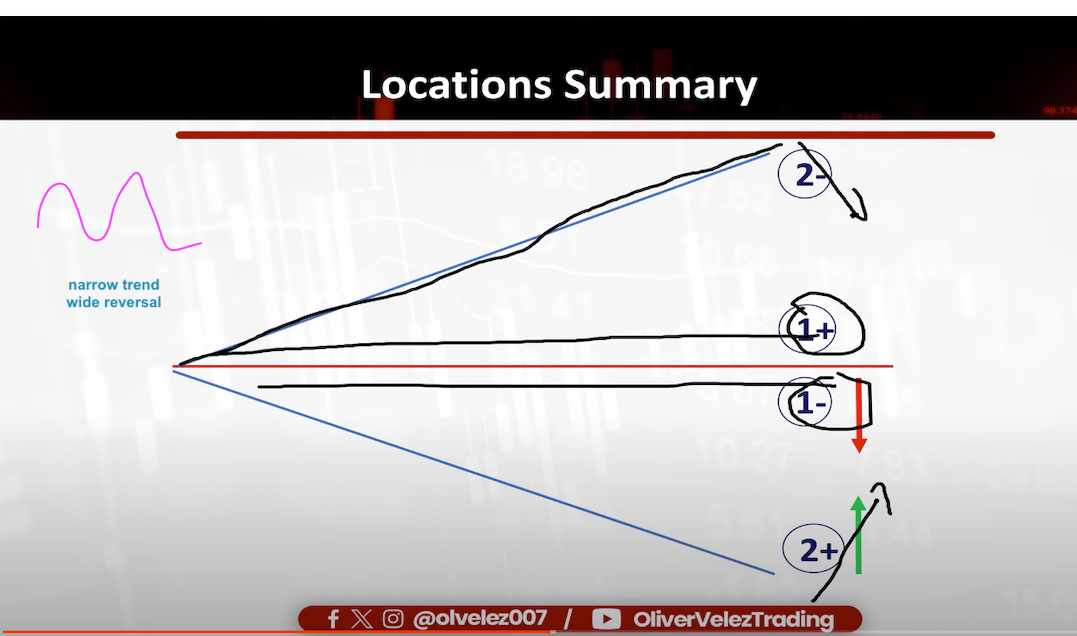
- Found from backtesting and knowledge from successful traders using trend systems like Moving Average, that there are mainly 2 phase a market can be in,
contraction or extension. So low Volatility and phases of increased Volatility.
Mainly that when market is tight near MA it tends to move away from Moving Average and when it is far away it then pulls back.
Often breakout appears from low/ narrow Moving Average state.
But found that Moving average often is very subjective, because market often fluctuates above and below, sort of like area.
-
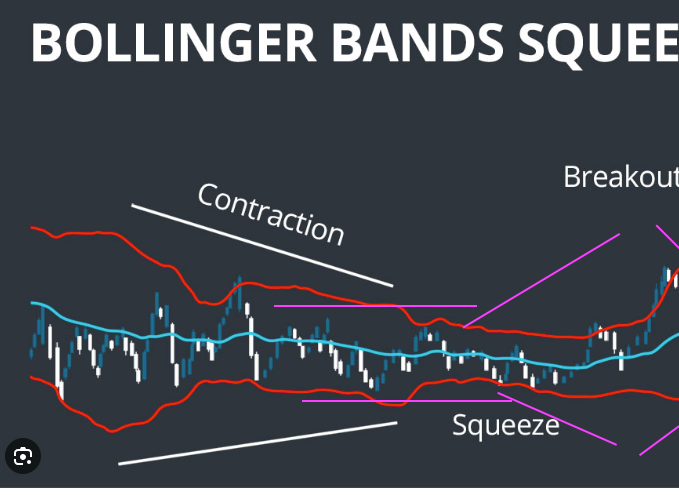
System flows like Bollinger Bands, when bands contract and expand.
Stop using them because gave me to many false signals when momentum continues. -
Also found that simply using flat bands and angled bands doesnt work that good, because often it lags due to market flattening or breakout.
-
Found that ADX would give to many and late entry with value system above 20 or 25.
-
ATR is good to determine Stop Level, but often when ATR is high, curve still tends to decreases as well afterwards even if Volatility keeps increasing.
-
Also doesnt want to use any form of "oversold overbought" indicator
even if only using the middle line/ 50 level,
like if it breaks above or below, because found from backtesting, that in consolidation phase, it flucates often, for 2 period or longer period like 14 for example.
-
@felix2828 You are asking for the Holy Grial, man!
 I wish I knew to to do that. I would be rich now. I'm afraid the most logic option is using several criteria that have been previously tested separately before combining them later. And that requires time.
 -
Lets get rich together mate

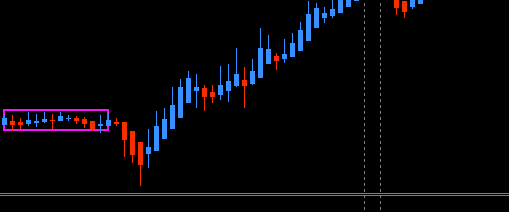
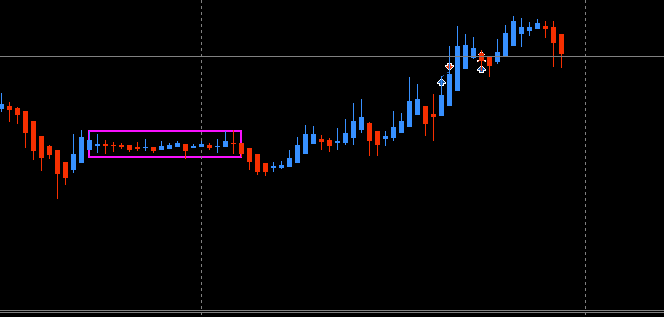
No doesnt have to be holy grail, but what i've found from talking with professional traders and institutionals, there is only 2 market cycles. Range- >trend.
Range often appears in lower volatility when instituionals are building positions or taking profit by decreasing position.
Did you Volume trading before as well.
It is when market is held by limit orders in range that they can build position by market orders. Orderflow. Like a collective process.Stopped using it, because shiftet away from futures trading to forex, because of algorithm trading.
From talking with pro traders, know that Di crossing from ADX is one of the best indicators to show that one side is taking over.
Bullish/ Bearish momentum.
Working pretty good.Unfortunately found that if market is tight, there is still some crossing.
But it gives way better indication that breakout might appear, because only larger players can move orderflow in their favor.Looking for an alternative like Aaron indicator that other like range bound indicators/ oversold/ overbought help detect range or trend strenght.
Found that all indicators with 50 level 80/20 level like stochastic, like 50 level crossing of lead to false signals in consolidation.
Did test it, even though al indicators lag a bit, which is ok due to to a certain point but was very lagging
But did like the idea of it thoug.