My EA update
-
Hi and thanks for viewing this thread. Here I will post a series of explanations and examples to what I've come up with after a year of focused work here on FxDreema. I will not uncover exactly what's going on under the hood. I'm just sharing my thought process and results. I'm curious to what other creators are coming up with and if it's paying off. Here's my Thread for what I came up with so far.
First and foremost I will explain my overall style. I built this system for swing/positional trading. It's not meant for everyday trading. I will say this. The signals are based on intraday strategies but I'm only interested when those strategies fail which will be presented. So what these EA's do is provide templates of high probability setups that offers substantial rewards with little risk in comparison. There's still needs to be discretion but these templates can aid in decision making.
-
I will simplify this the best I can. This strategy is an amalgamation of strategies that outputs templates. These templates represent when the time is coming to enter trades that are likely to reverse and run. The way these templates are generated is through backtesting and setting the dates to specified times. The dates vary depending on which template EA is backtested. When the backtesting is done, the template generated is then saved and updated to a live chart. From there the EA that was used to backtest is then inserted to update the chart. So now the EA runs on the live chart just as it did on the backtest.

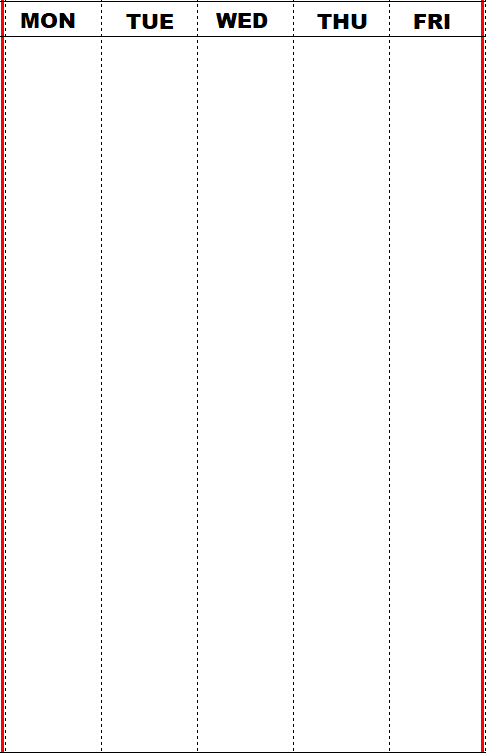
Here's the chart template. It's just a basic white background template with red vertical lines for the start of the week and the end of the week. This template is used in the rest of the templates. I'm not interested in just looking at weekly candles highs and lows. I'm interested in how 15 minute candles move in weekly candles in correlation with the templates. So there is still a larger timeframe analysis. Just not in the way most traders approach it.
-
Here is my favorite template. Template 1 which is referred to as the wall. Usually when price reaches this level, other favorable template conditions are met. This is an opportunity that happens at least once or twice a year for every pair. The opportunities are either shortly before the line or below to go long. I use this in conjunction with other templates that I will dive into later. There are other lines on the chart but this one is the only one I look out for. So I don't use this Template live. I run the backtest and get the price levels of the current and most recent black lines.
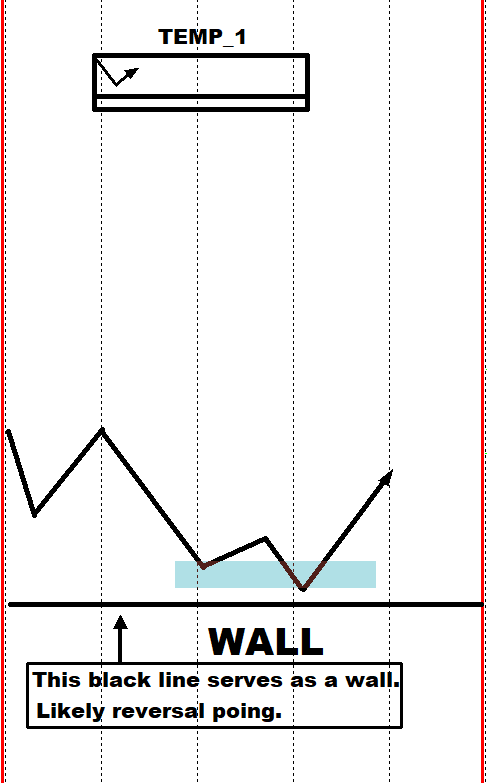
I will post examples of this. Ignore the typo in the graphic. I meant point. The reversal point isn't always an exact point. This is moreso a zone and price could go below. I anticipate the start of an upward trend when price gets into this zone.Vice Versa for selling short.
-
Sounds interesting. Please keep updating your results.
-
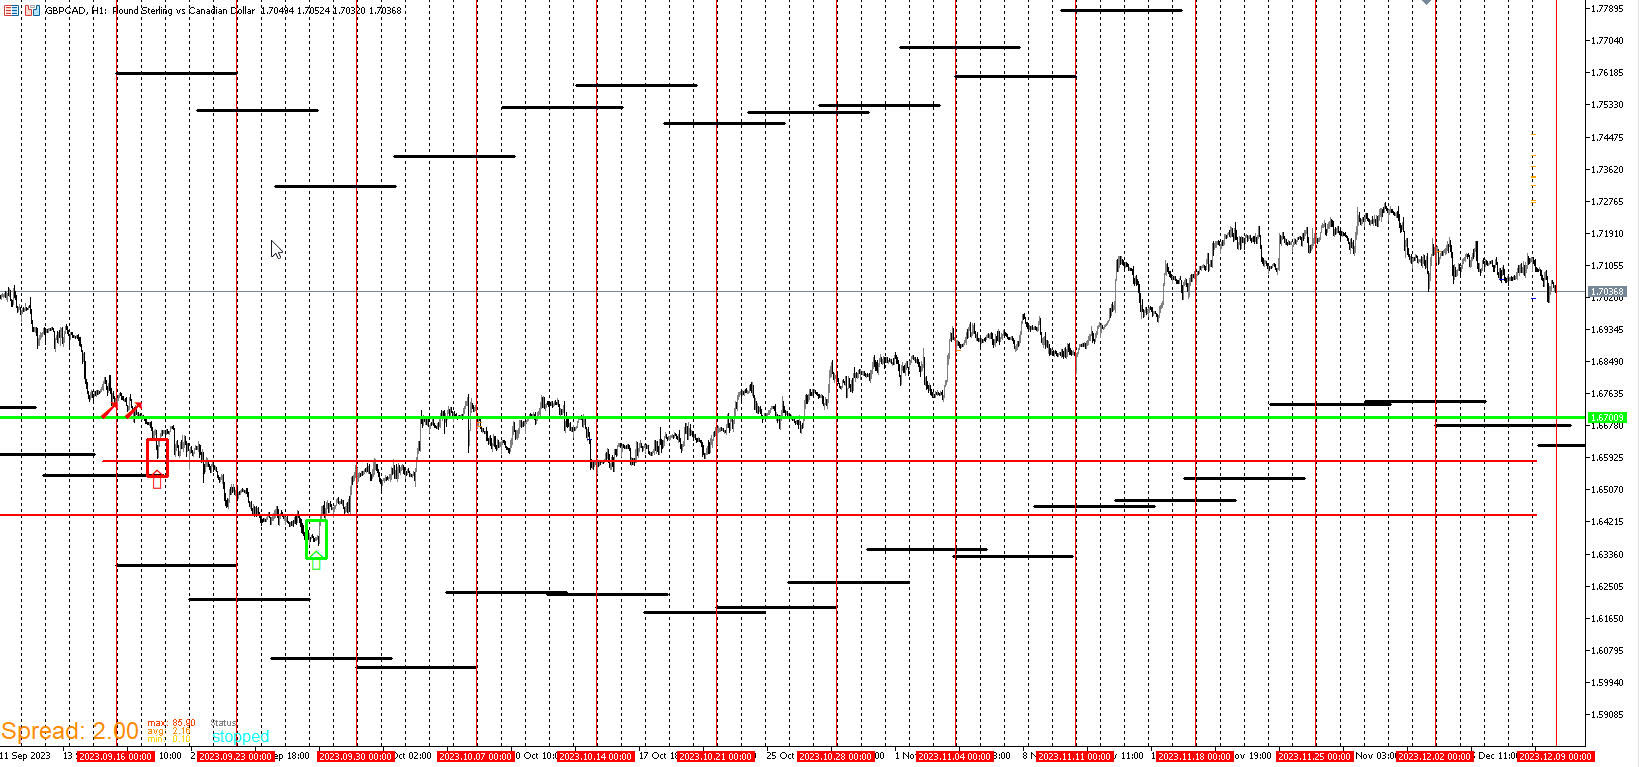
Here's my first example. It's the GBP/CAD pair this year. This is a video format of metatester. The black lines aren't based on market structure. My advisors as a whole don't look at market structure. So the black lines aren't monthly highs or anything. I have programmed a red box and arrow on the specific day and time to visually see the reversal Just for demonstration purposes. You will notice the second from the last one gets crushed through. I have 2 other templates that invalidated taking that position. When it went lower and pinched down to the lowest black line while my other templates confirmed a high likely reversal. That's when it was time to go long. This is an actual trade that I entered at the bottom with maybe 20 pips of drawdown at the most. It ran 800 plus pips from there. Unfortunately after about 150 pips in profit, My broker did a transition and closed out all my trades.Every trade I had open was a bottom catcher. I'll post it later because I recorded it at the time. I will add this. I don't buy at or near these lines blindly. If my other templates line up I'll buy whether it's near, on, or below. When I see price approaching these lines, it puts me on notice.
https://clipchamp.com/watch/kx0AUo0Qq8j
Here is the GBP/JPY PAIR for this year.
https://clipchamp.com/watch/ZKfODdbHFZX -
USD/CAD WALL EXAMPLE
https://vimeo.com/891656583?share=copyI will post more examples of the Wall template. I'm currently waiting on Vimeo to finish optimizing. Sorry for taking a while to update. My work schedule go busy here recently. To give a summary for the Wall Template, It's a template that gets my attention when price nears it and as I said, I use it in conjunction with other templates. Very rarely price violently crashes through but in the event when it does, it's a good sign. My algos are designed in a way that if they fail, it's time to enter. In short there will be opportunities to enter at or near the line but be prepared for price to grind down below. I have filters to avoid getting in too early.
Here's my second favorite template that can help with that. This template doesn't always have to come near template 1. When they do mesh up, it's better. This is Template #3.
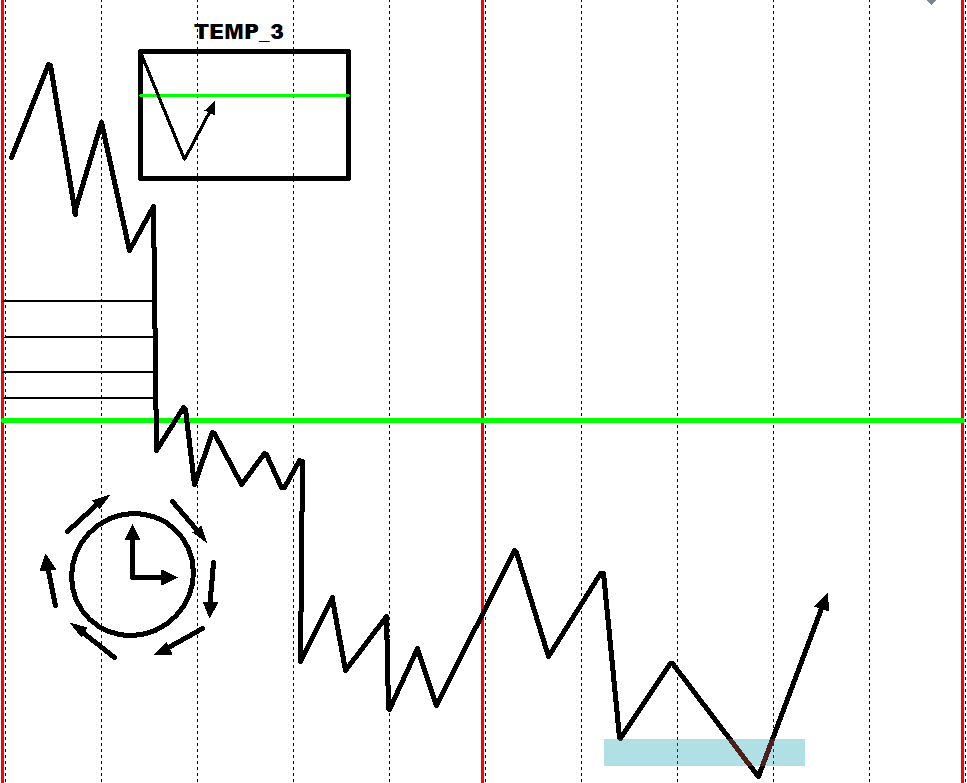
For this template, I only look to get in below the green line. How far below? I prefer some time to go by first . That could be 3 days or a week. Remember, I don't enter at the exact time price hit the level. I need to see some digging and accumulation before price reverse and like the Wall Template, I use this in conjunction with other templates to give me the best entry. There are blue levels above the green. When price comes down to them, they turn black. Price does push up from those levels, but I'm not interested in being part of that ride. I'm only interested below the green. In selling it's the same thing but reversed.
-
I am posting a live time example of the signal the my templates are currently generating. Here you will see my entry plan based on the Wall Template. There are other templates lining up but I've only gone in depth and provided examples of the Wall Template. I will go further into my other Templates as this start to make more sense. It will be confusing if I binge blast everything with no live example. I want to build up so that other Templates are understood before explaining others.
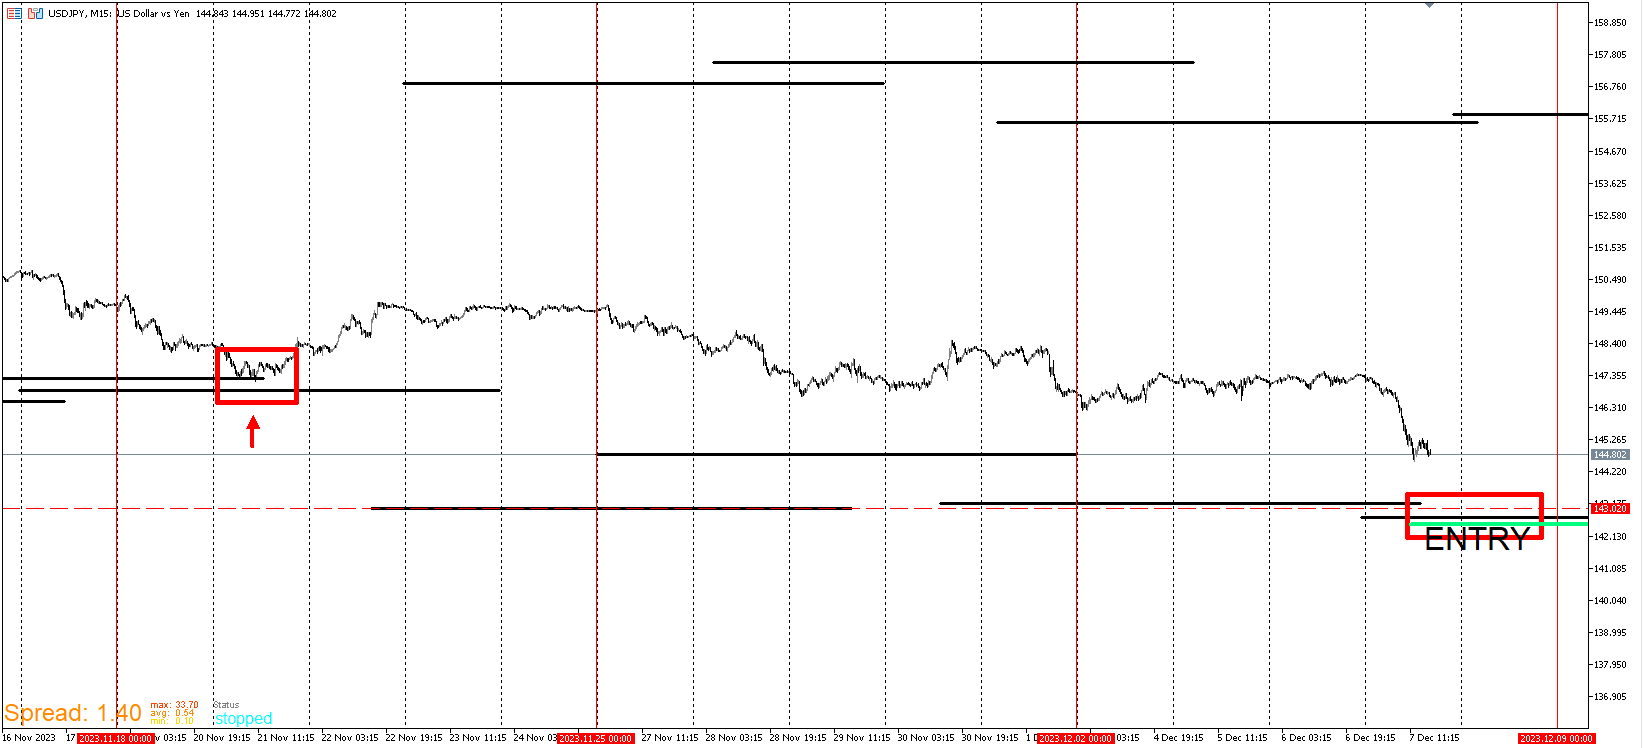
Keep these price levels in mind. Mark them on your chart.
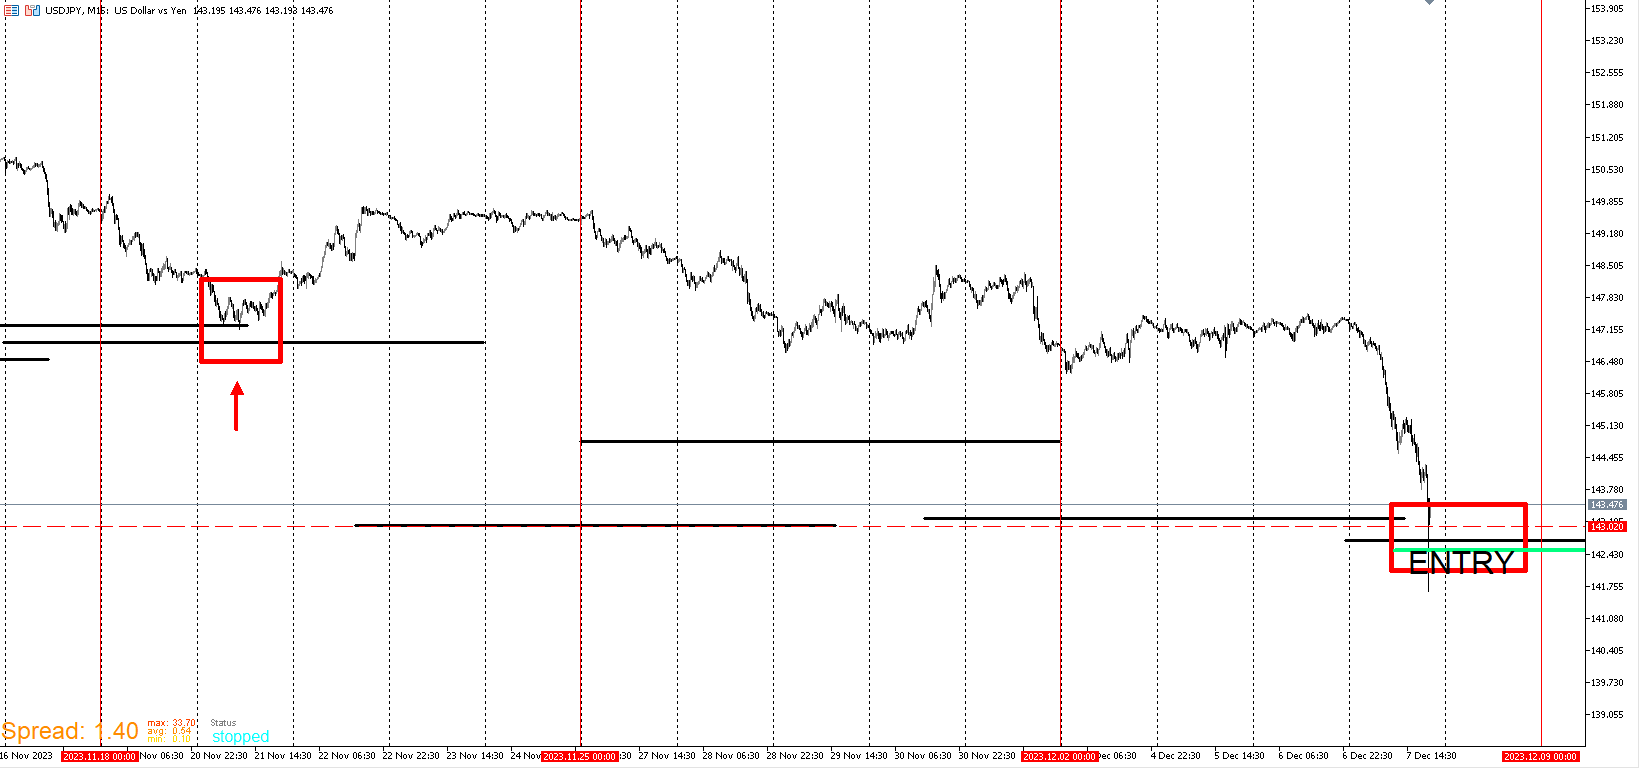
USD/JPY
143.188
142.719I'm long from these ranges and confident to hold for weeks. Please don't take this as advice for you to enter. This could be the rare case price continue to grind down. I am confident here because previously price hit a wall 12 days ago and price is now below it. That's the failure I'm looking for. This is purely for demonstration purposes.
-
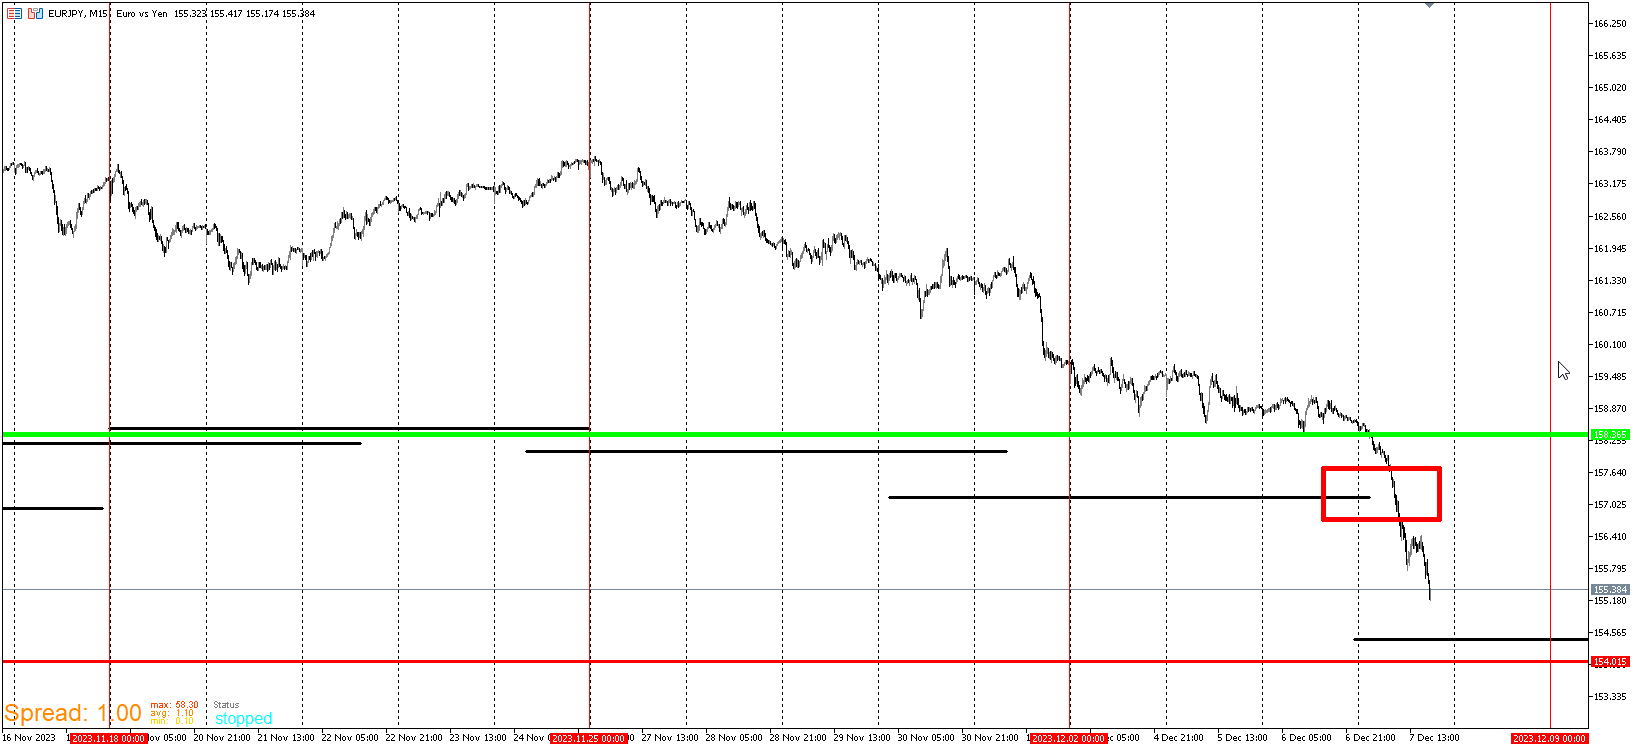
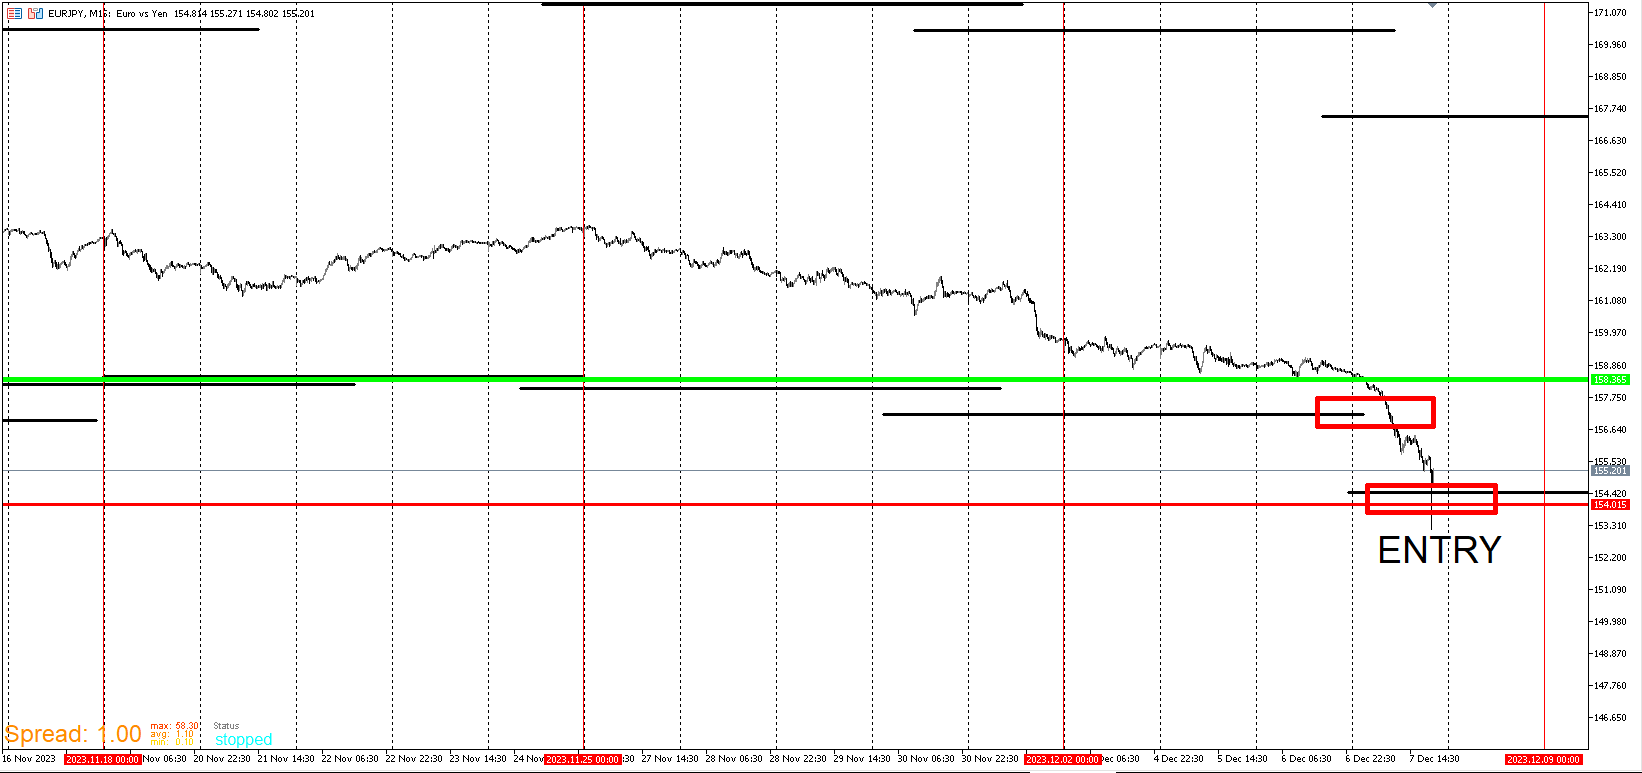
Here is EURJPY. I included Template 3 Buy interest zone. I forgot to include in USD/JPY. The green like there is the entry. Anywhere near or under the red is where I become more interested in entering. The Red line is a separate Template and I will explain it later. It's another major Template I pay attention to overall. Remember, I like to see some time go by under the green line. I prefer at least two days and a little digging for higher probability. Every uptrend that everyone want's to be part of early starts from underneath the green.
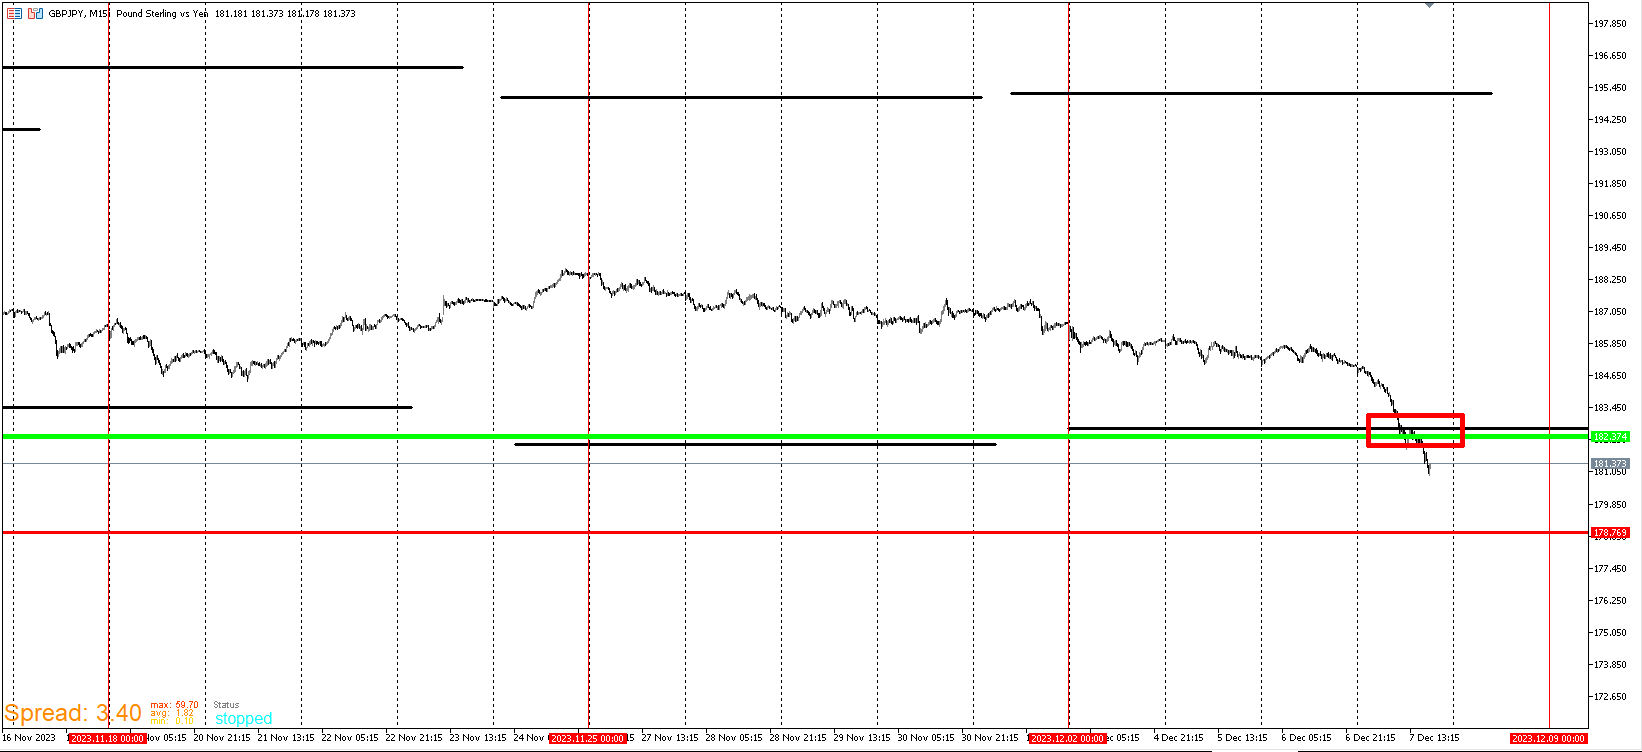
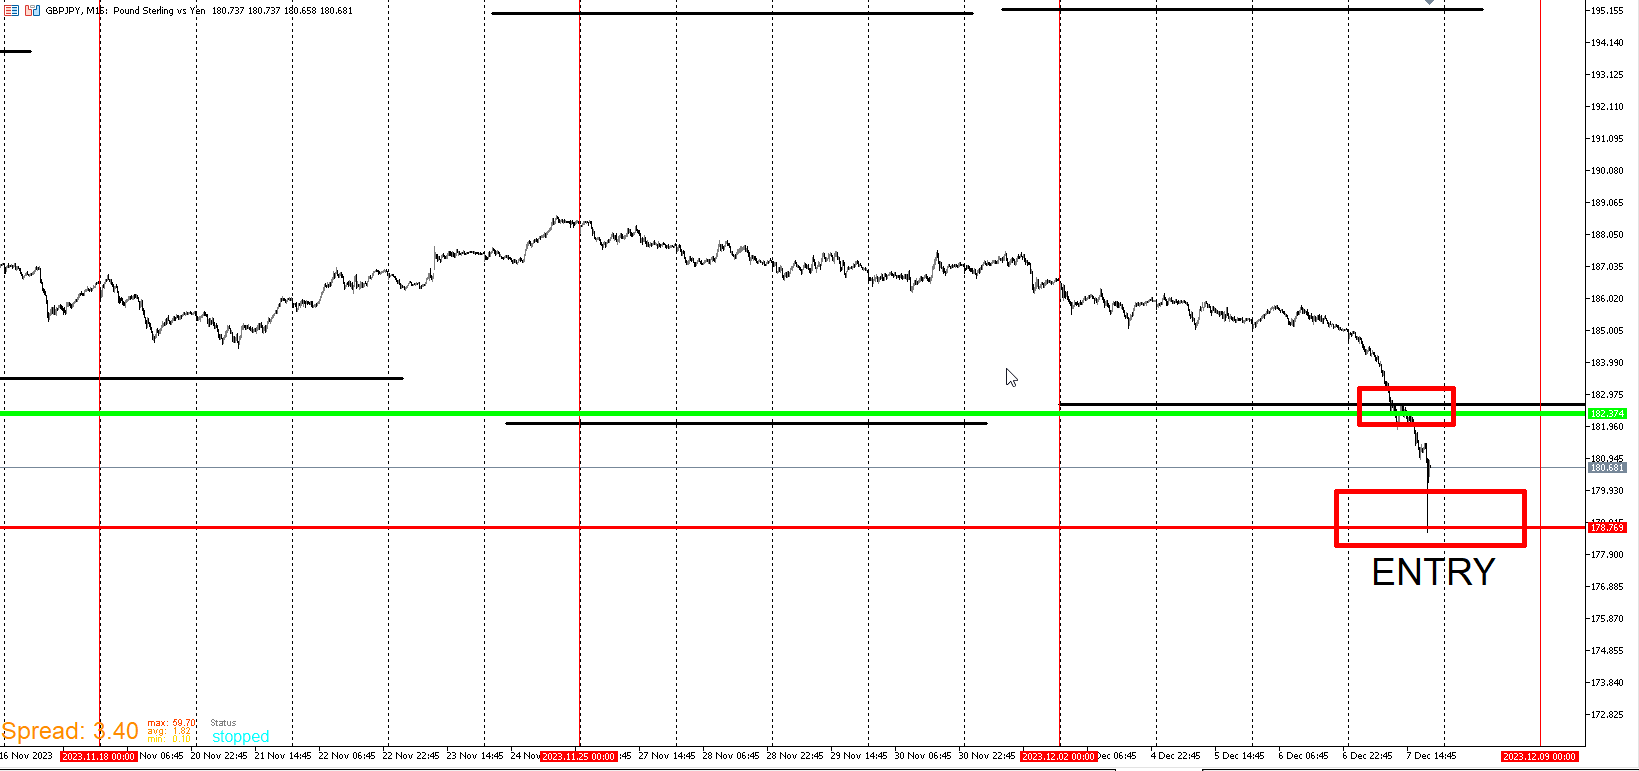
GBP/JPY
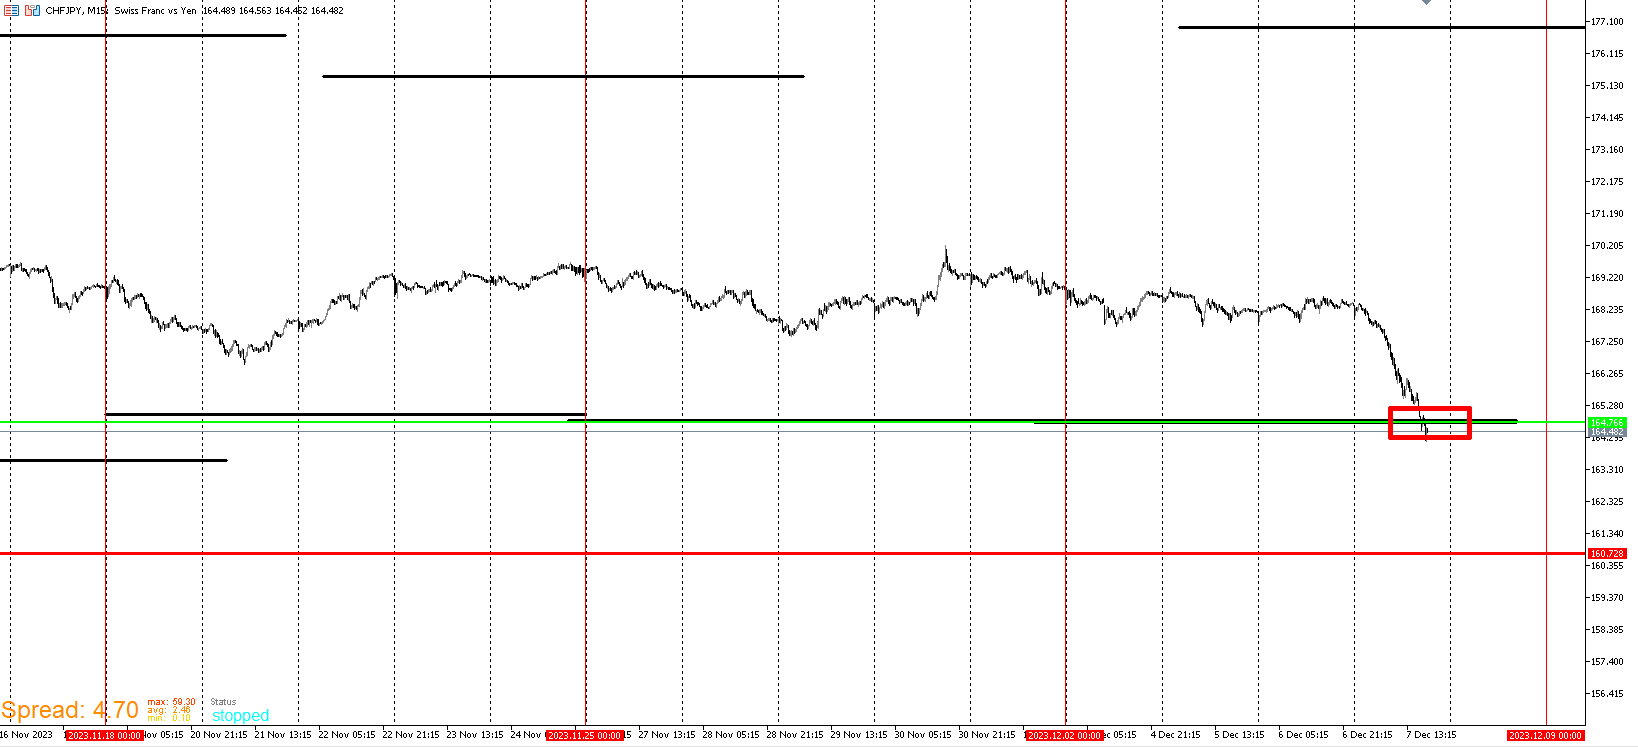
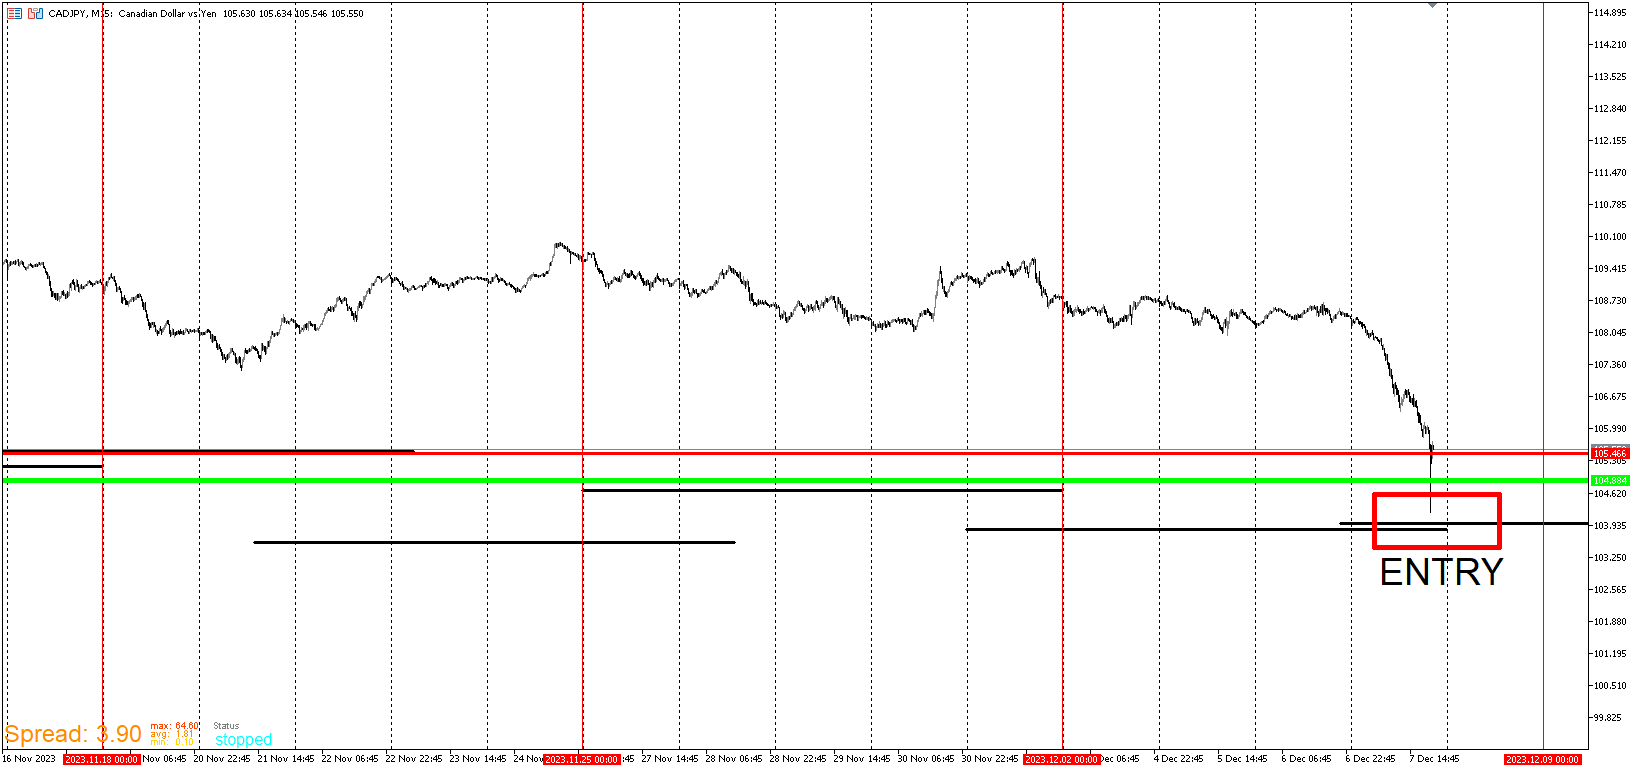
CHF/JPY
The green line is Right on top of the wall line. I'm still looking for price to go lower.
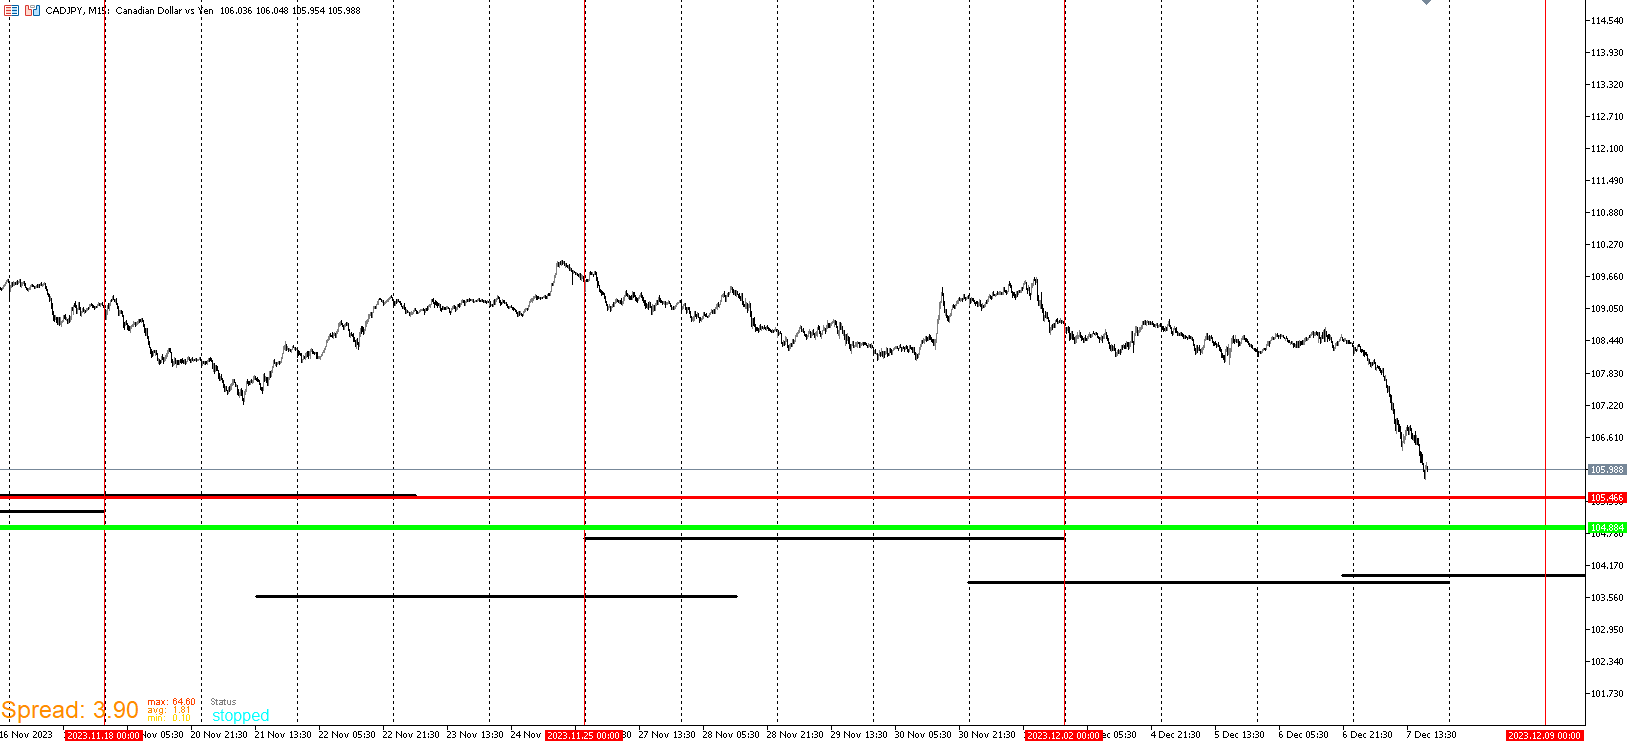
CAD/JPY This one is set up different from the rest. It may get down to the Wall. It may not. I'm still interested as it nears the red line. I just prefer to be under that green line.
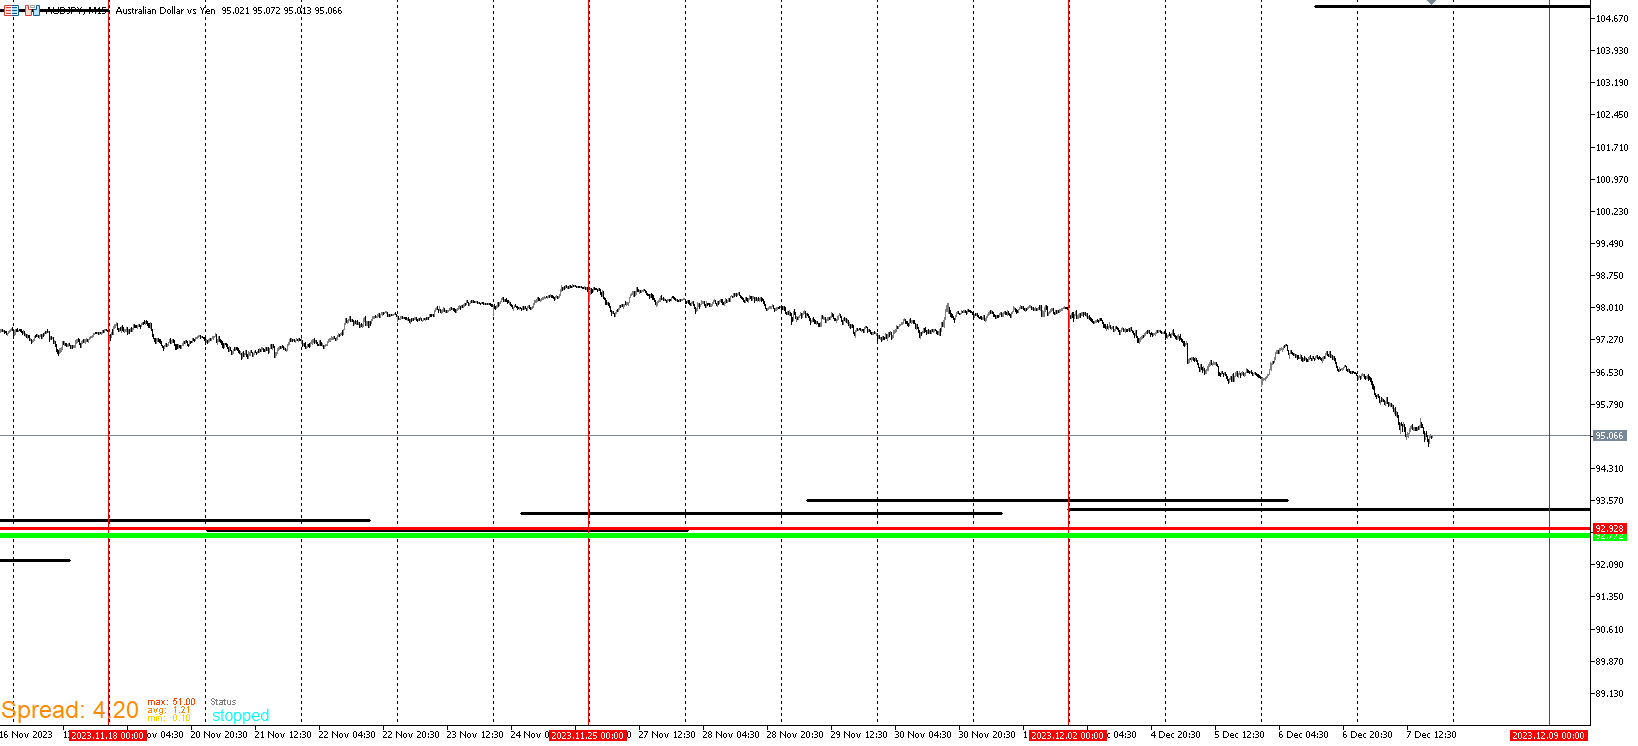
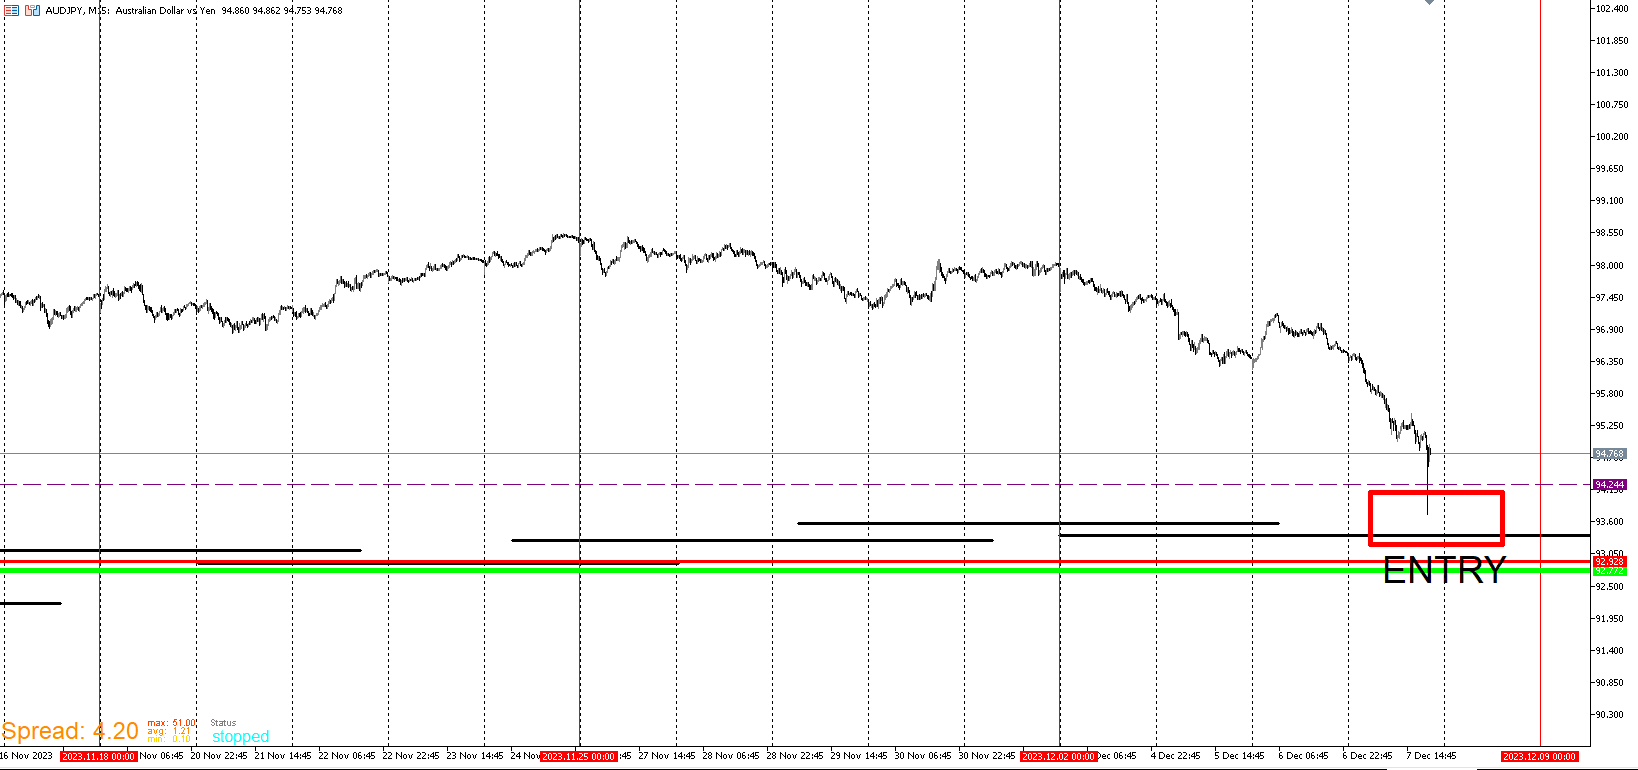
AUD/JPY
-
The move down came much quicker than I anticipated. I entered on every template. Good thing I was here posting and watching. I expected a grind down but historically spikes like that on these templates are promising buys. I still could be wrong. These are the setups I wait for.
USD/JPY
-
EUR/JPY
-
GBP/JPY
-
CAD/JPY
-
AUD/JPY
This is the one that I'm the most confident in. Though it didn't meet my preferred criteria. It did breach a really important level for a Template that I haven't presented yet. That level is represented as the purple dash line.
-
CHF/JPY
I entered here for the same reason as AUD/JPY. The purple dash lines which I will explain later.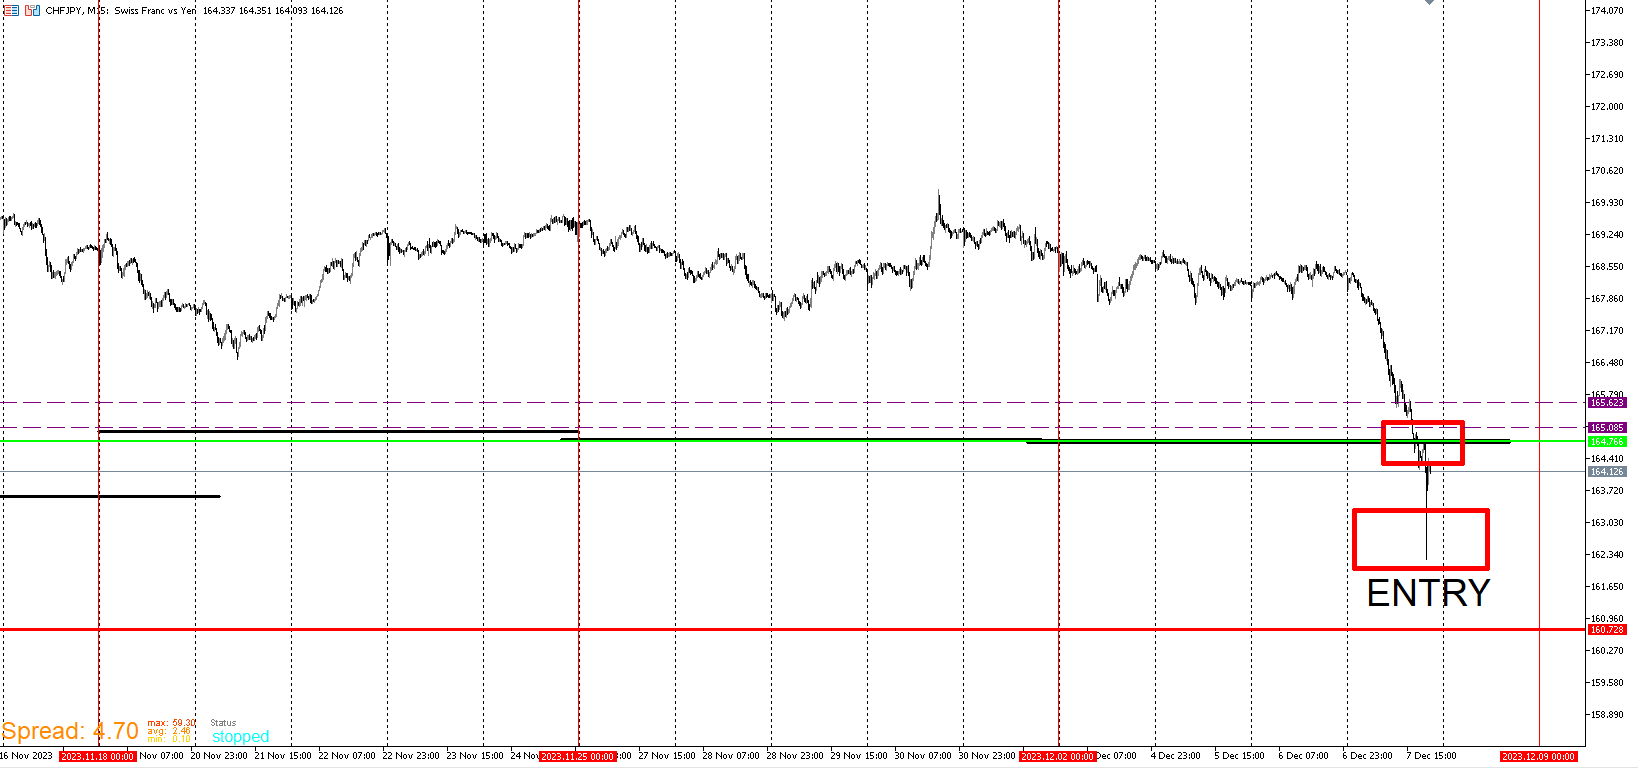
-
So far so good. I hope it holds up.
-
Let's look at another Template that helped me enter these positions. I refer to this Template as interest template. All it means is that I'm heavily interested at these levels. More or less depending on other templates and certain conditions. Like the Wall, price can be short, on, our under. This Template like the other two, don't predict to the tick. They serve as showing high likelihood reversals. The way the signal work is that when price reaches a specific level based on a specific strategy, it will first print arrows. While the arrows are significant and can serve as solid levels, I'm only interest in the level generated below them and above for selling short. This Template combined with any Templates especially the Wall Template makes these signals more powerful.
-
Here's an example of GBP/CAD this year. I combined 3 Templates in one. There was another Template used to help refine my entry but I'll explain that in depth later. What's important to take from this is what I've already covered. Price hit a wall and grinded beneath it the way I like it to. I also like that price went well below my green line template. Underneath green especially over a few days gives me more confidence. And finally price reached down to and below my buy interest area. Notice that there was an interest area generated above one that has been there for a while. Whenever that happens, my rule is to ignore that level and prioritize the one that's been there longer. If the fresh level generates around or below the old one, I'll target it. Just not when it's well above an old interest level. By design the Green and Interest level rule kept me from entering too early.
https://vimeo.com/892799153?share=copy
Here's a recording of the live position. The broker closed me out due to migration so I didn't experience the ride from catching an entry every trader would kill for. It's only fair to post live examples to prove that this system is implemented live with real money.
-
Here is a clarification of Template 3 which is the green zone I look to go long from. As I mention earlier the green line in these demonstrations were added in the EA to simplify it. There are actually many green lines but I'm only interested in the top most. Bottommost for selling. When price substantially rise from out of the green, I then look to whatever green levels come after. This EA is purely used for backtesting and I just get the price level for the topmost green line and I mark it on a live chart. I will show an image and video.
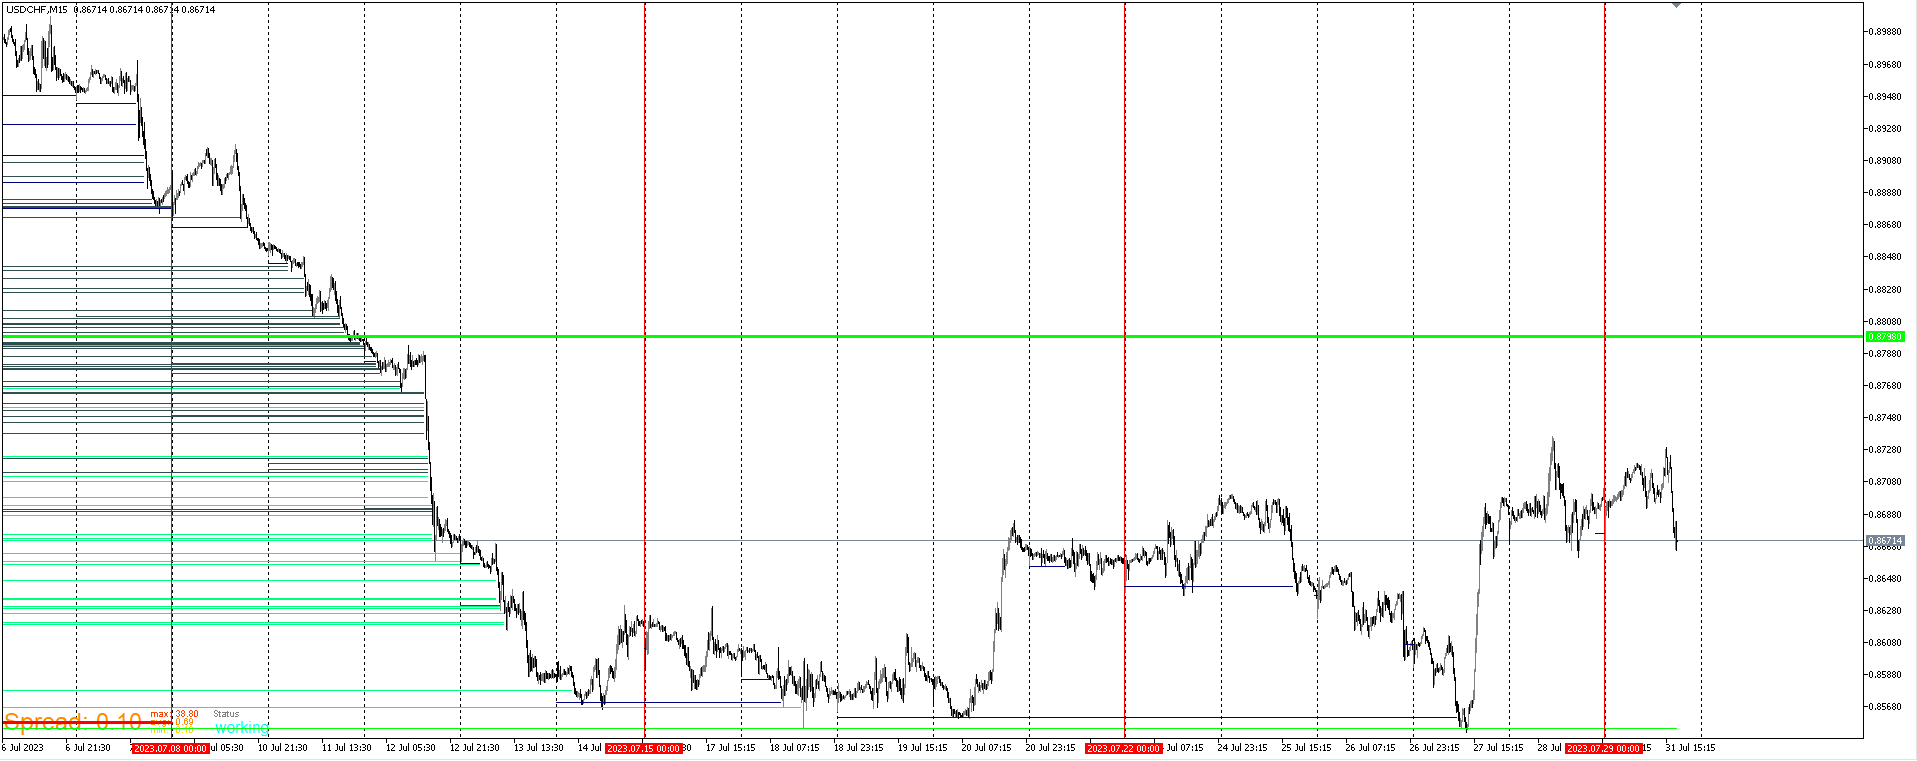
In the video, instead of the Wall lines being black, I changed them to red for visibility purposes.
https://vimeo.com/892839346?share=copyHere is the USD/CHF Signal. I will go over a couple things that made this a powerful setup and could not be detected by looking at the chart naked. That's Template 4 and 7.
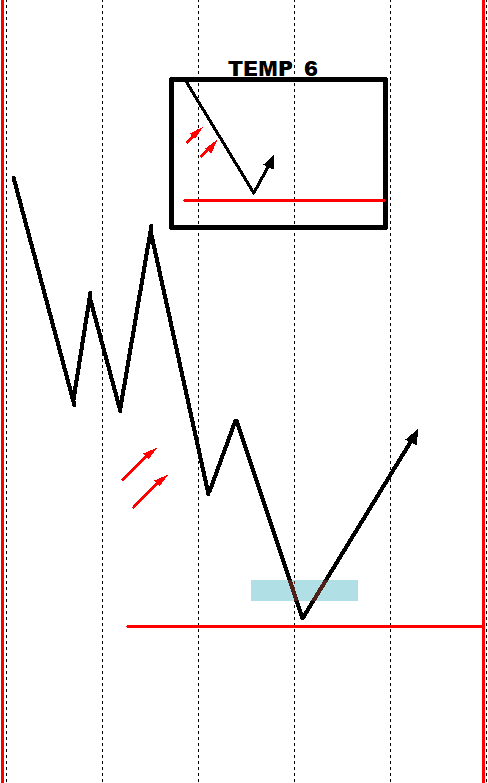
This is a demonstration of Template 6 on this pair. Which is the Interest Zone.
https://vimeo.com/892838193?share=copy -
Template 7 is what I refer to as my Levels Template. This Template has a handful of nuances to it. I use it to get overall context as well as entries. I use it strategically with my other Templates. There are a couple key features in it that solidifies my conviction. This Template will require the most explaining so I will do my best to make it as less confusing as possible.
-
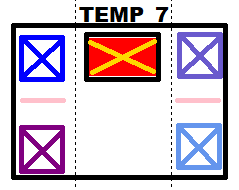
I will first go over the concept and construction of Template 7. This is actually the EA that took the longest. At first it solely placed positions everyday at a specified time under specified conditions. I then noticed a pattern. These levels started to serve as either reversals or letting me know that one is coming. Of course as I mentioned in the other templates, I don't use these signals on their own. Combined with confirmation of other templates, These levels increase the likelihood of a reversal. It didn't make sense to put the EA on a live chart given that it gave data based on orders taken. So what I did was replicate it visually.The left side top blue is the 500 level. Underneath it is the purple 1k level. I look at these in a downtrend. The right side Powder Blue is 500 level and above is is the Slate blue 1k level. These are uptrend. The middle Red is when price substantially surpasses the 1k levels for both downtrend and uptrend. I refer to this level as Gold. The EA's are built to notice rare occurrences. The gold level gets my attention especially when it's the first time price reaches it. I will touch on the pink levels later. The overall idea is that the levels represent the stops getting hit of the virtual orders placed. As I mentioned earlier, this system is based on trades failing and getting crushed.
Here's how it started. I created a strategy that replicates and upward curve. This doesn't mean it's profitable. Obviously there will be a lot of drawdown but that's what I look for. When the curve is smooth, That's a market I'm not interested in entering.

Here is what I look for. These breaks in the curve are what the levels represent.
