My EA update
-
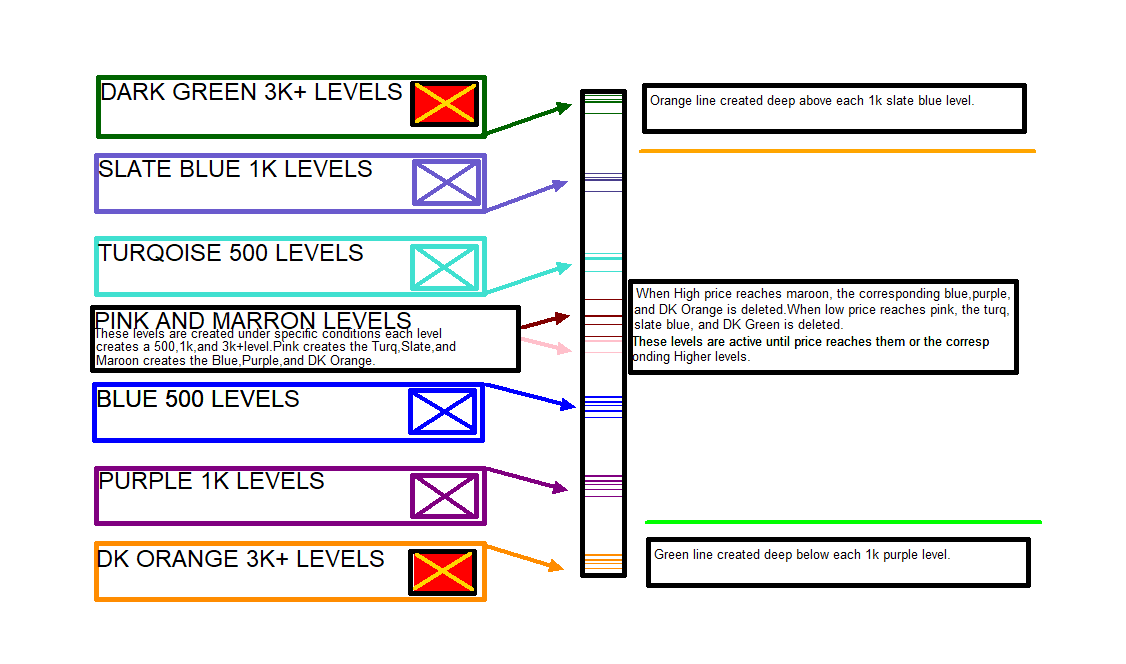
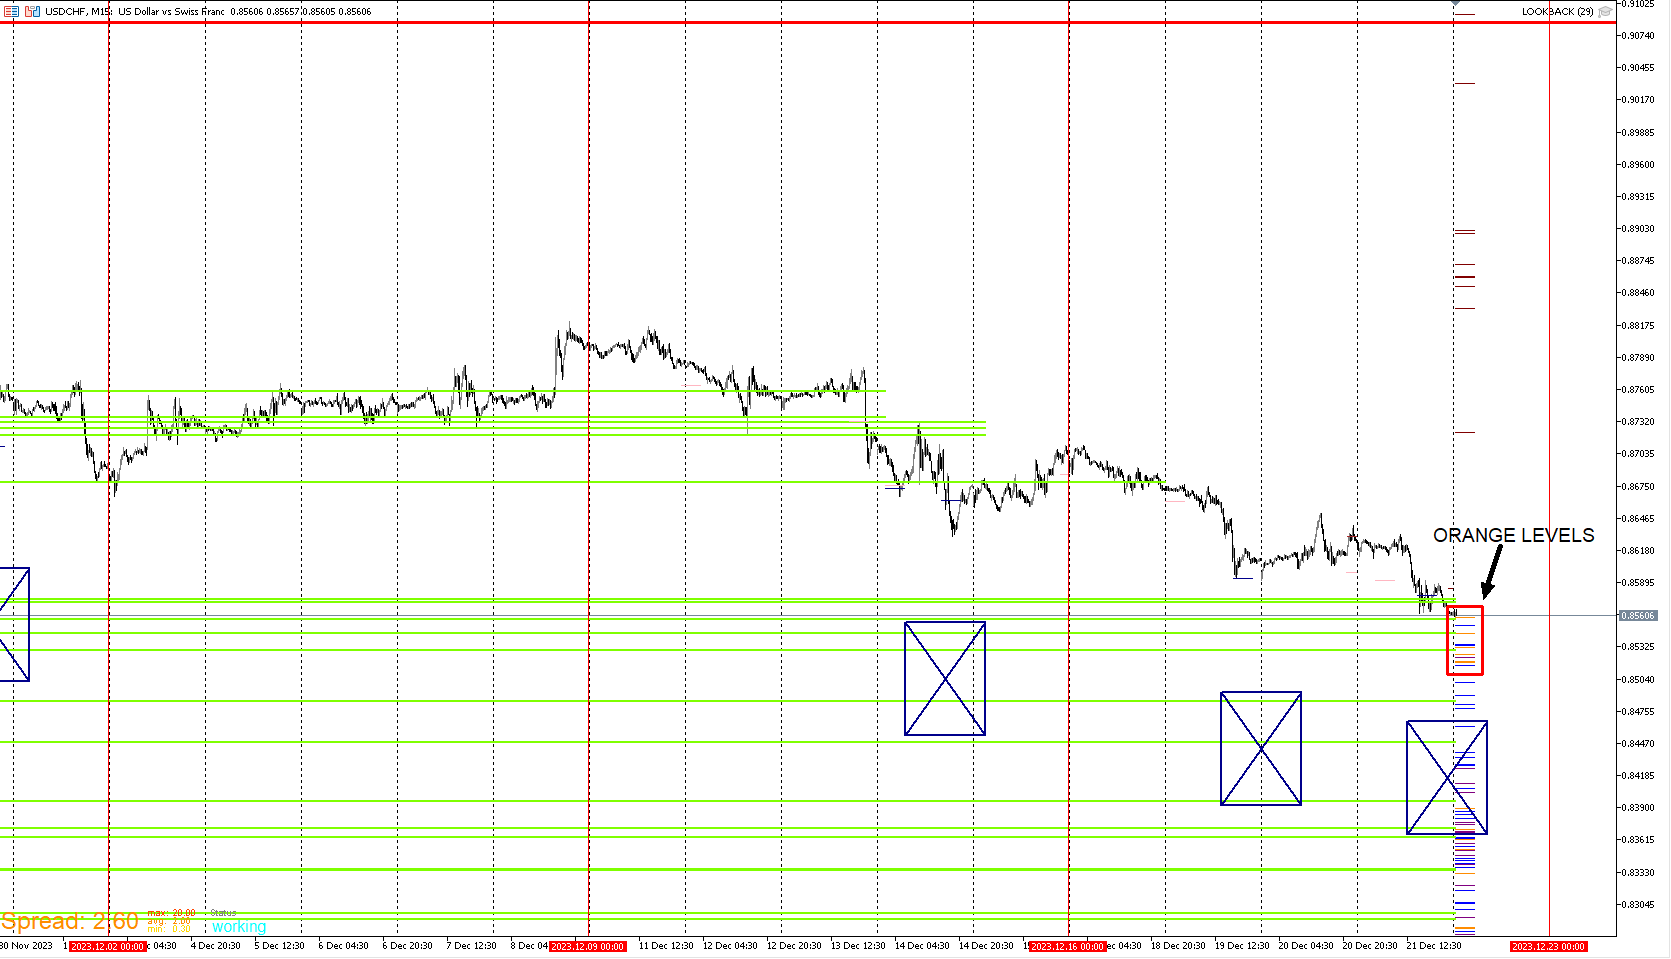
I will explain the orange lines at the top and green on the bottom. When price reaches the 1k levels, these lines are generated a certain number of pips away. They aren't used for entries or anything, It's there to illustrate price action in positions whose stops are wide from the 1k levels. When price is in these zones especially deep and over a period of time, I see that as large timeframe positions panicking. Or if price consolidates there for a while, they are impatient. I like to see these levels get crushed. Any time price crushes deep through these guys, this is where to enter positional positions. When it looks the scariest for buyers in the green, that's the fear you'd want to buy. Vice versa for selling in the orange.
-
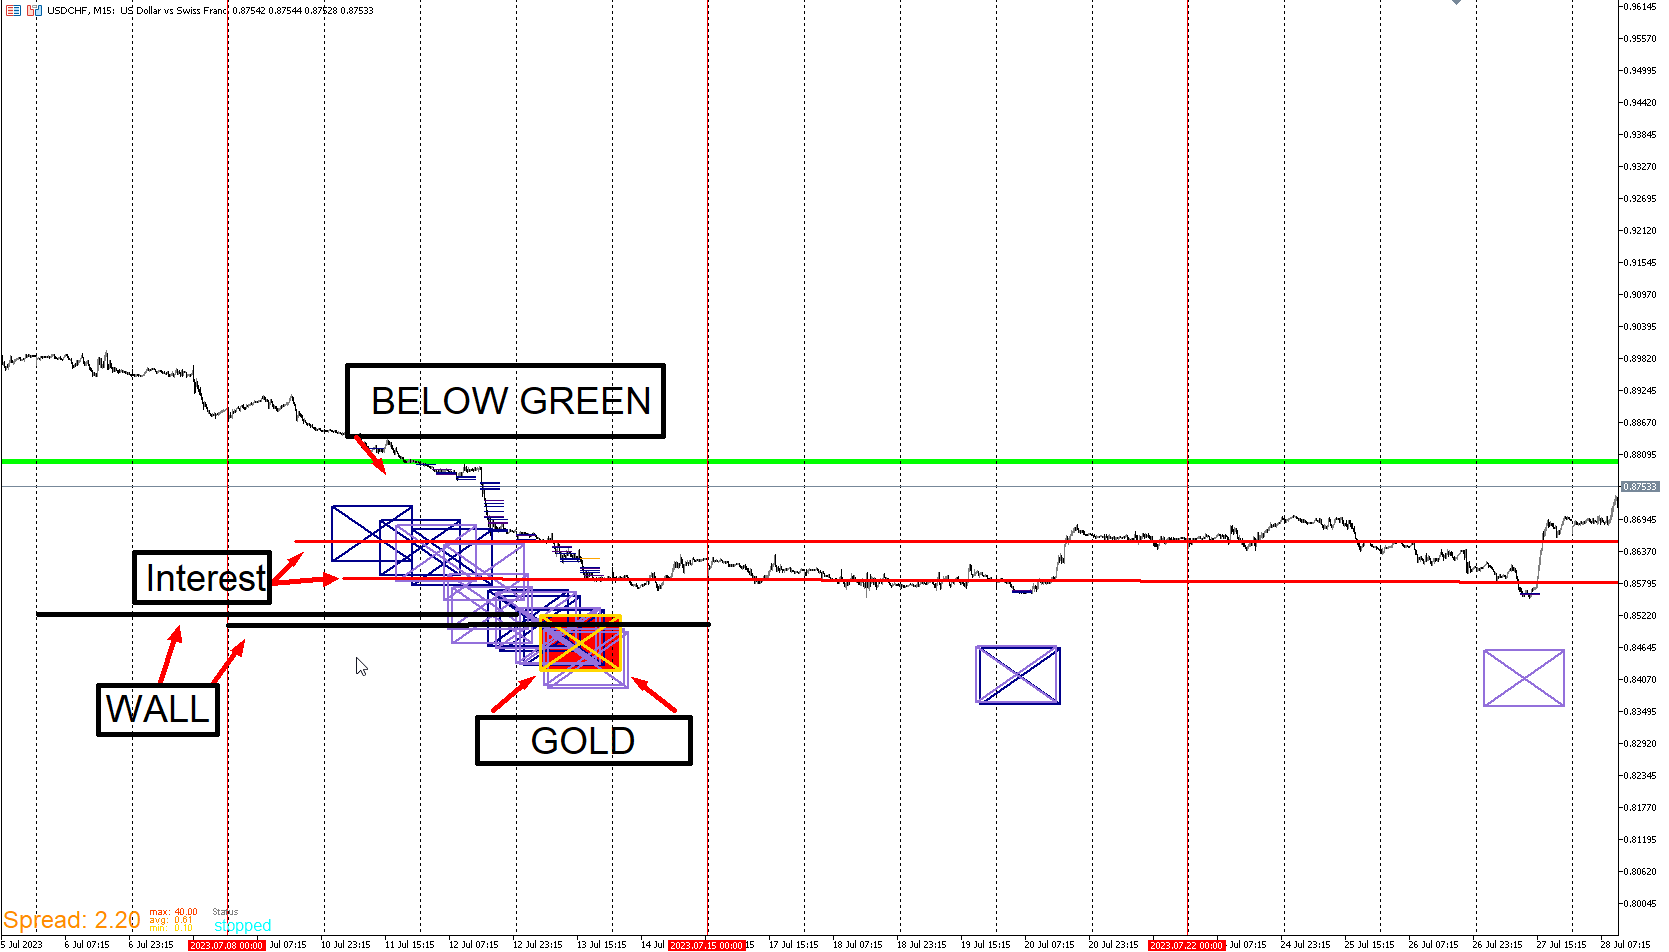
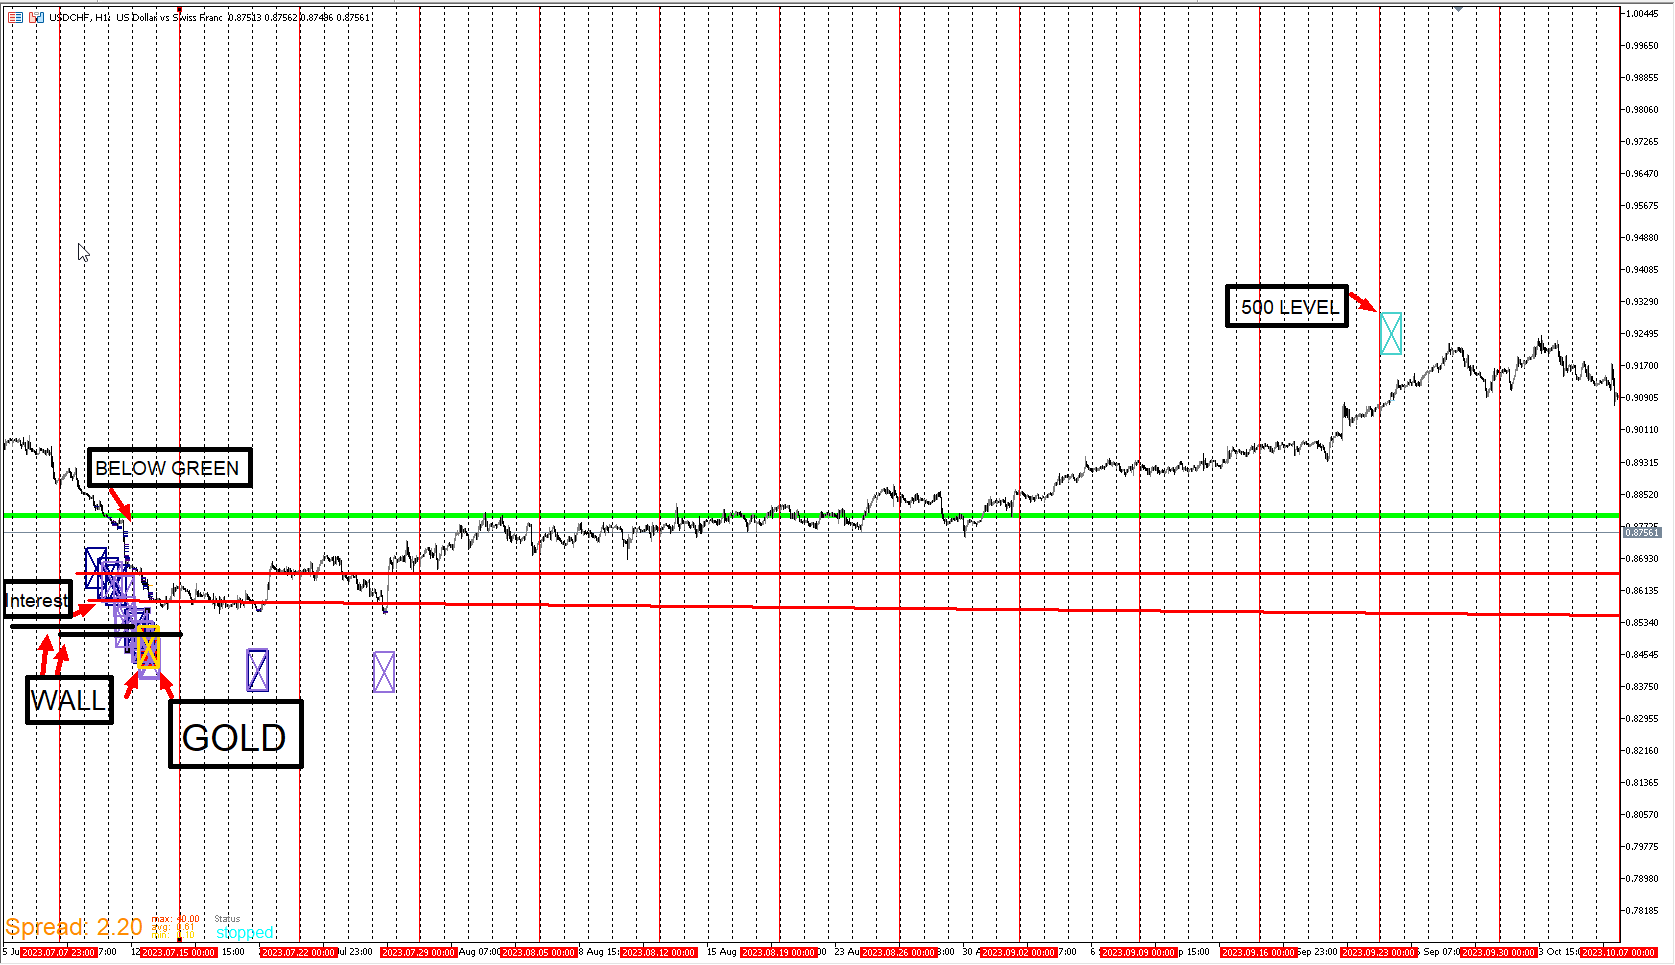
Here is the USD/CHF example from earlier. Here's an example of multiple Templates lining up. This type of setup is the power of this strategy. Template 4 is there too but I'll cover it later. Once you see enough of these setups, you can't unsee them as they set up.
-
Here is a video of Template7 EA. Sorry the colors are off. The quality is not so great because I recorded sped up versions so that it wouldn't take forever to view. This just demonstrates how it looks in the tester before the template is applied to a live chart followed by the EA.
https://vimeo.com/895101071?share=copy
The video is slowed down towards the end to accurately show the colors.
-
Here is a closeup of the basic layout of Template7. The overall Idea of this Template is to help identify extremes that I'm interested in. Doesn't mean I blindly enter on them. They do get my attention especially when other Templates are setting up to my preference.
-
Impressive!!!

-
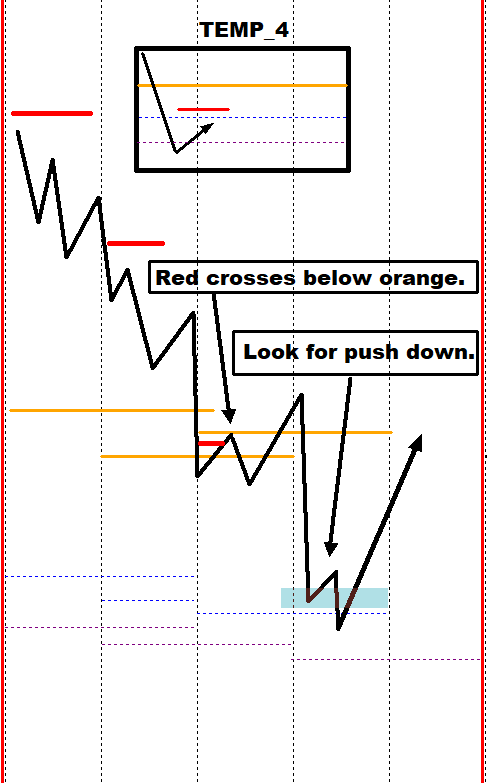
I will now demonstrate Template4. It's another important Template I monitor for each pair especially when other Templates show an opportunity. It may seem to be a lot going on in this template but I'm only looking for two things. I look for the short red line to either pinch on the orange or cross below. Whenever I see this, I draw a box around the area and wait for price to dig lower. The second thing I look for is if price digs down into the blue dotted and purple dotted lines. I look for this setup in a deep downtrend preferable below a major structure break. It can happen in a continuation in an uptrend But the other Templates need to confirm for me to take it. Mainly the wall. I will post examples to show what I visually look for when i check the charts with this Template.
-
This is how it visually play out when I see setups forming. If price comes down as I want it to, I believe that template4 will set up. As of now, it's just not there plus my other templates aren't there yet though I see them setting up potentially. Template4 can and do form anywhere on the chart, I'm only interested in it when it aligns with my other Template setups.
-
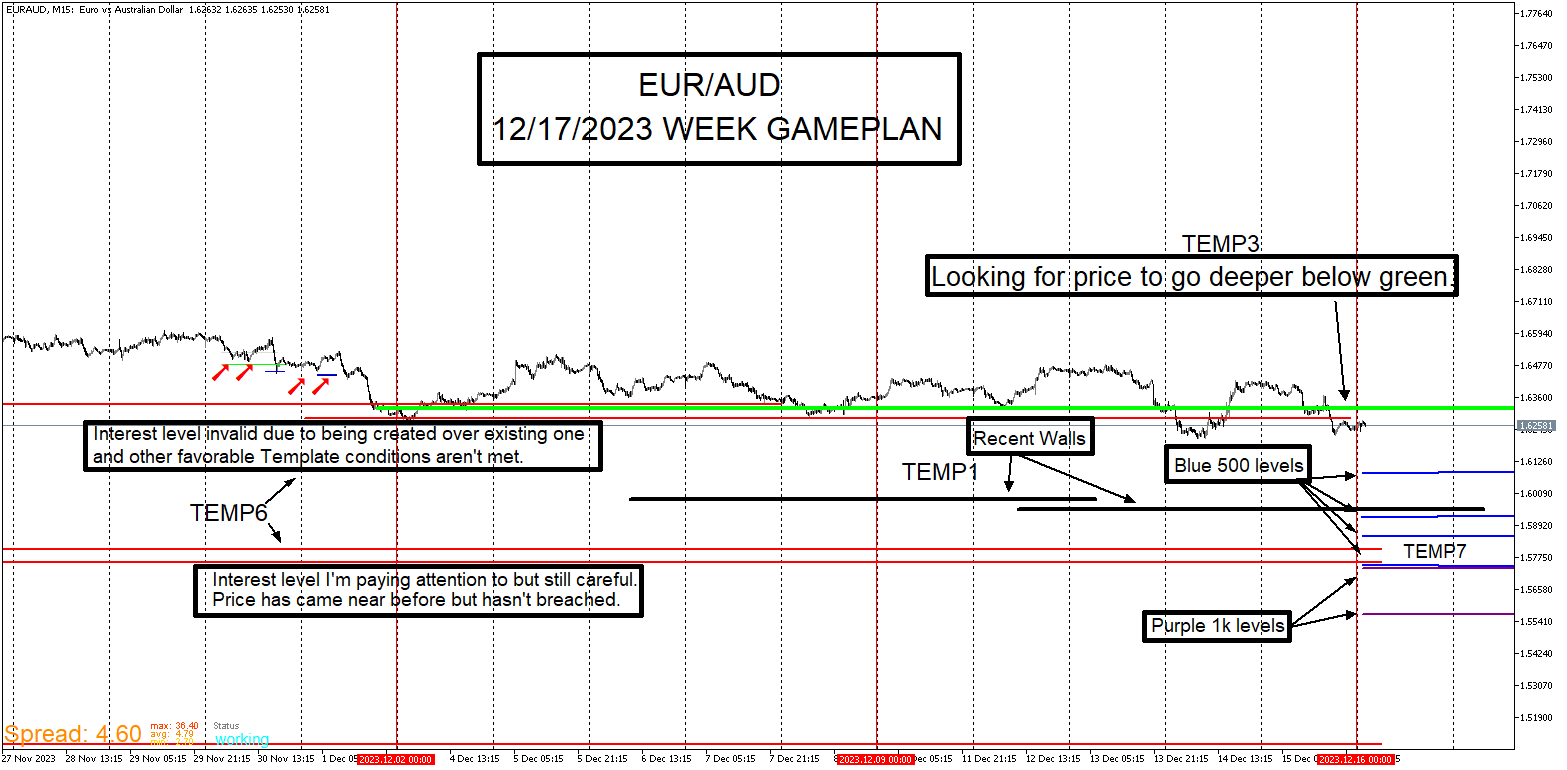
EUR/AUD Update
Still watching this pair. Still doesn't look like a good time to enter.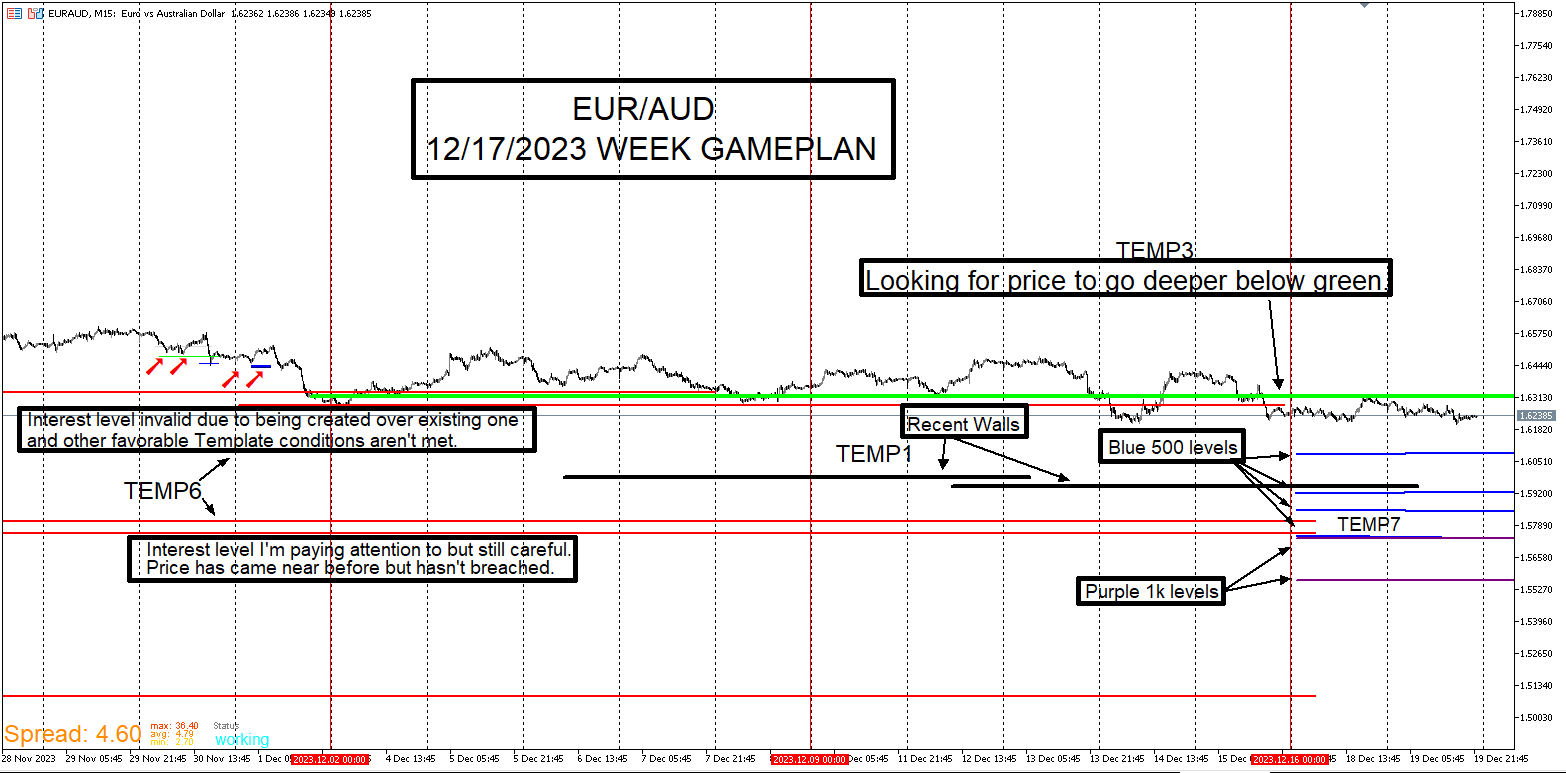
-
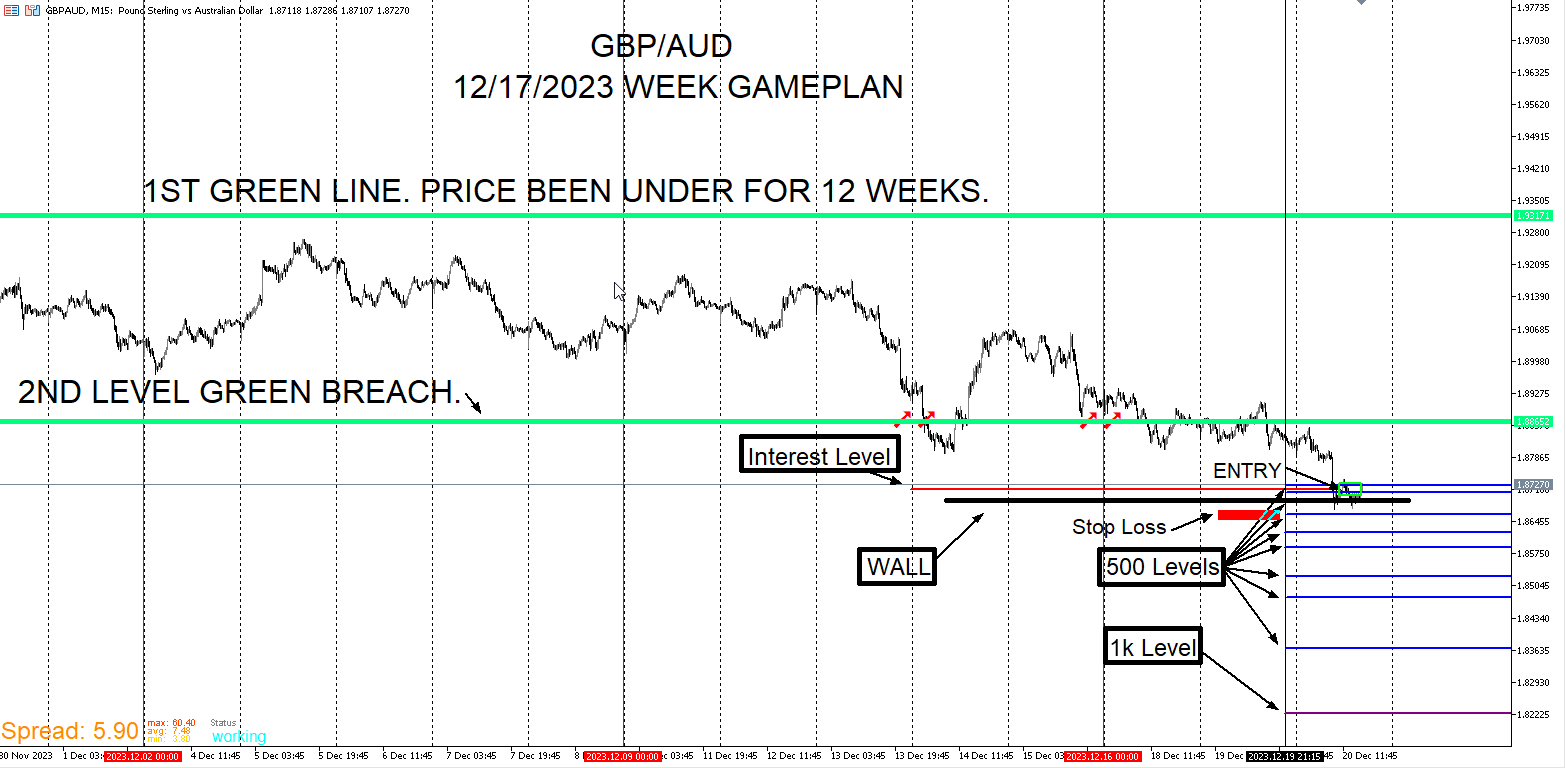
GBP/AUD I entered on this setup. My logic here is that if I believe there is a chance that wall could hold up, I may as well put a position on there and the stop loss shortly underneath it. Though I can't be for certain either way, This is the type of setup I take like a robot. Very minimum risk.
-
Are you really using 500 different levels?
-
@l-andorrà That number isn't the number of levels. That number represents a 500 pip stop loss being hit from the virtual order that was taken. Sometimes there are very few, sometimes there are clusters. My other templates help narrow it down and they use opening range and breakout strategies. The concept is the same for those too. Where those strategies tend to fail, That's when I look to enter. Price tends to close well above after it reaches a level. Vice versa for selling. If that level is aligned with other templates, I enter just off that fact. The JPY pairs I entered on hit levels too. I'll update the status on those later in the week. As of now it's pretty clear it was a solid callout.
-
Here is a live example of USD/CHF. Price is reaching a fresh Orange level . This is a rare occurrence that I look for. Doesn't mean that I enter. This gets my attention and puts me on notice.
-
I'm back and I'm about to post an update on the positions I entered and why. I know it's been a while since I last posted but as I mentioned at first, I built this for swing/position strategies. So I have to let the trades develop over time. These are positions for both personal and prop firm evaluation. So you are seeing my live thought process and can compare it to what's actually transpiring. I'm displaying a method that utilizes backtesting and that when done right, there can be an edge to it.
-
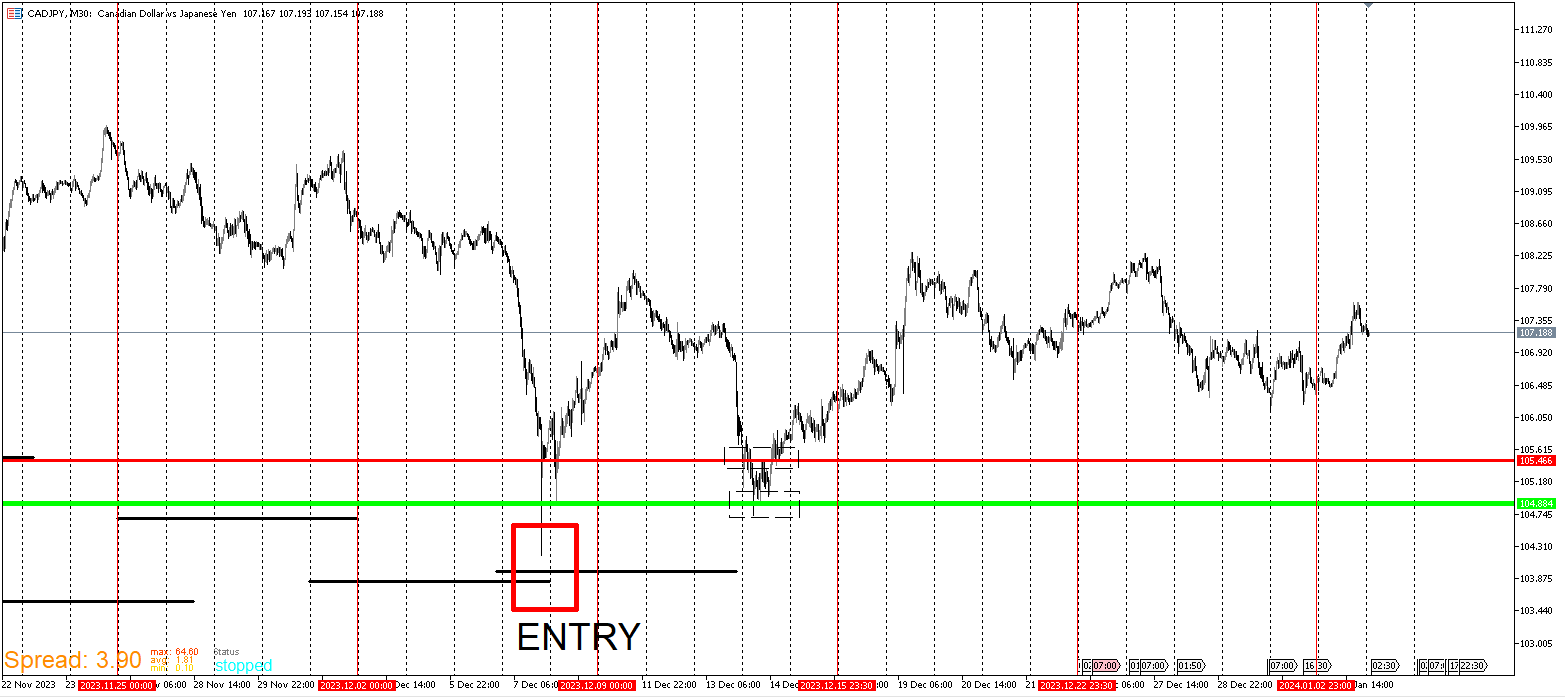
Here is an update on the first example USD/JPY. If you go back to the first page, you will see that I posted the entries beforehand. I am no longer in need of the wall Template. It has done it's job. The upside that I noticed with this strategy is that if timed right, there is plenty of time to access and get out if I choose too. Statistically even if lets say that price does decide to go down further, It more times than not comes back up enough to give a chance to get out with some profit. This is just what I observed through a lot of backtesting and it's playing out here at least with this pair. There is what I consider a high probable entry after it played out but I did enter there and will post the template that given me that signal as well as the trade itself.
Here's what I look for in these setups from start to end.
When the Wall and other templates line up, I expect immediate to mid term upside. Sometimes price never returns, sometimes it comes back down. Usually there is 150- 250 pip upside before it comes back down.
I look for how price interacts with the green line level and interest level when price retraces back to it. I've drawn dashed rectangle boxes around it.
From there it's just letting the trade mature and watch for it to hit the higher levels.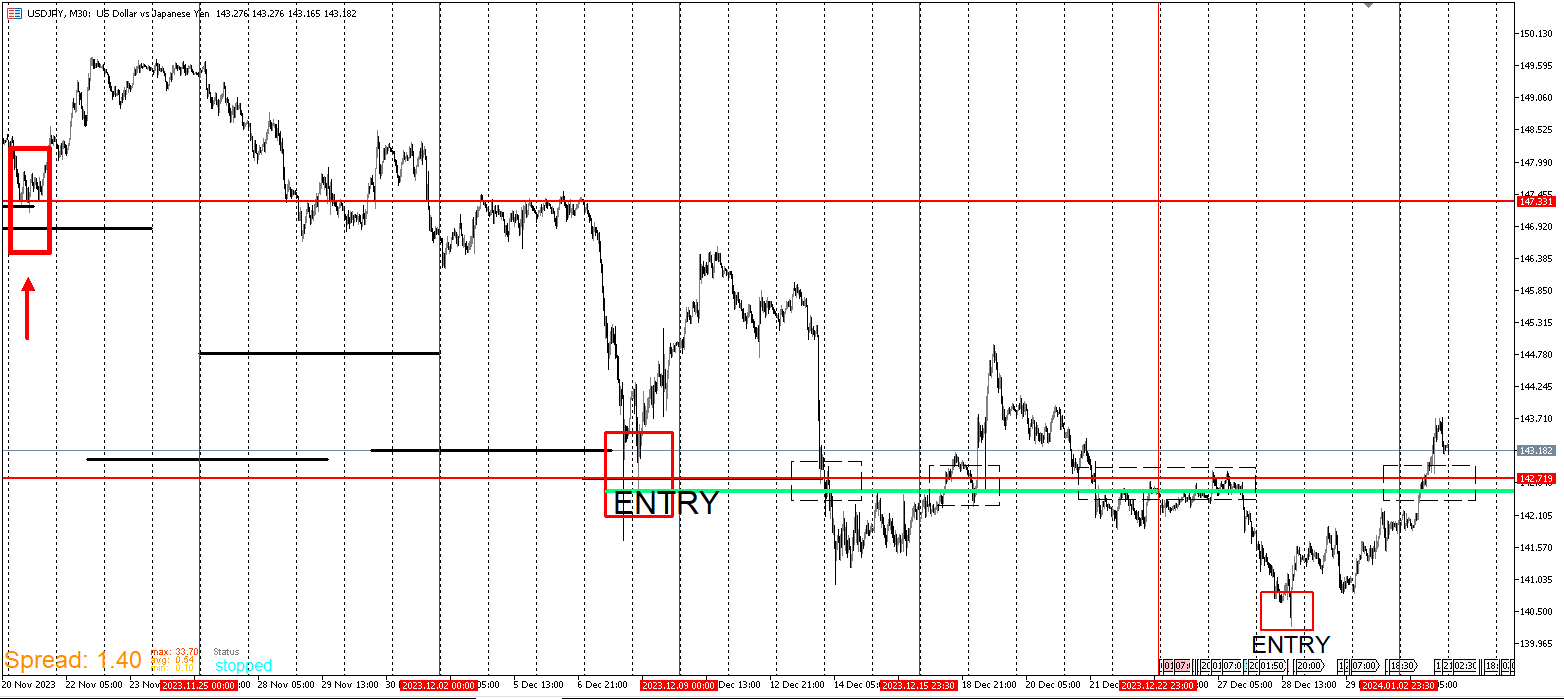
-
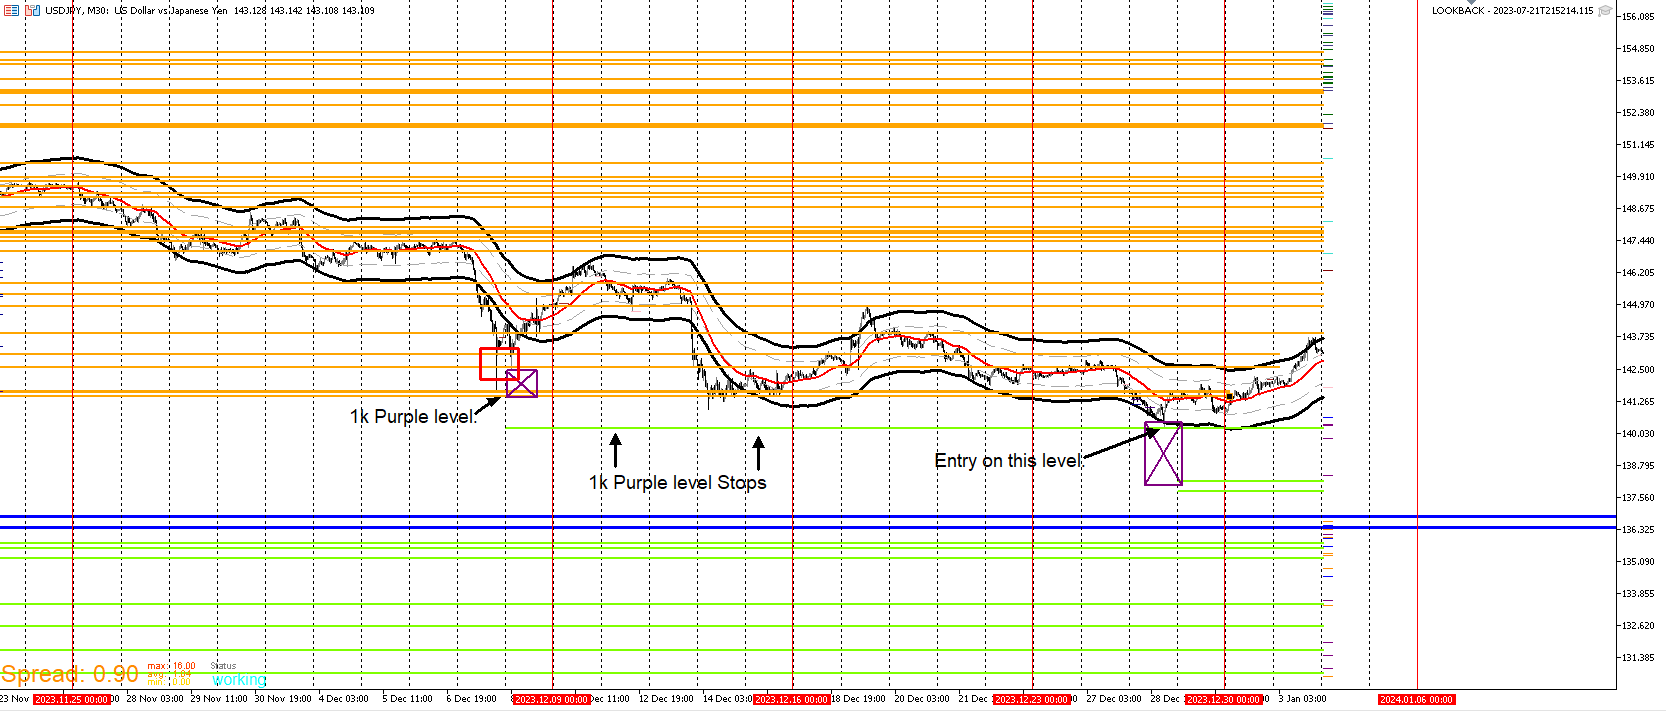
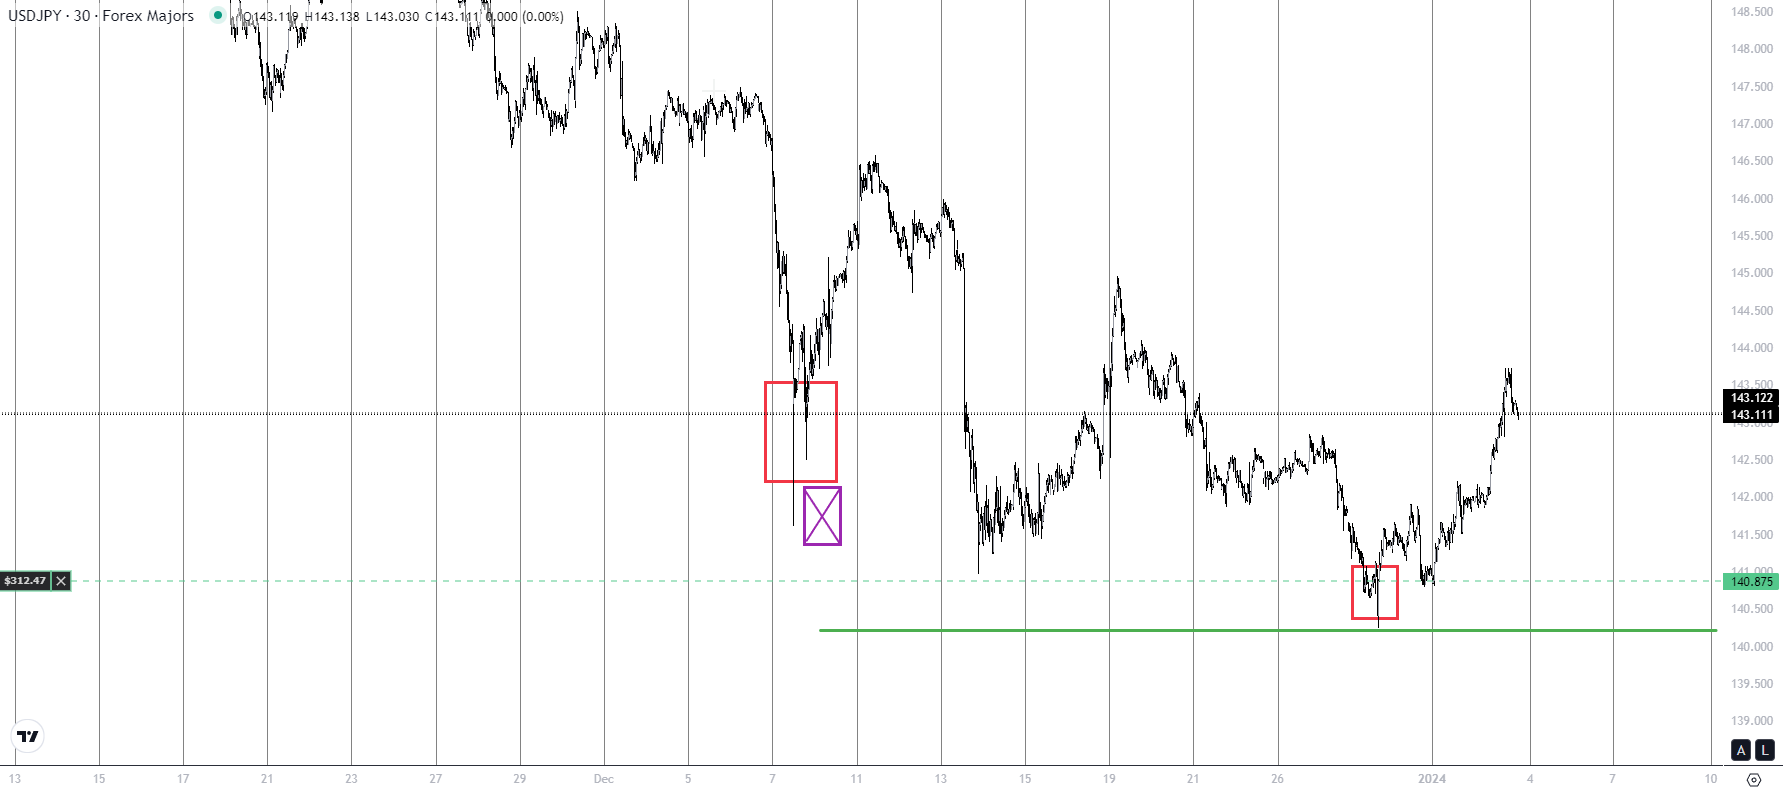
Here is an explanation of the second entry. My idea here is to buy that green line created from the purple 1k level offers likely upside. I entered just knowing likelihood.
-
-
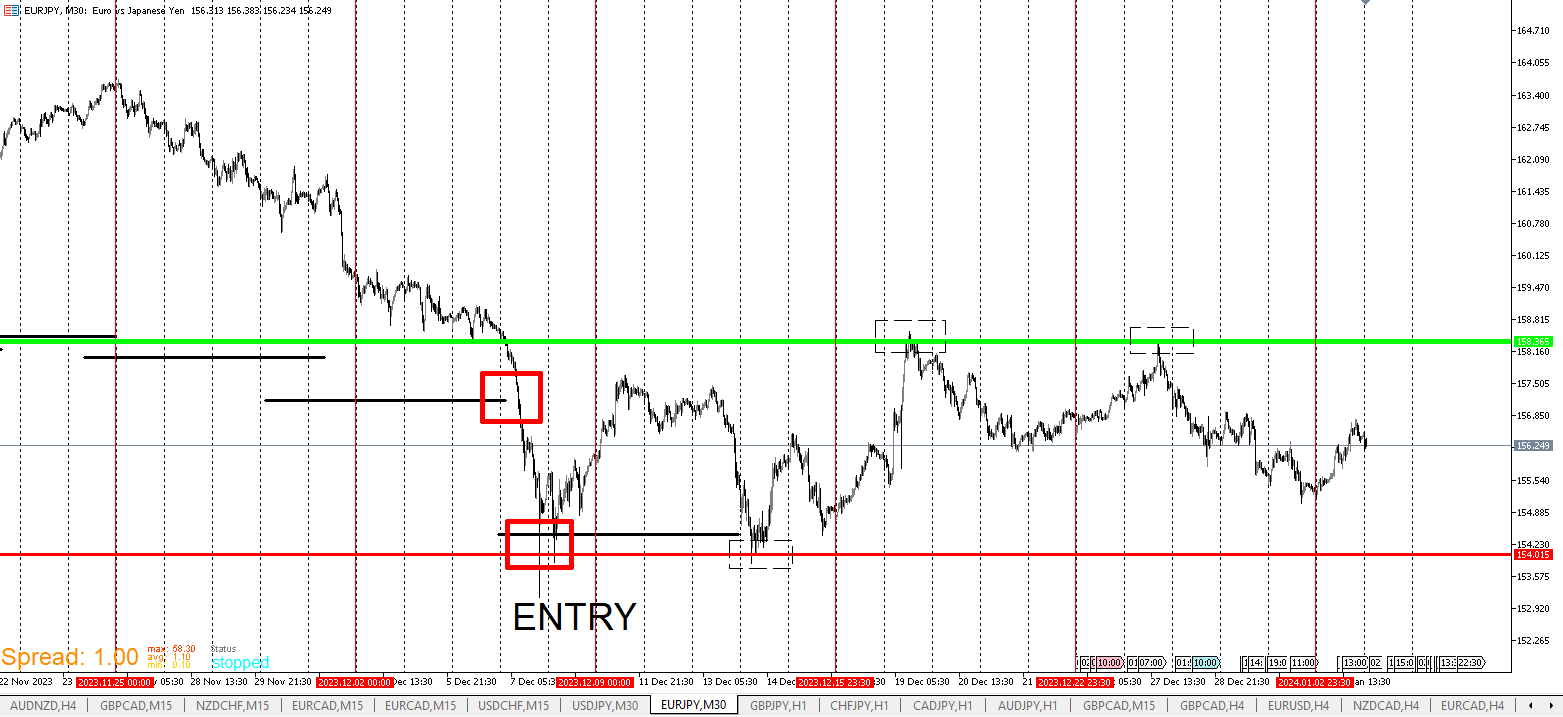
EUR/JPY
-
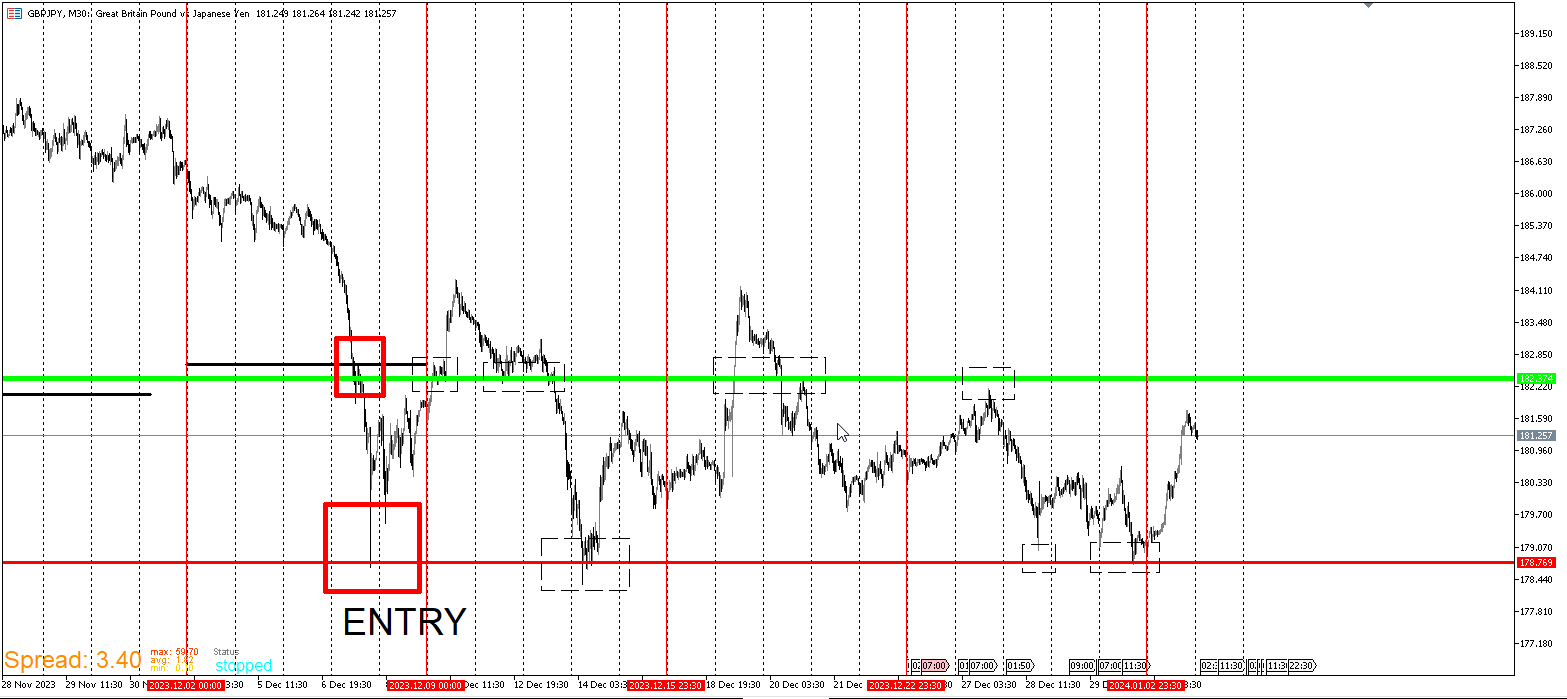
GBP/JPY
-
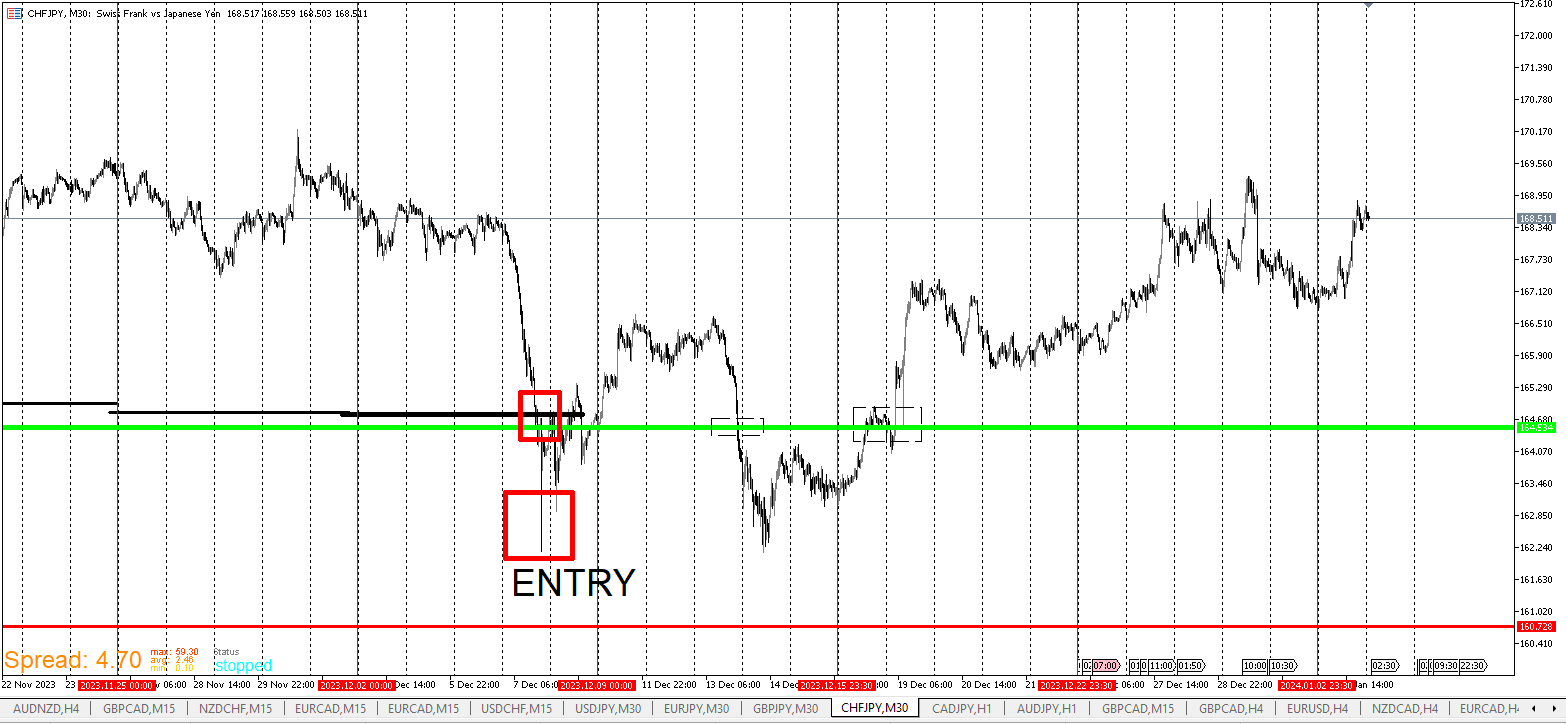
CHF/JPY
-
CAD/JPY