My EA update
-
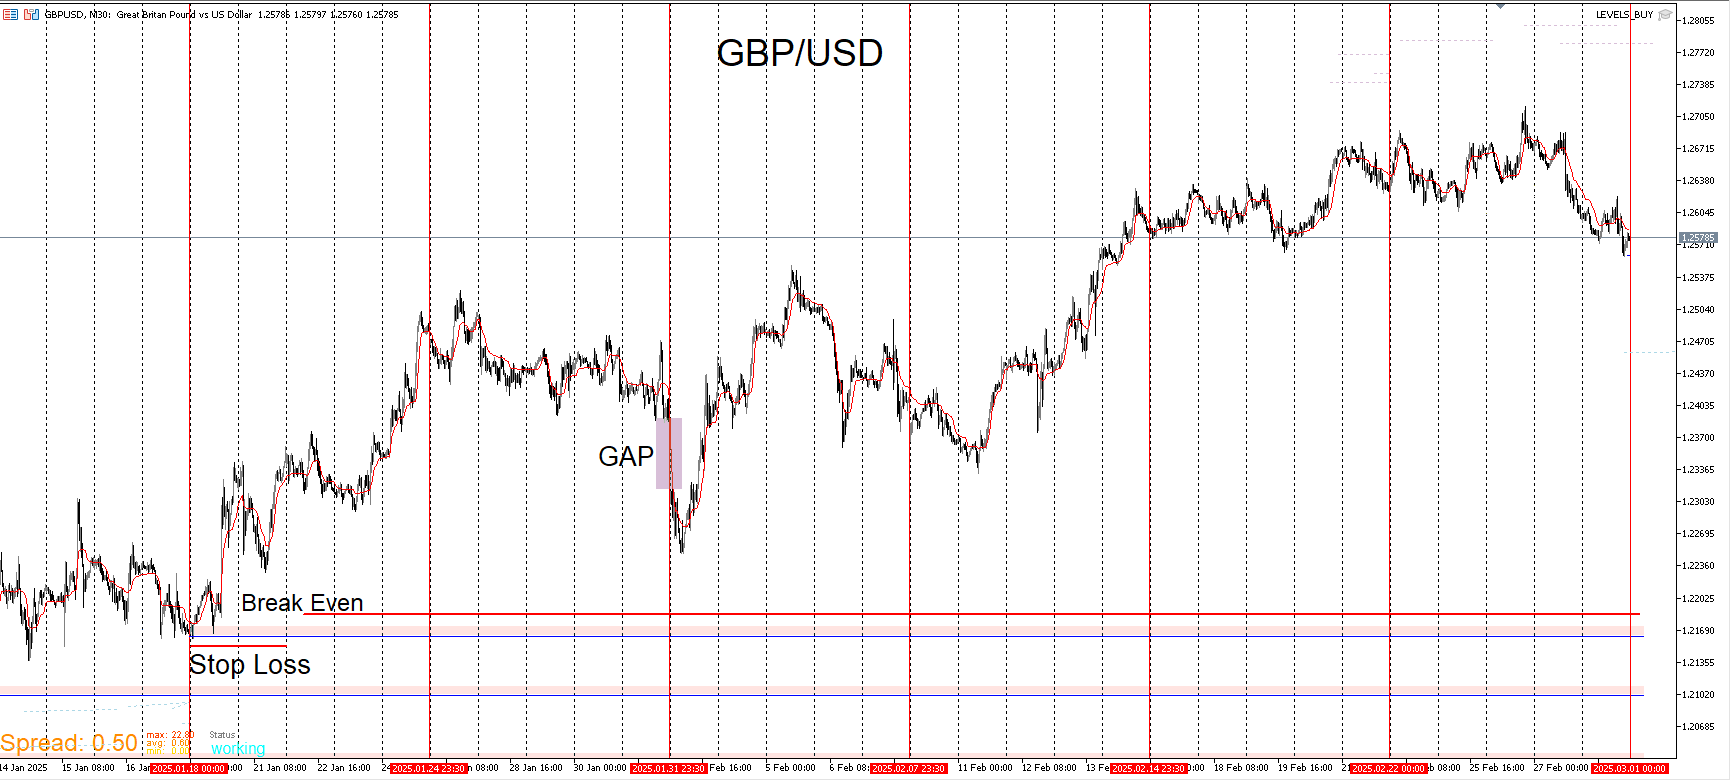
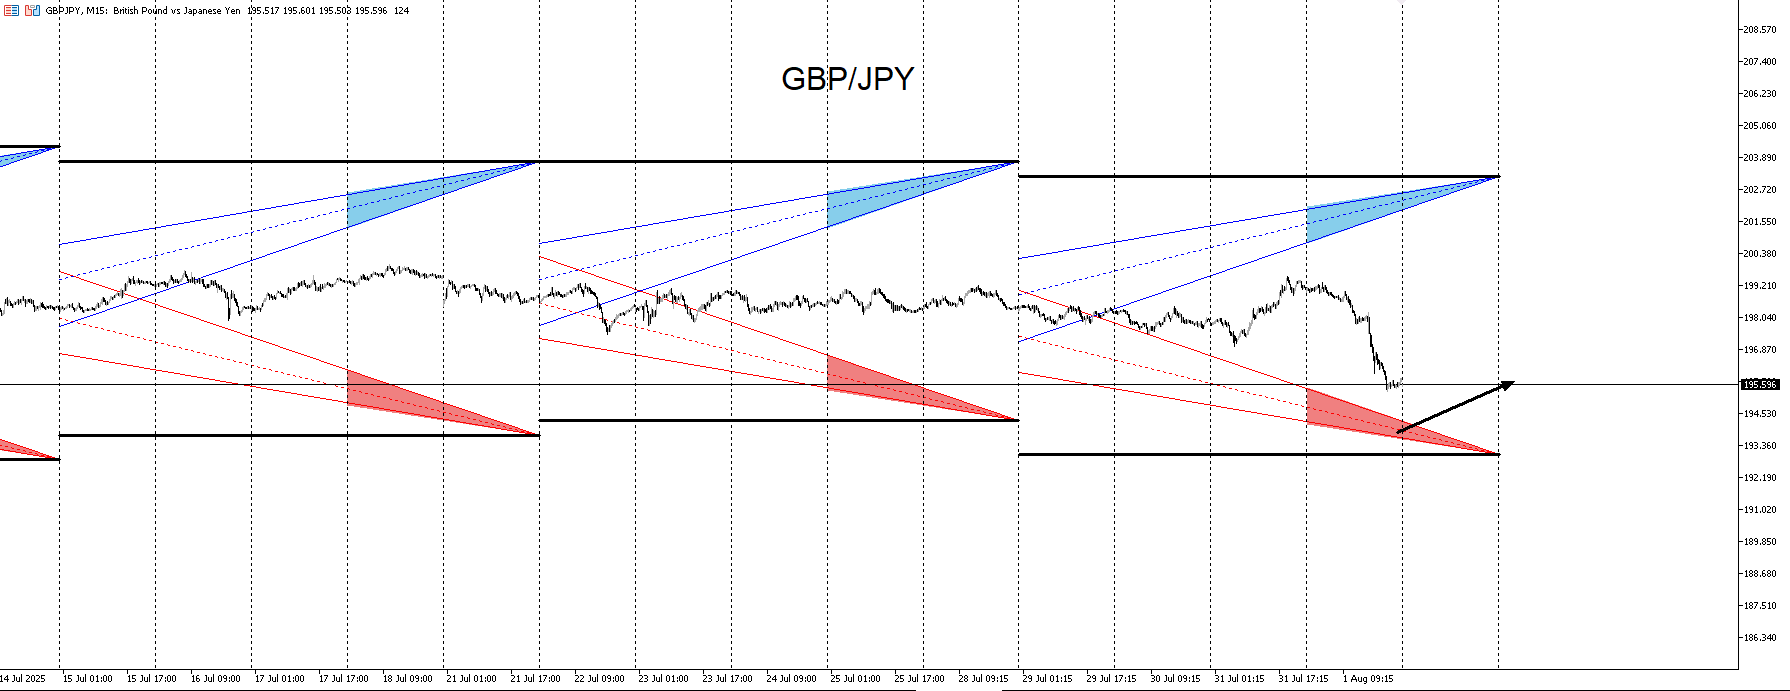
GBP/USD gapped as well but it didn't gap down far enough to take me out. Still holding that entry. The type of stop I use depends on the setup. While I'm not a fan of tight stops, I use them here because it makes sense for the setup. I aim for a roughly 20 pip stop. If i do go for 30-40 I lower the size. This pair moved 540 pips from my entry with the stop being at 20 pips. It's risk free now and this is why I utilize this template because we all love those type of entries no matter how impossible people say they are. It's not easy but it's my personal style of trading.
-
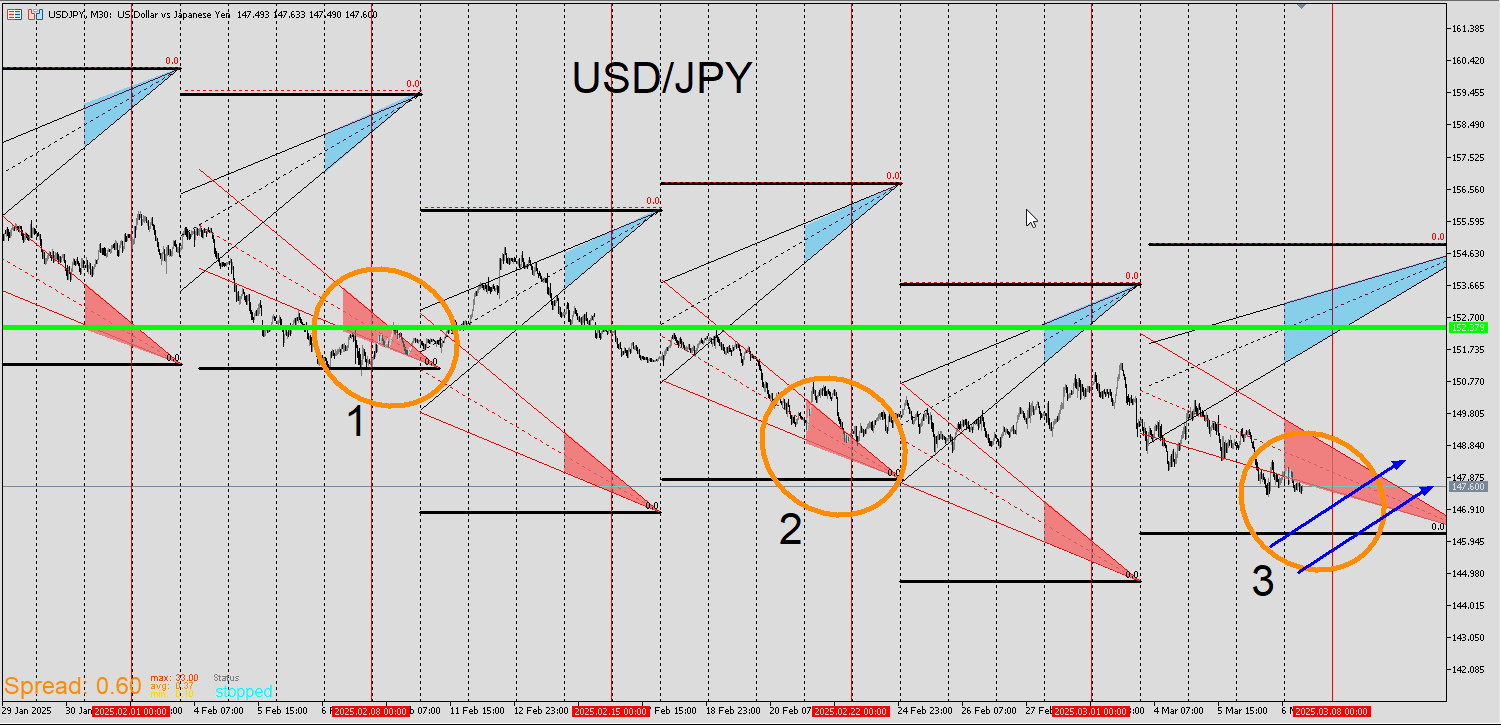
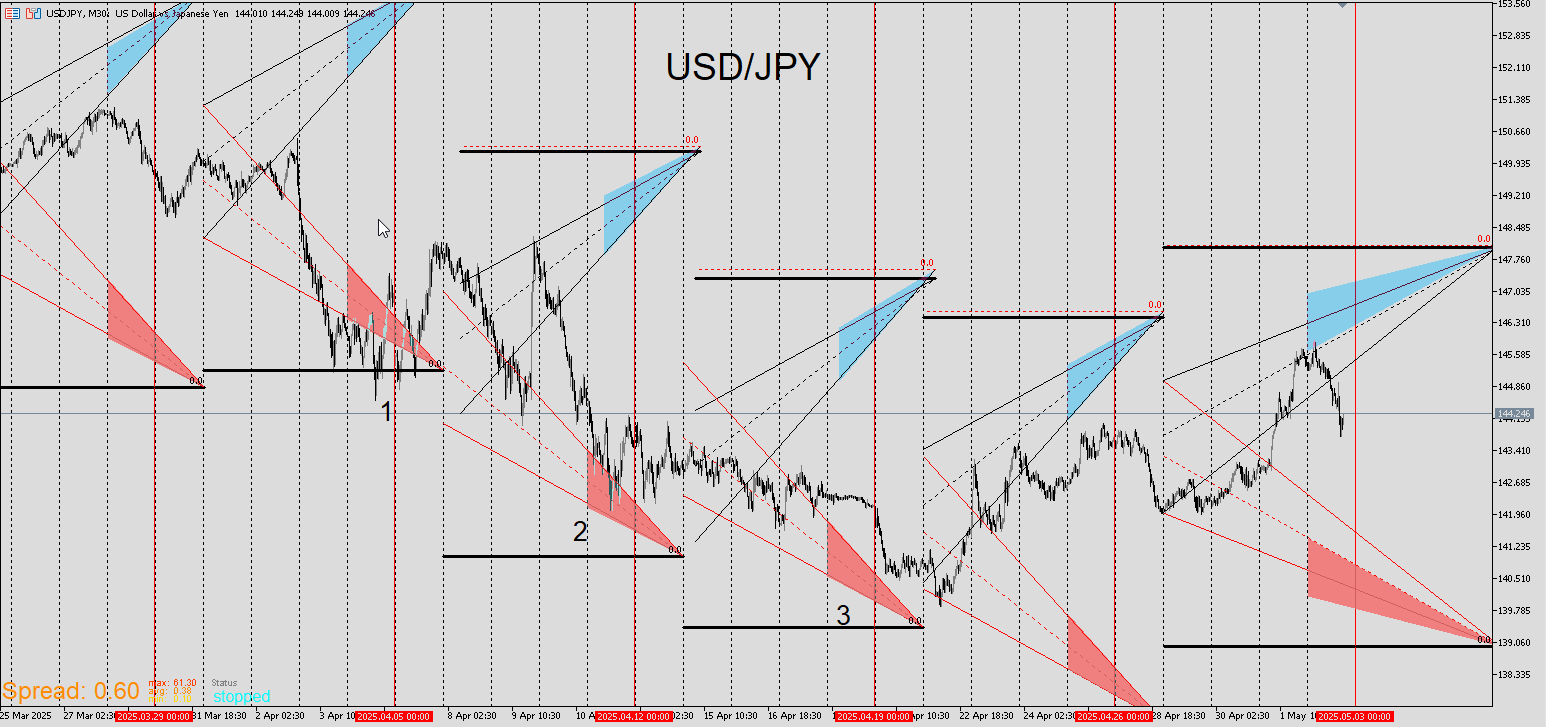
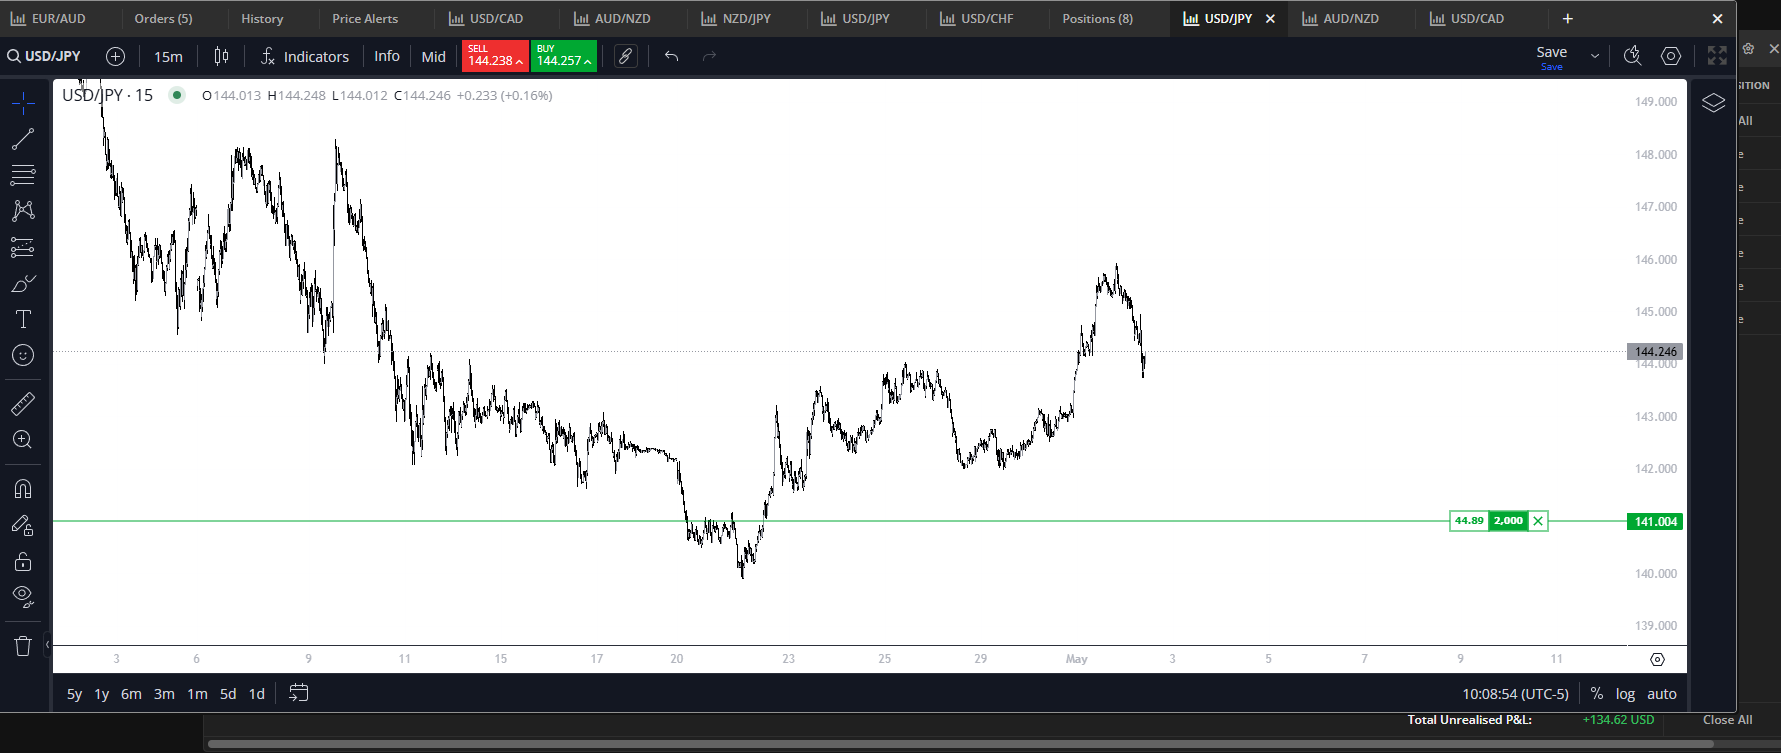
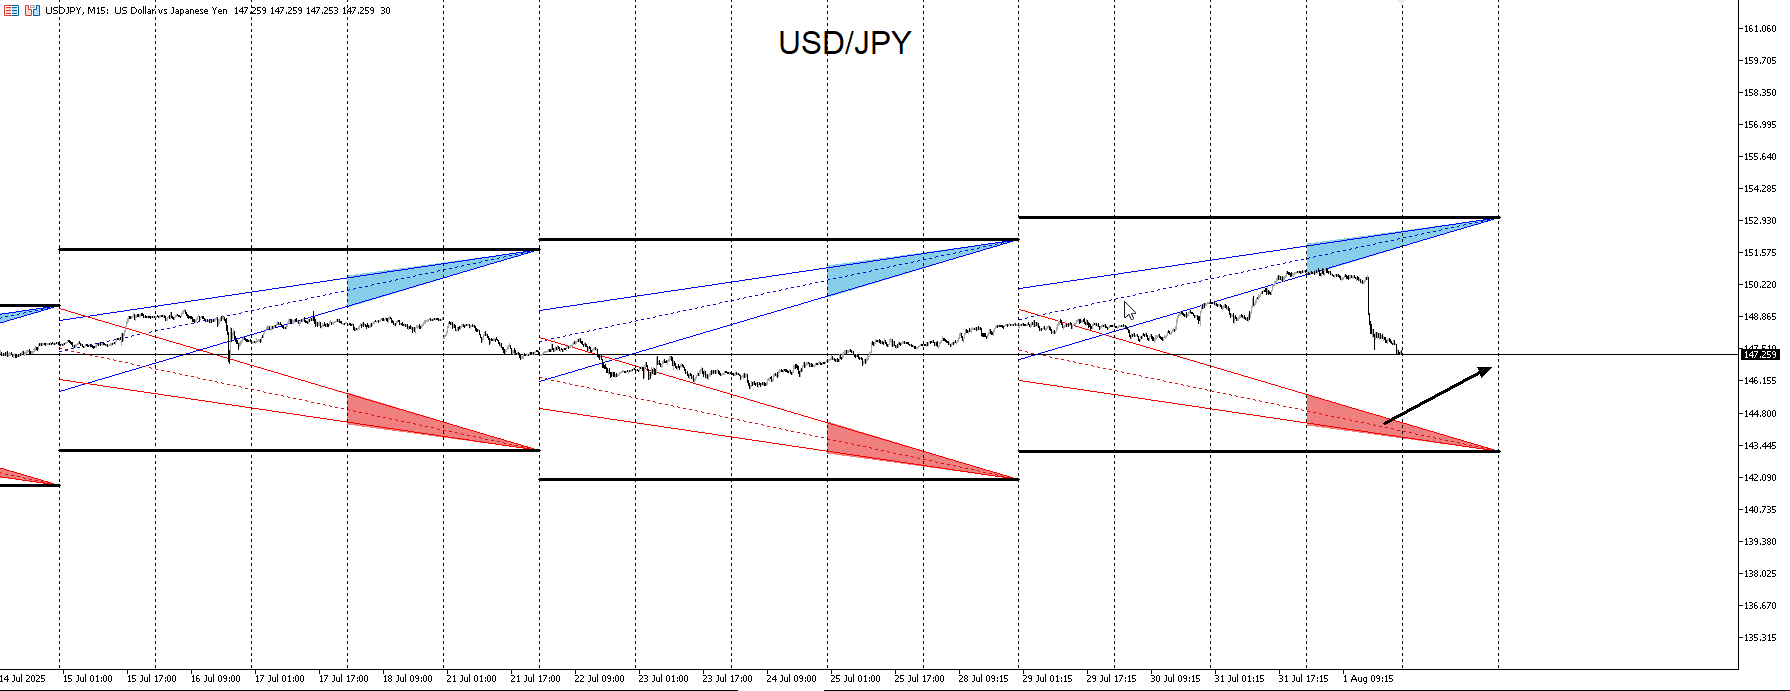
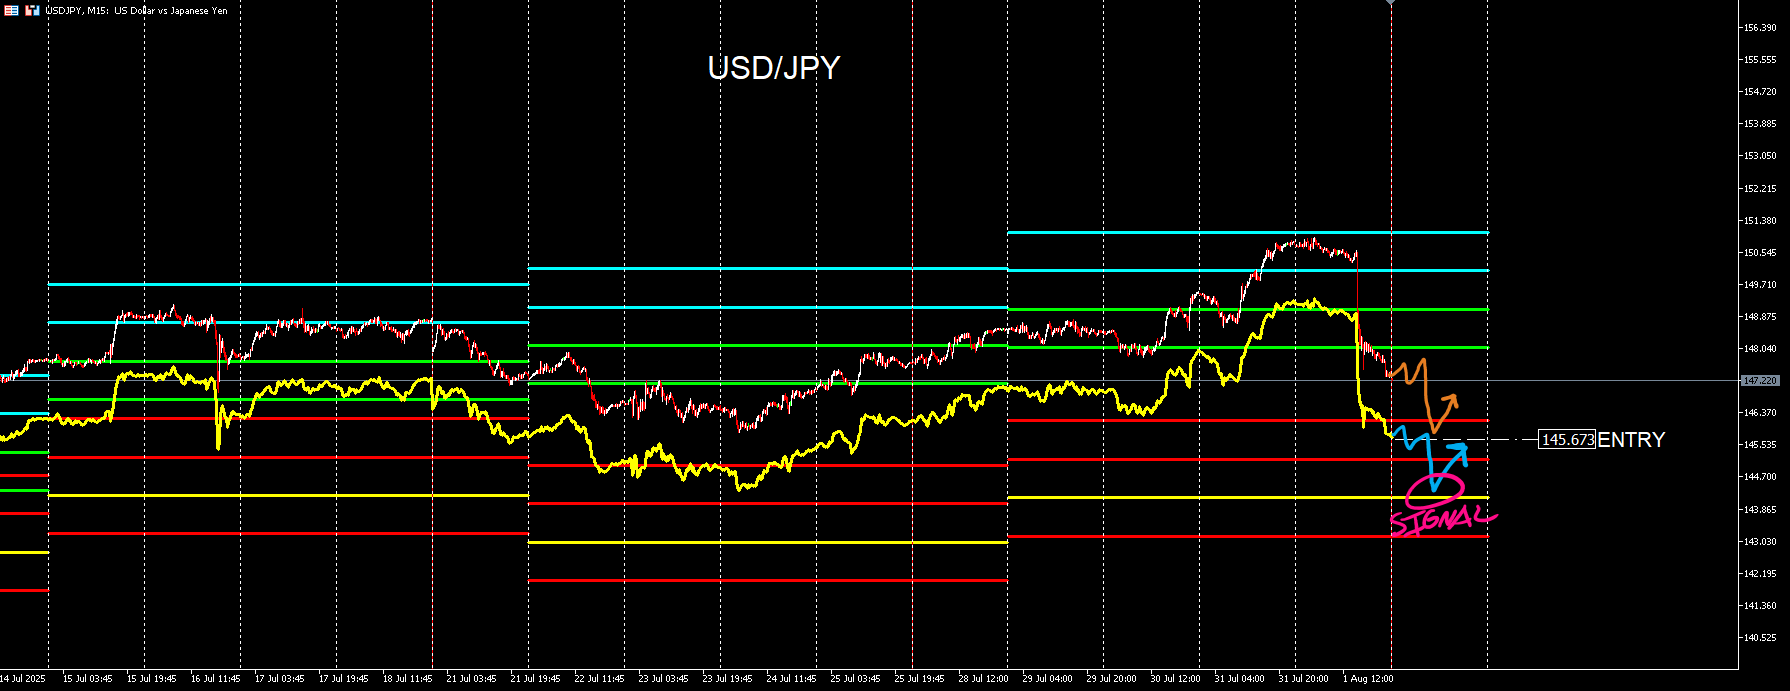
USD/JPY setup came later after the other Yen pairs. When price convincingly and consecutively reaches into these zones, I see that as an entry. I do think there will be some upside to follow. Not sure how much or for how long but if there is, this is a point where I want to enter.
-
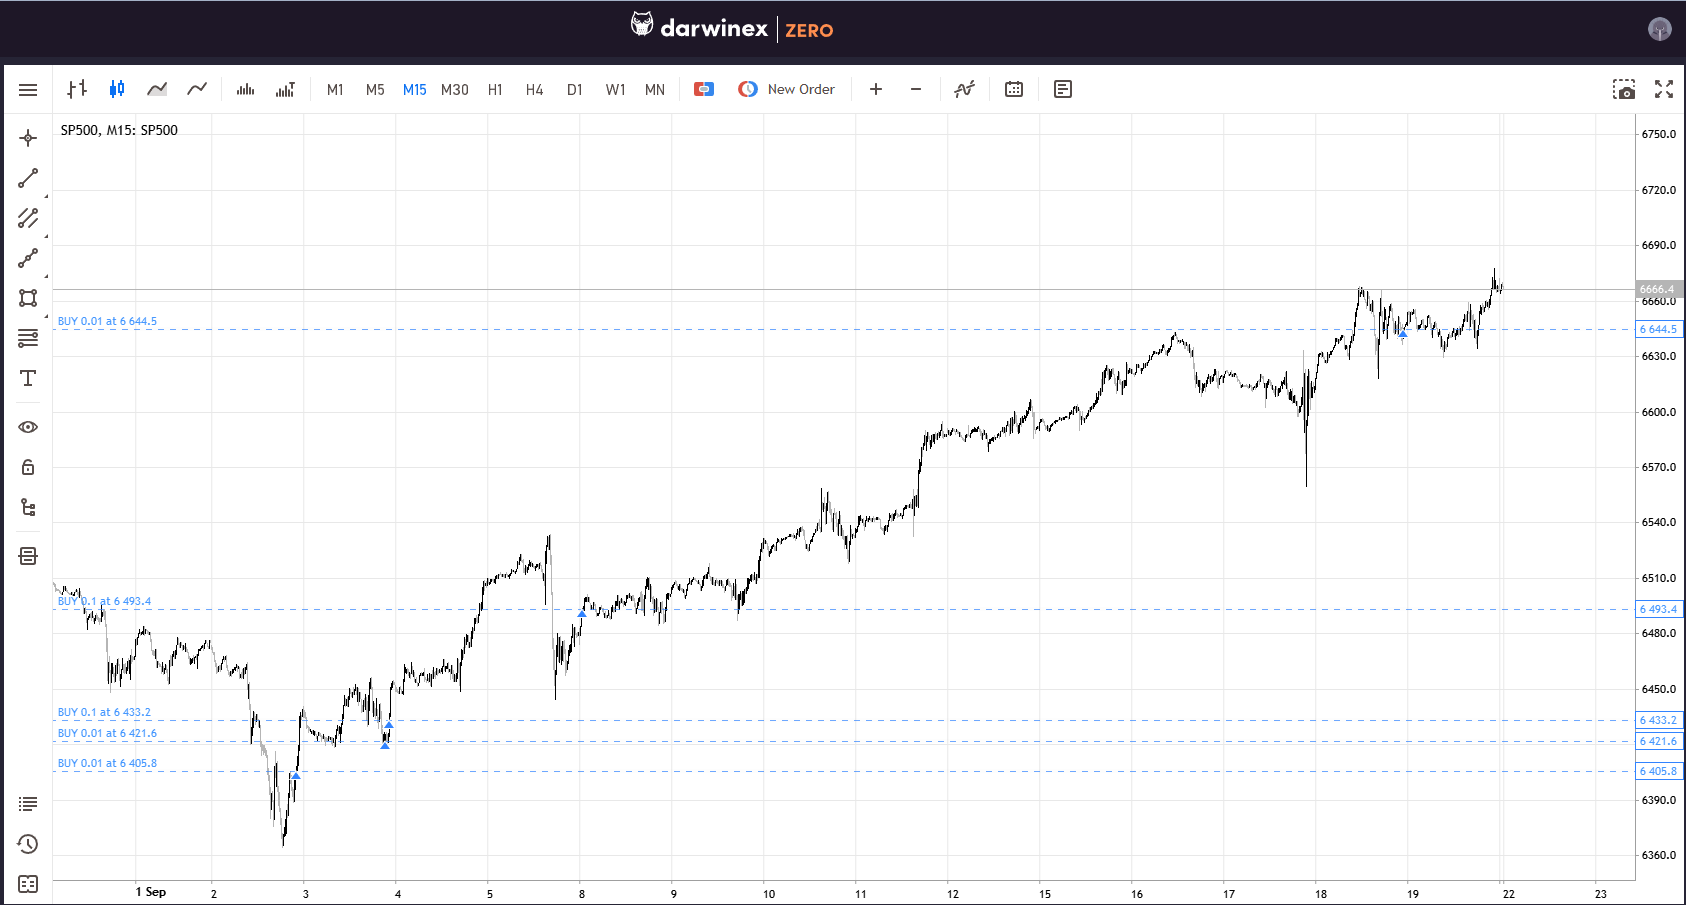
The Ribbon Template is also fitted for the SNP. I'll enter on this signal from what appears to be a low on the last trading day of the previous week.It's pretty rare when price gets here for the SNP and when it does, it's usually upside that follows. I'm also testing this out with options.

-
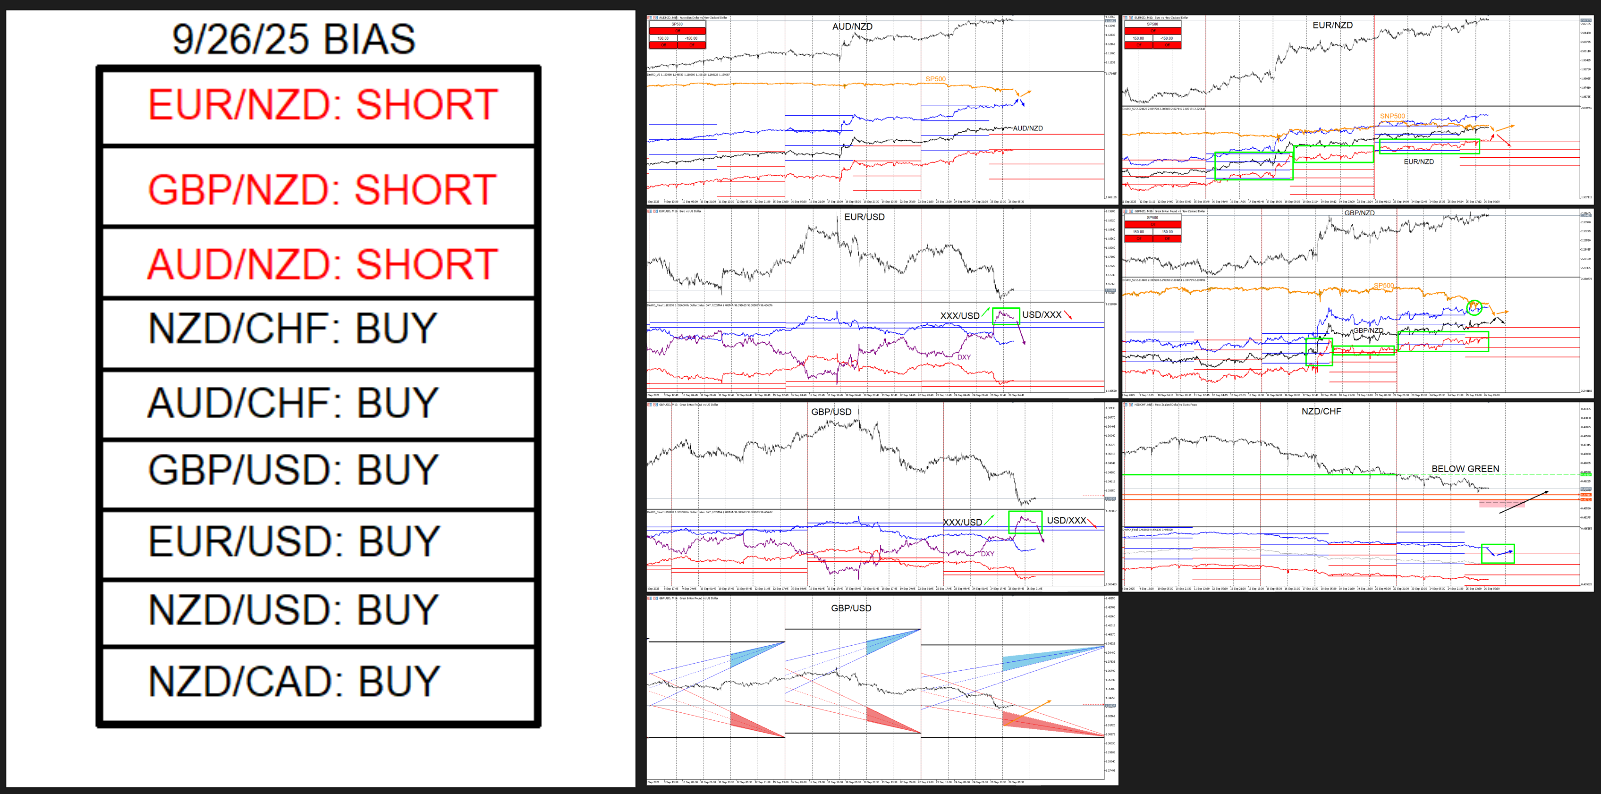
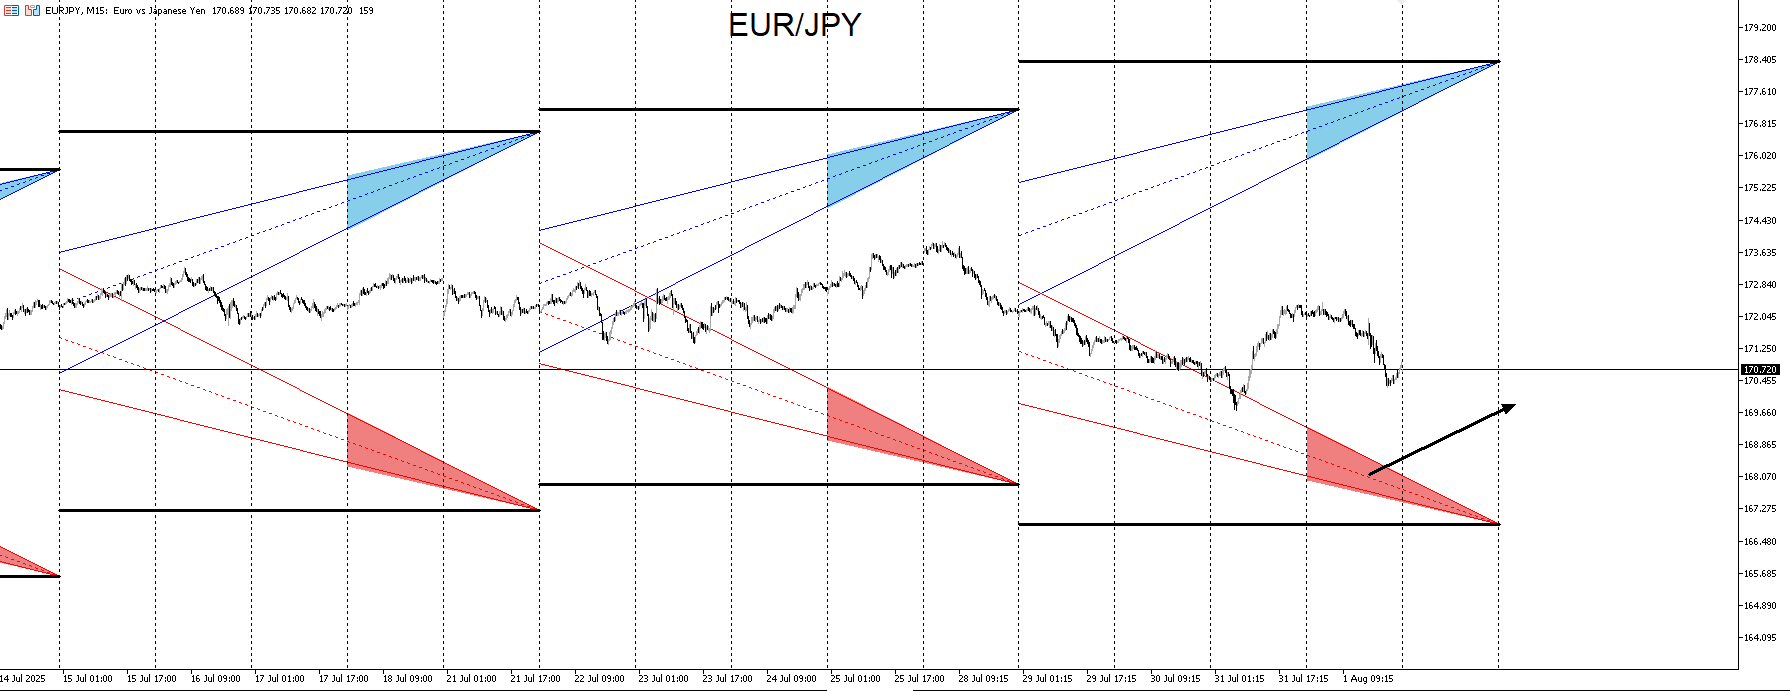
There are a handful of pairs that could possibly be a squeeze setup into a sell. For each of these pairs price is starting to extend beyond the green lines which is a sign of a reversal. A squeeze up within a short amount of time would be a trigger for me to enter with a sell stop after price trades at the top of the range. If not this still could likely be a top but price may range around these zones for a few days before turning down. Not sure what the likelihood for either scenario but I will be on the watch for both. In this example I'll use EUR/CAD. It has been pushing up but an extended push to the upside in Tokyo or London session, I see it as a blowoff. One thing for sure, I don't want to be a buyer in these zones.

Pairs with the same setup are
EUR/NZD
GBPNZD
EUR/AUD
GBP/AUD
GBP/CADWhatever EUR/CAD does, these pair will move pretty similar.

-
I'm taking a couple of entries and will explain my thought process behind them. This is more so a way of how I analyze price action and will utilize an EA for an entry. This is a pattern that I've seen play out while backtesting across multiple pairs and it's rare that it happens and is difficult to spot even after the fact. I'm taking this opportunity to document it live. If it doesn't play out as expected then that's fine but my hunch is pretty strong and the risk is low. This is an idea and I'm sharing it to demonstrate that I don't purely use EA's/Indicators. I use things in conjunction.
The idea here is to pay attention to 2 negative correlating pairs which I have stated in previous posts. For this example, EUR/GBP and GBP/CAD. Both pairs have very similar movement for 2 weeks. I look for a final similar push in the same direction followed by and obvious divergence. Once that divergence is clear, I look for a pullback within that area for an entry. Even though initially I don't buy at higher prices or sell after price goes lower, this is an exception and I keep my risk very low when doing so. GBP/CAD did drop with the recent pairs I just posted so my thesis is short anyway. That drop came later than I expected so I'll use this as an opportunity to short. I'm only using adaptive moving average and trendlines to visualize direction. There are not used for predicting or buying/selling a ''bounce''. Similar structure for negative correlating pairs is bound to diverge and the best way to spot it is to look for the obvious change and direction.


-
I will later post updates from this past week and what I am looking forward to. I've been working on my indicator to be able to finally put it on the market. I simplified it down for other users. Feel free to download the demo and test it out while everything is moving as well as look in the past. It's the DmRO indicator.
https://www.mql5.com/en/market/product/135841?source=Site+Market+MT5+Indicator+New+Rating006
-
The markets were pretty wild last week due to all the terrif news. There were a handful of pairs that I expected to squeeze up a few weeks back to enter on a sell. That push happened this past Friday and I did sell at the end of day. The last time this pattern occurred for these pairs were back in 2020. I am on this setup as short no matter what's going on in the news. I'm going to stick to my system and the hard work that I put in to build it.
Using the DmRO Indicator, the negative tracer is extended well beyond the positive levels. It's safe to assume that the more buyers that buy in on these levels, the less likely they will be rewarded. There still may be room for bullish momentum. I think that it may be short lived.


One particular setup I'm on the lookout for is AUD/NZD.
The positive tracer has entered into the negative levels which rarely happens. I won't enter until there is a break of that lowest point where price was at the time. It could be a week. I do think that there will be upside to come but a better entry will be later when price gets underneath that zone.
-
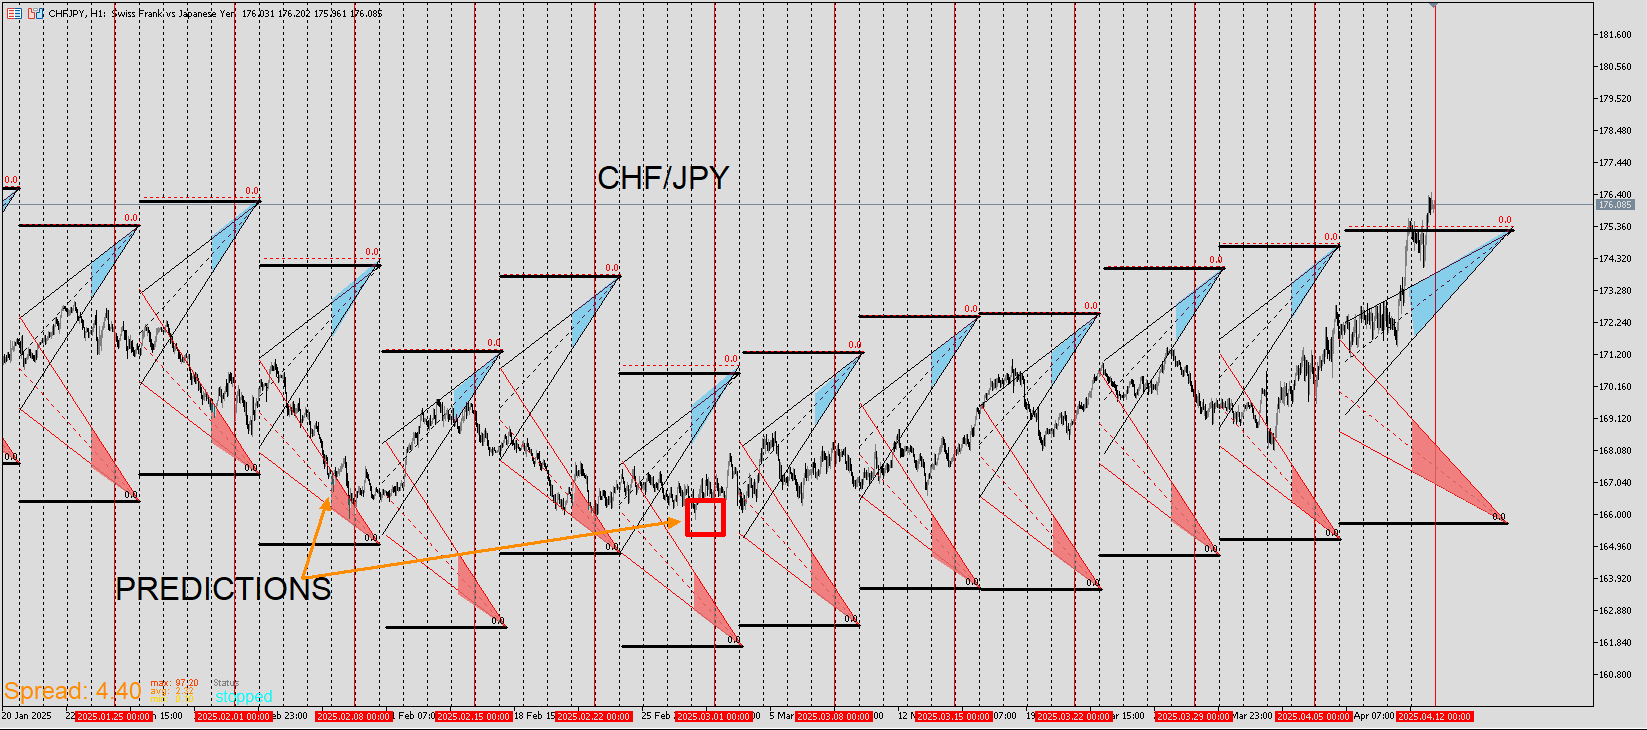
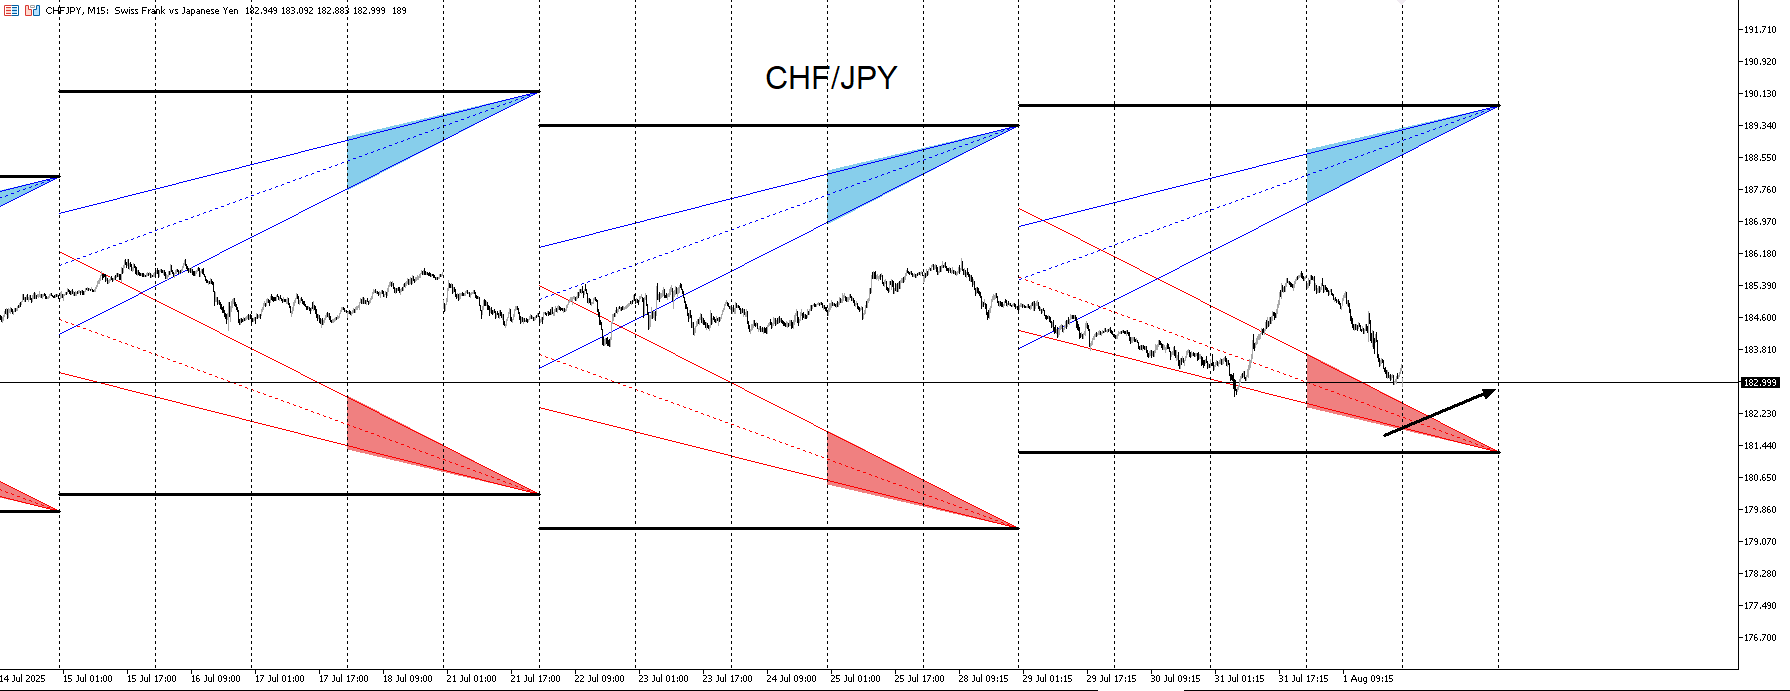
Here I'll show the CHF/JPY Projection from a while back.
-
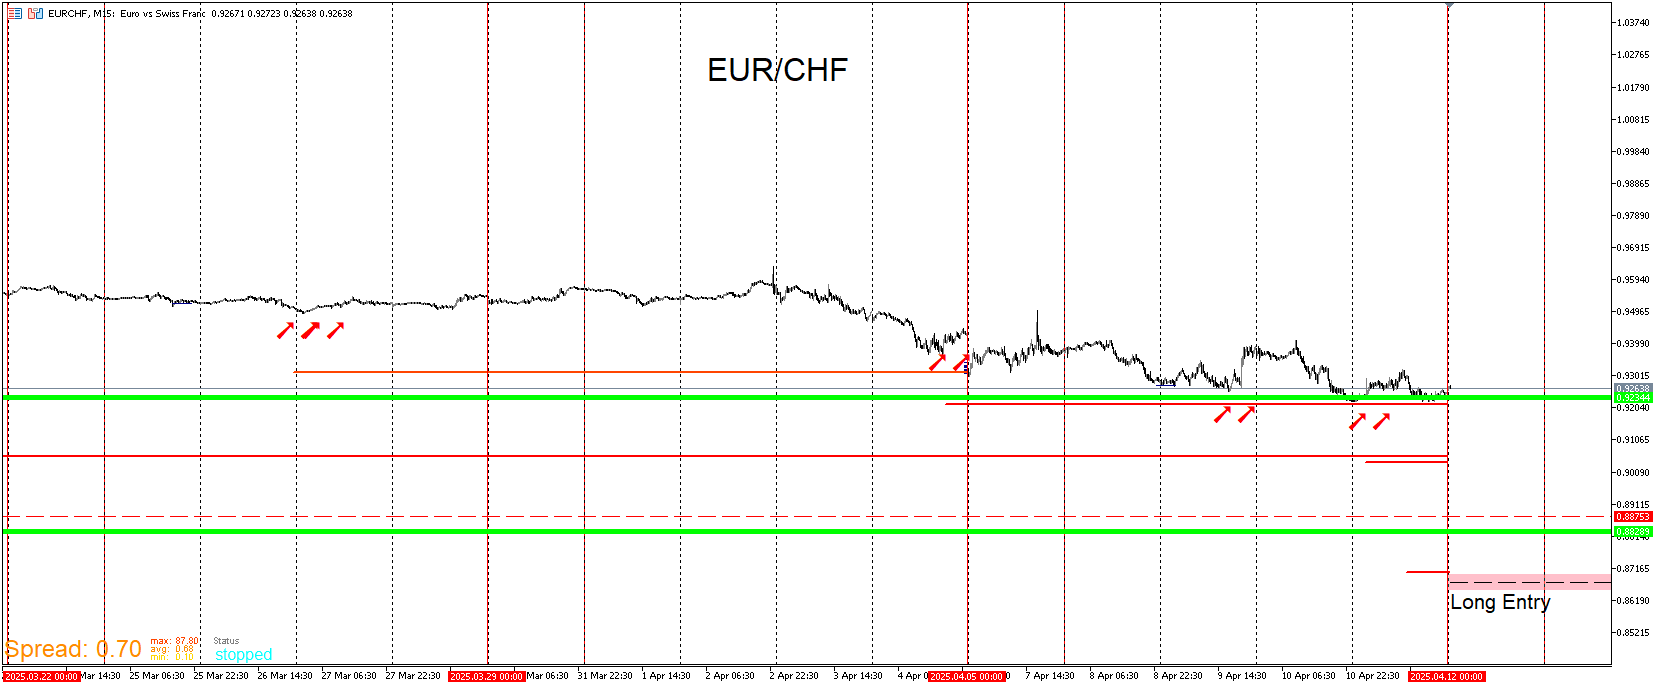
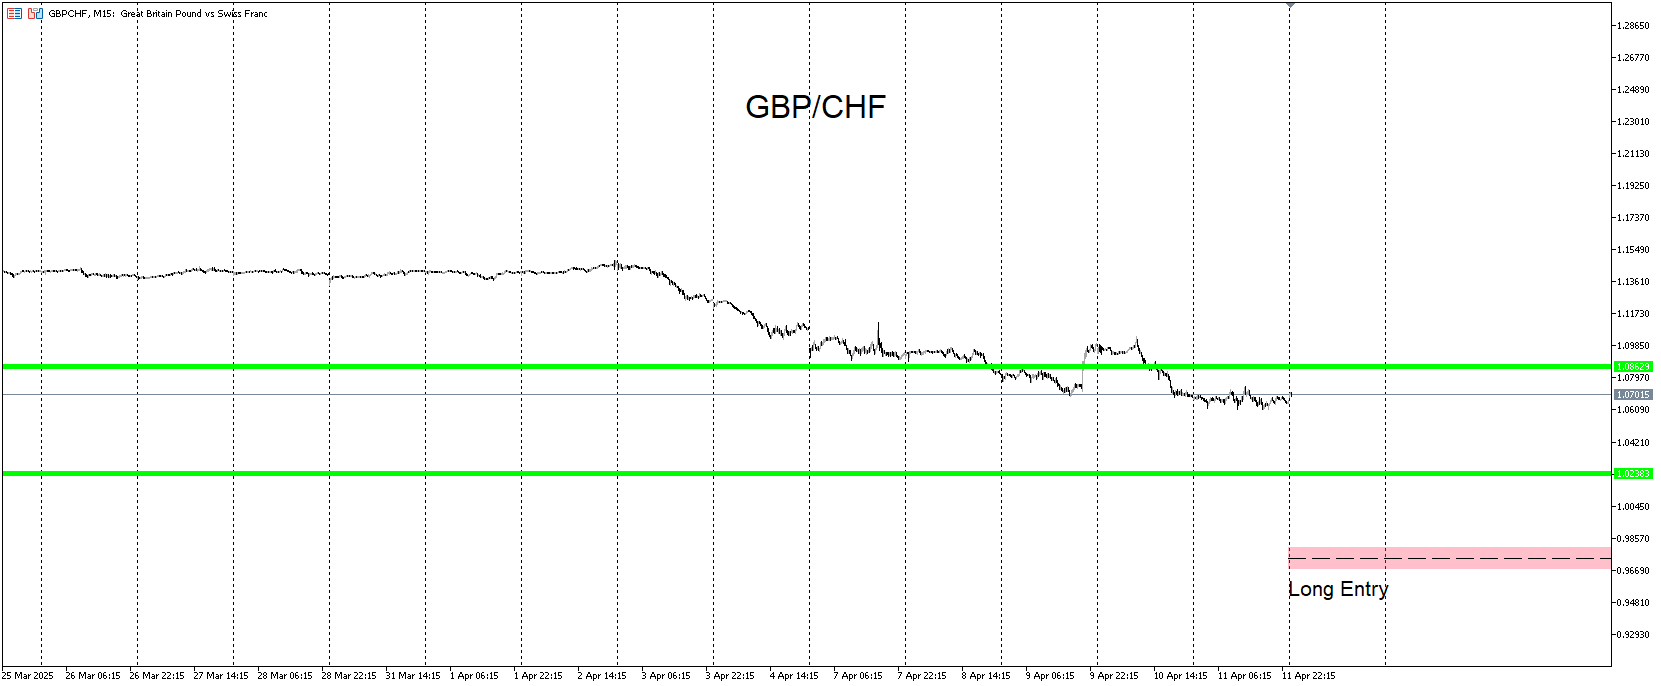
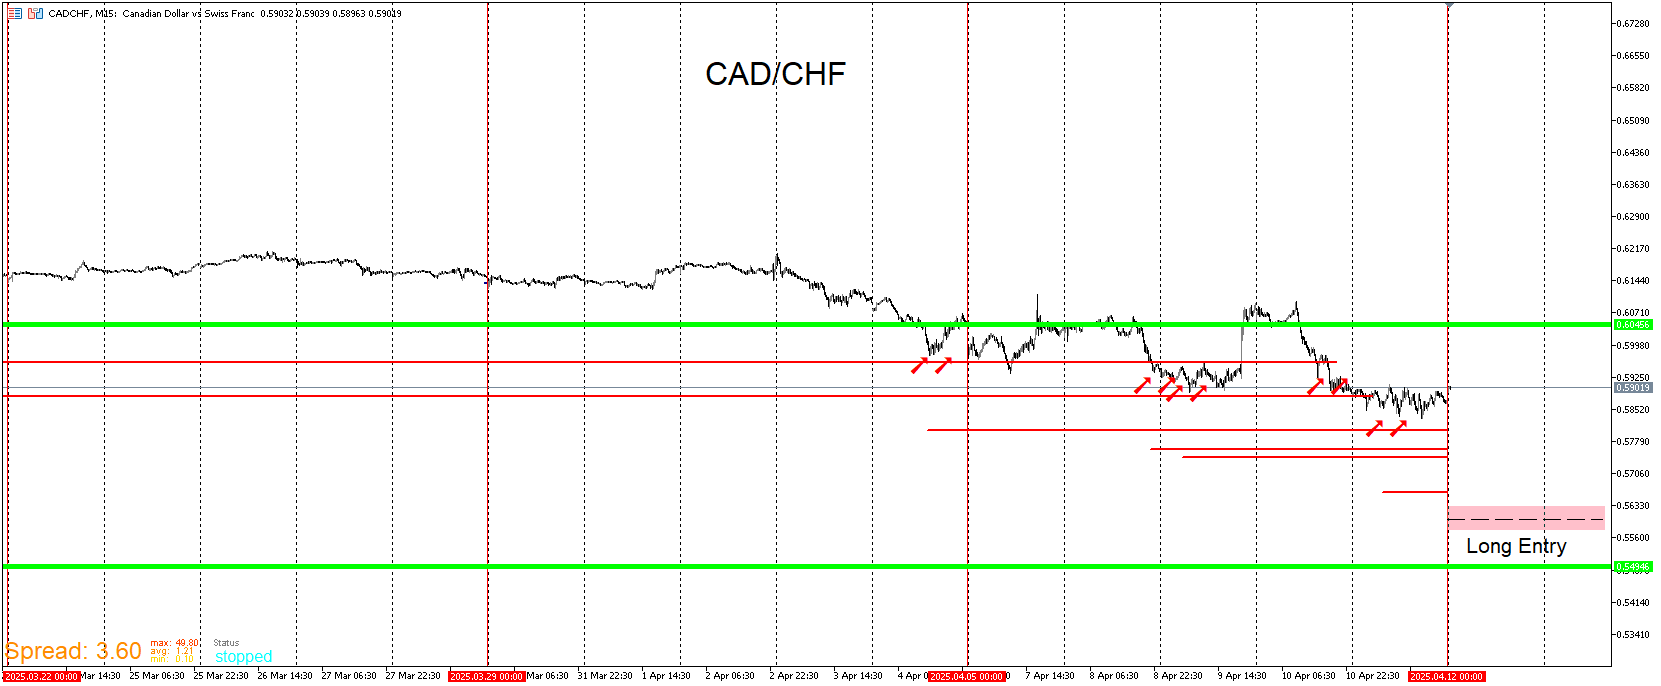
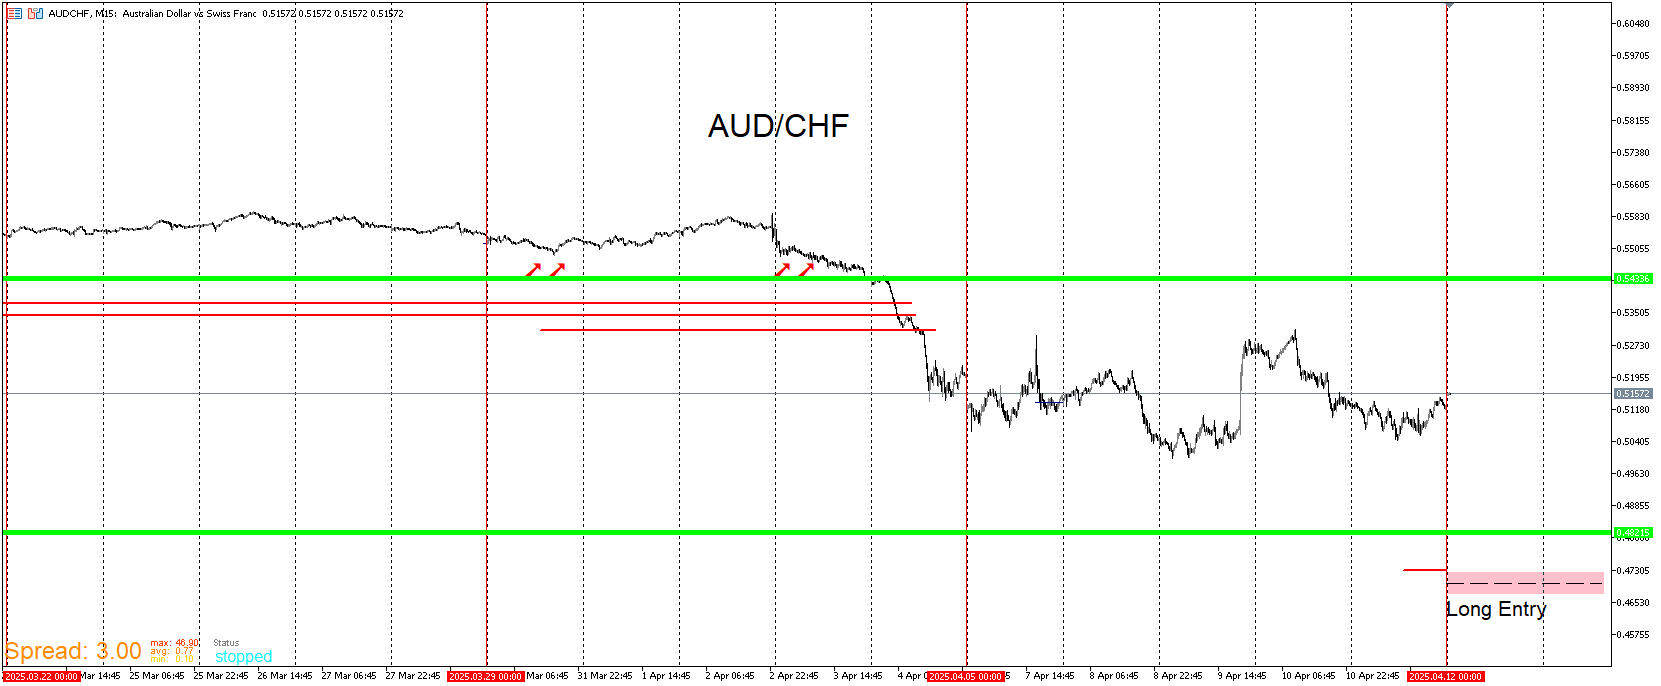
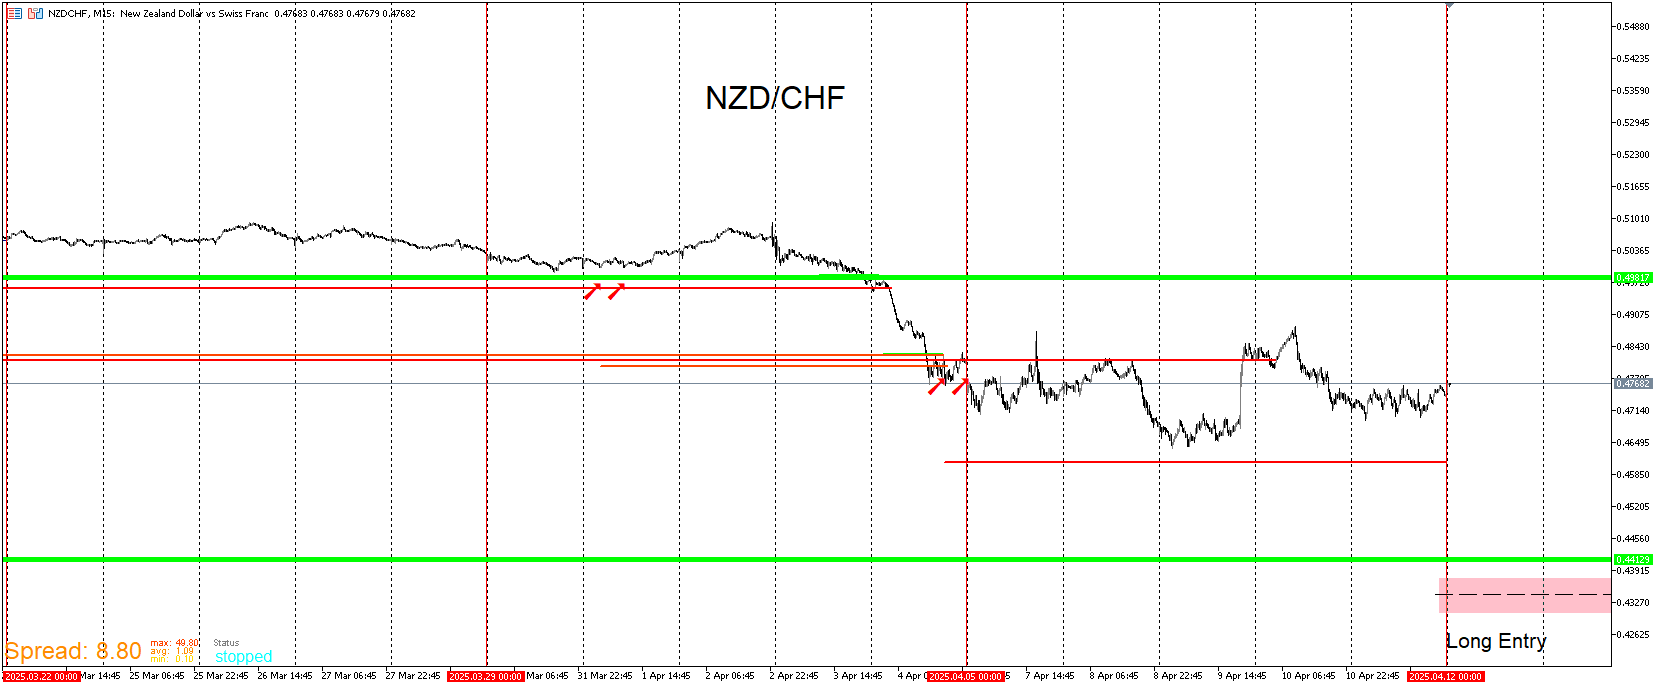
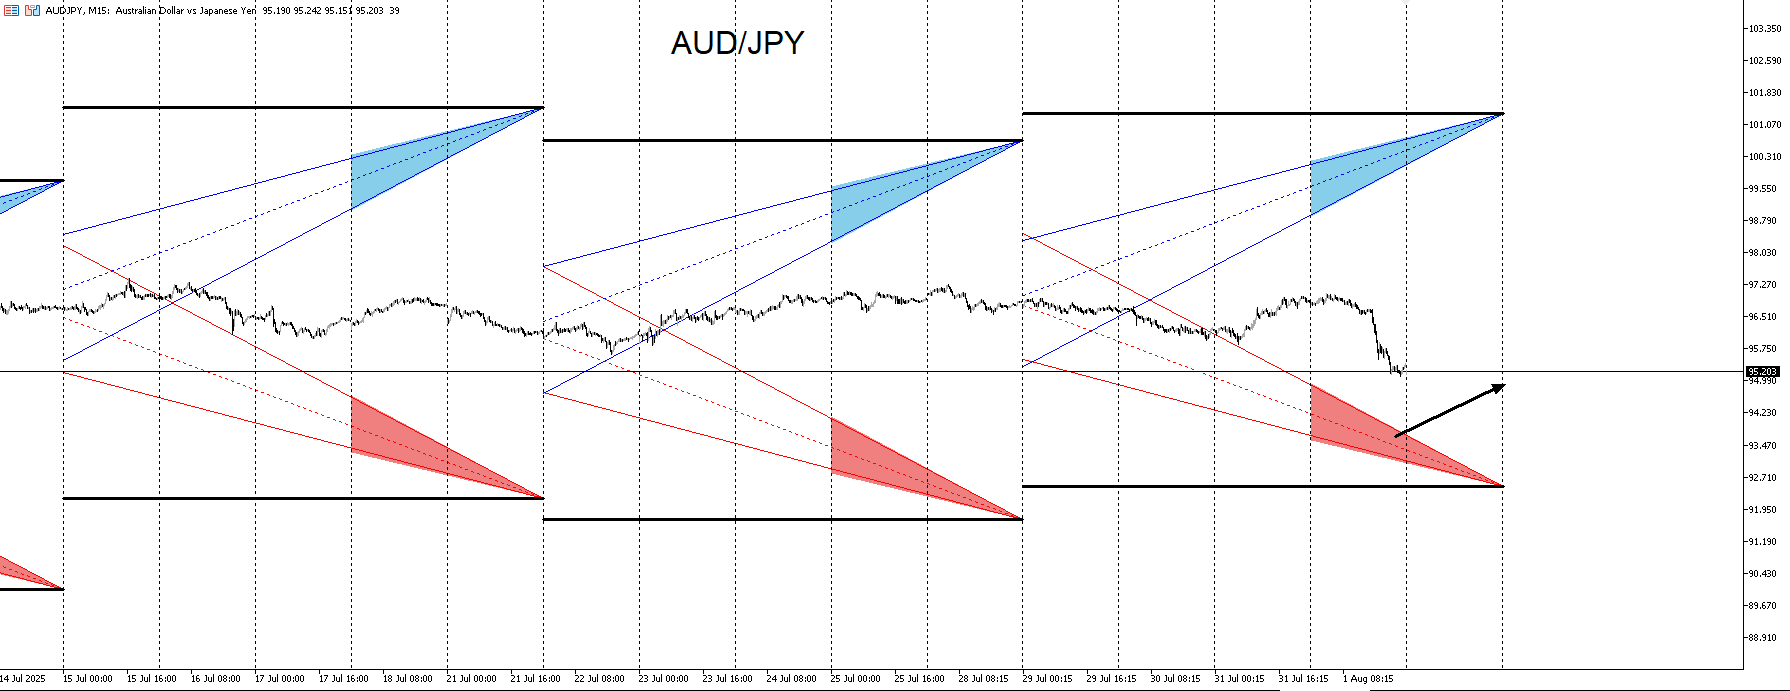
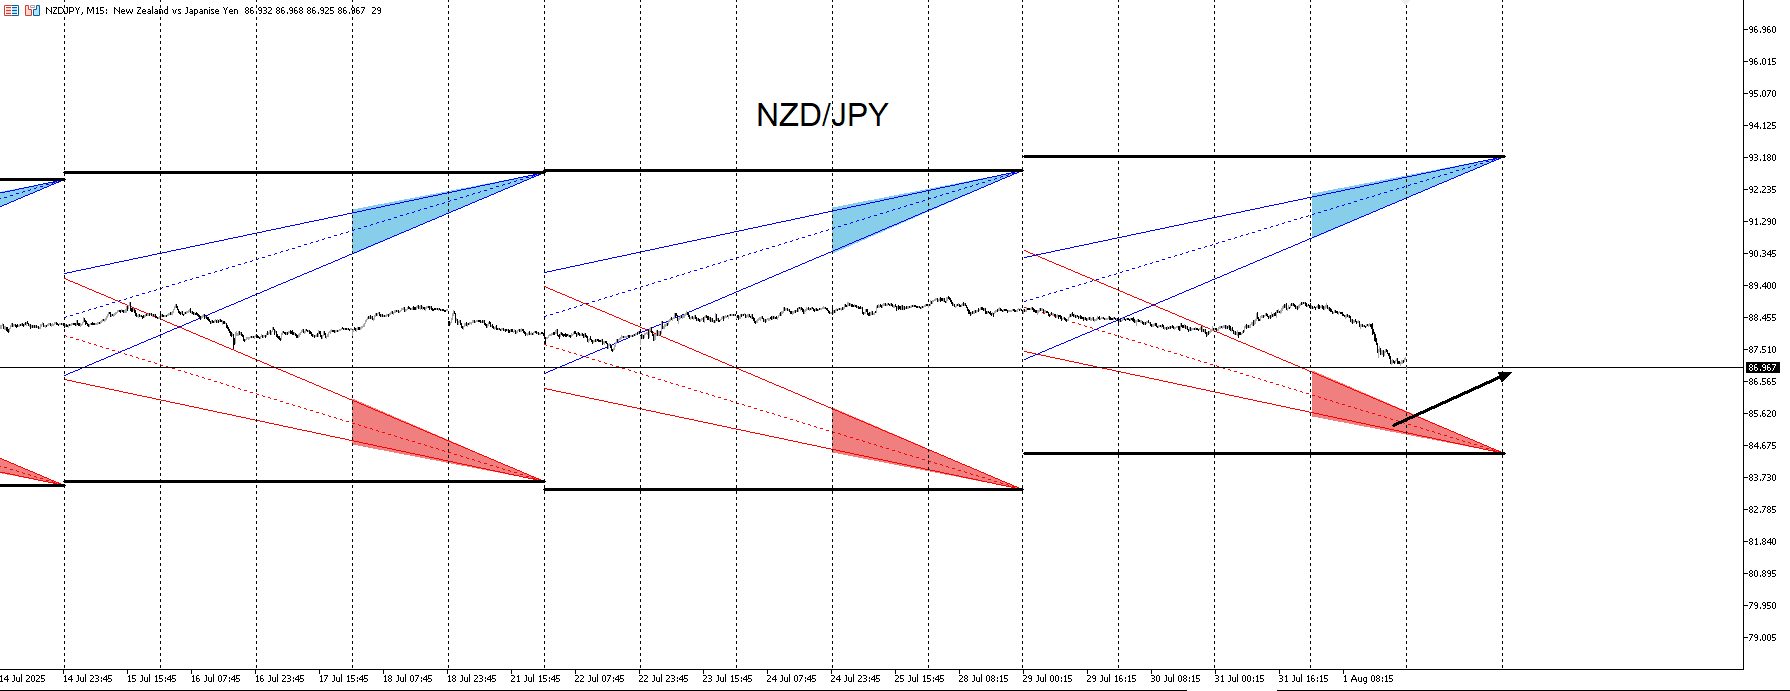
I will be paying attention to the Swiss pairs this coming week. There is a possibility that price can flush down a good ways and if it does, these are about the levels I will enter. It's not a prediction that this will for sure happen but if it does, I'd rather be prepared for it. I think it's more likely for price to reach these zones over a period of time but if it gets down there in a perceived crash, I would prefer that. The bottom most green line is the area that represents the furthest price extends into before turning. Their all well below the first level except the EUR/CHF. That zone is the first step in my analysis because every trend that holds up for months start in that zone and even better when it spends time there and digs for a bit. I will also be utilizing the Interest lines which are the red line. I aim for the bottom most one. I haven't been using this template but it serves for this type of setup if price pushes aggressively. It helps give a general area for the best entry.
Not all pairs generate it but it definitely helps to have overall.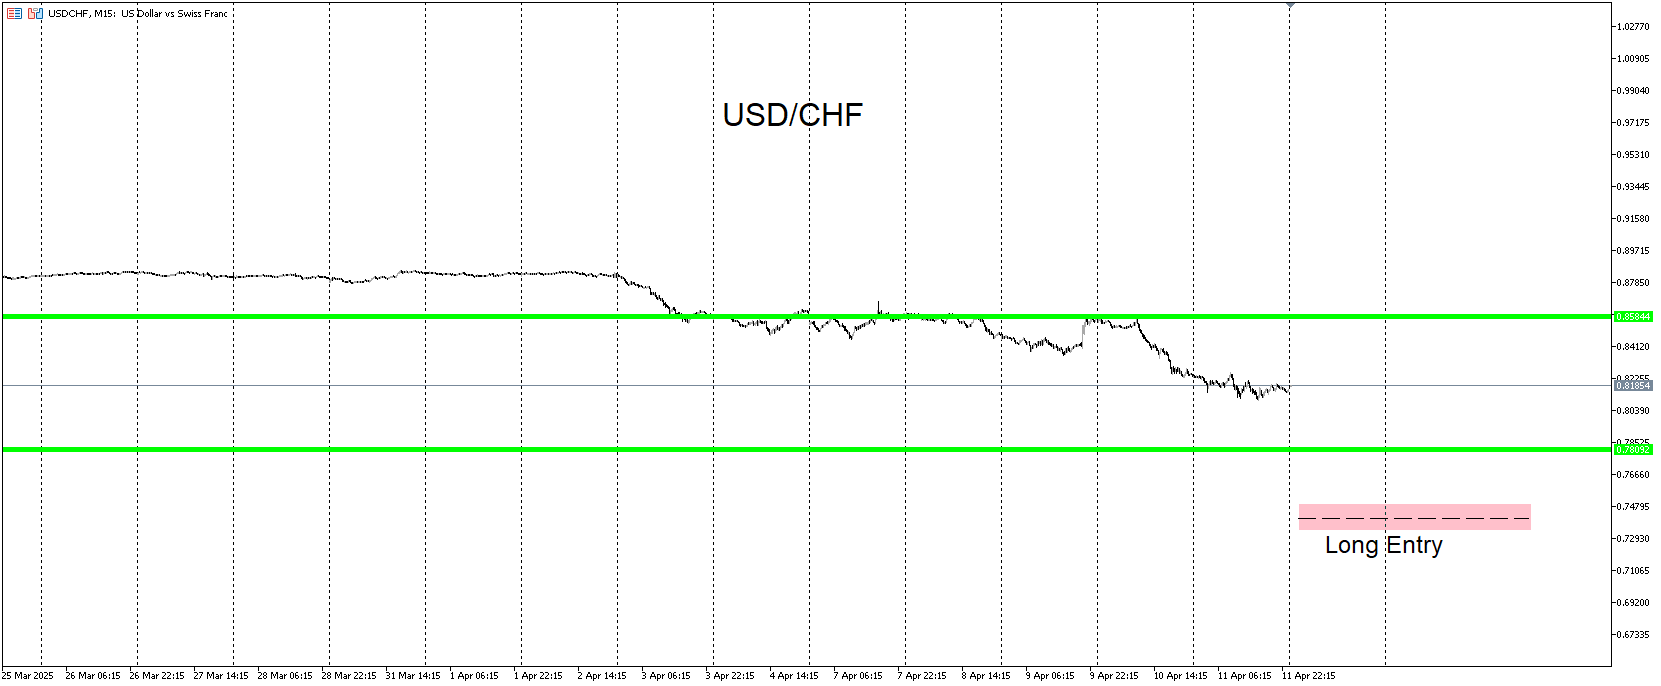
-
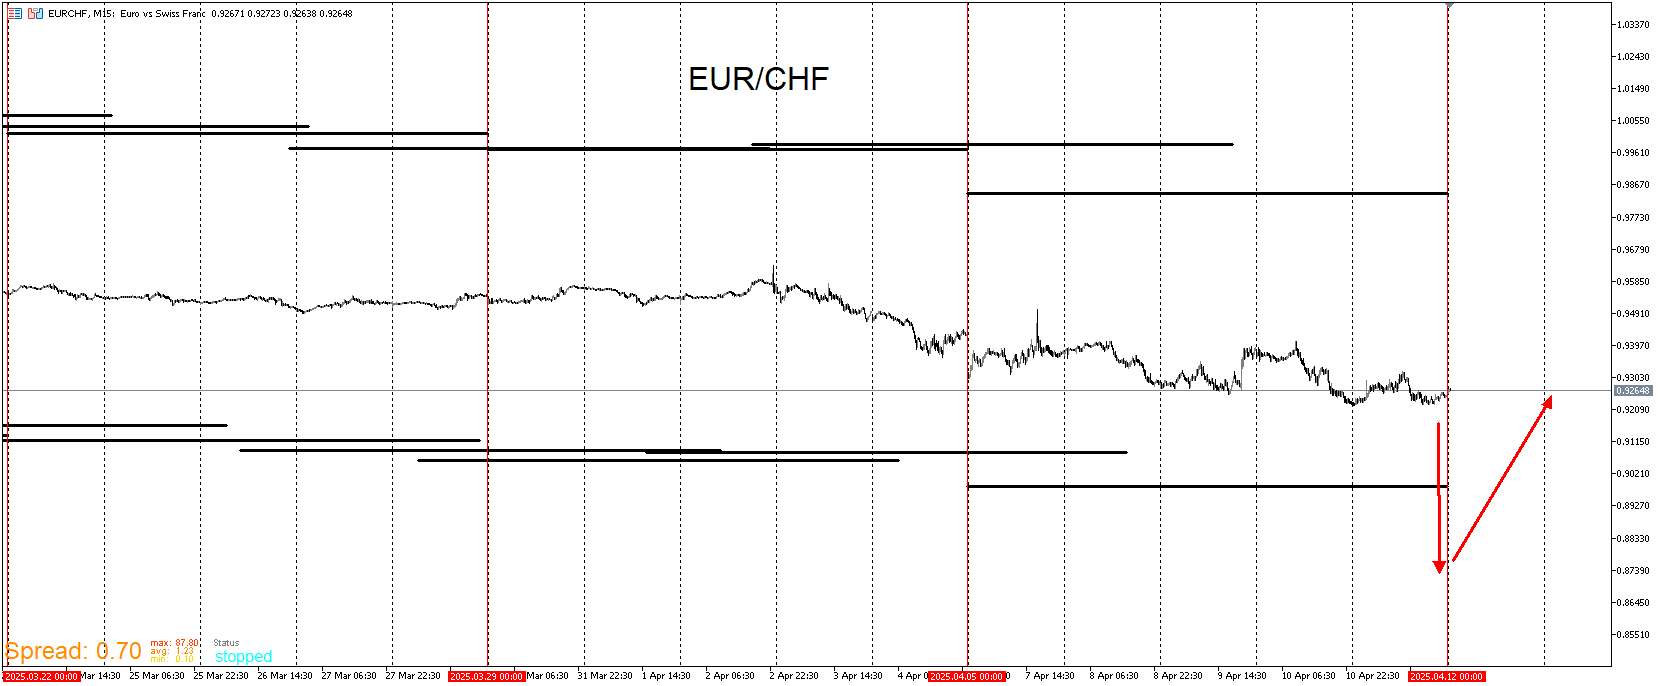
One thing I am looking out for is the Wall Template for EUR/CHF. What I've noticed from backtesting is that price very rarely extends to the wall. Maybe once going back 10 year. It usually reverses between 60-300 points shy of it. Price is around the 250 point range. If there is flush through it, that would be a trigger to enter. I don't think it's likely to happen but I'll take it if it does. Even if the other pairs trends up first, I believe that this pair will trade well below the EUR low that was made on 11/22/24. That could occur over the course of a few weeks but I'll be on the look out for it and will look for that 60- 300 point distance then and even better if the DmRO indicator confirms.
-
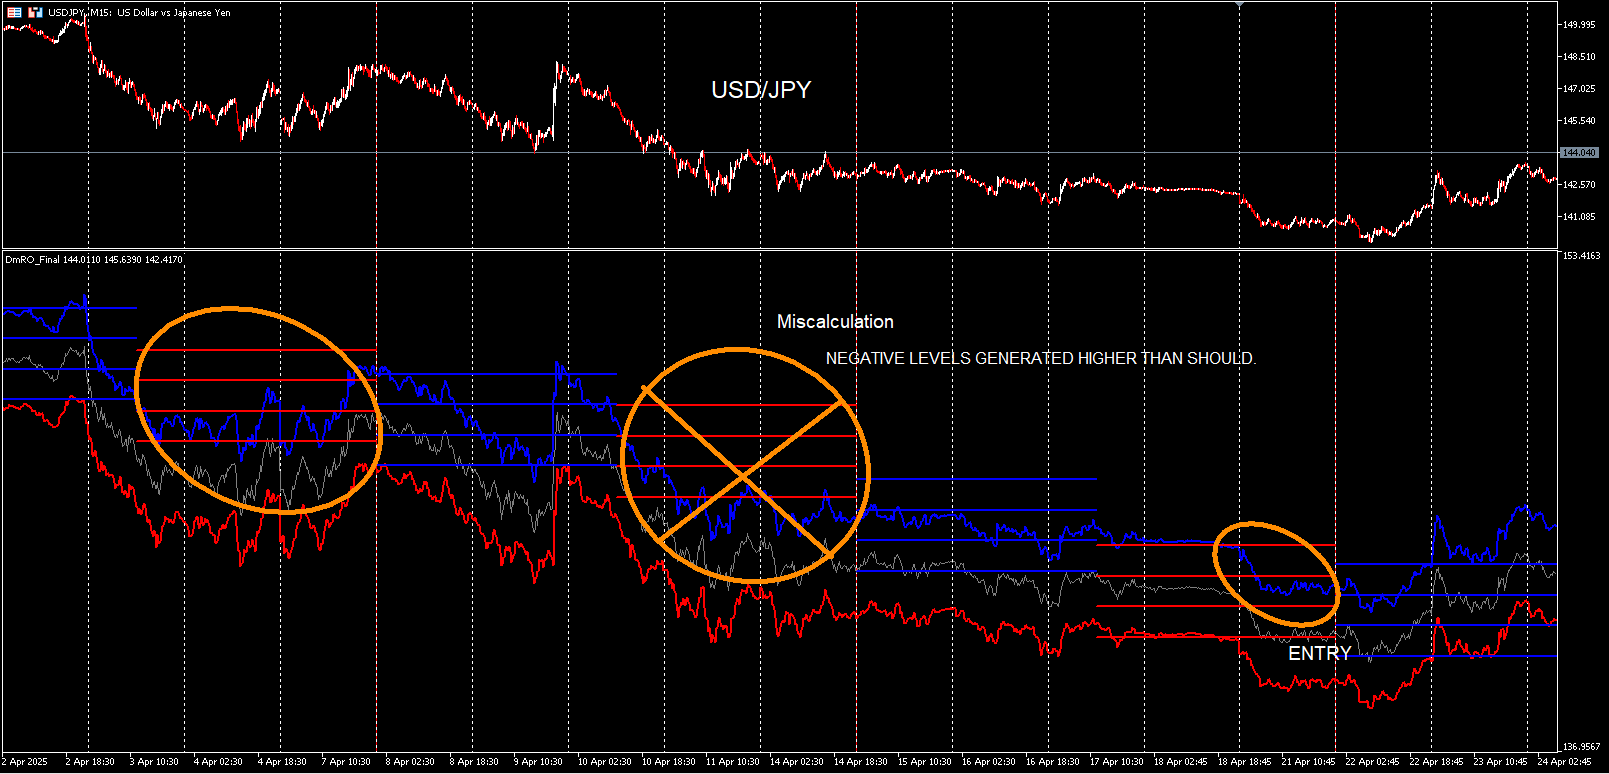
I I took an entry on USD/JPY on a similar setup of the 3 consecutive hit of the Ribbon zones. This occurred over the course of all the news with the tariff debacle. Though I don't engage in the market as news is most extreme, I will let things fizzle out a little before getting in and if I see a setup, I will take it. I don't follow nor care to really get into the meat of what conclusion world leaders will come to with issues. If it's good news and the pair is projected to go long, This is where I want to be. If it's not so good, this is still where I want to be. Either way, it doesn't matter. There was a miscalculation with the DmRO on the one of the segments of negative levels. When compared to my EA, they printed higher but it's not by much though. Just something to be mindful of in the future. I only tend to post live entries or predictions but I'll make an exception in this case because I actually took the entry. I also do trading competitions no BullRush and refrain from posting live entries. And I do quite well in them when my signals come up within the timeframe btw.
-
Back with an update. I am officially done with my DmRO and Ribbon indicator. They will be available soon once I complete the guide. As a show of gratitude, If anyone is interested, I can send the tools with a 3-6 month trial period meaning that once it's plugged on a chart, it's yours for that time period. Plus it would be great for feedback. Also I will make a few more posts in here regarding updates on the indicators but I don't want it to be mostly signals. I have a substack for my ideas now and you will find it here. https://justin15012.substack.com/ I may post a couple more ideas here but this forum should be for learning. I would like to thank all those who created and keep this platform running as well as those who engage because this isn't easy to learn. Still the best platform out of all the other stuff out there by far. Feel free to reach out to me if you'd like to test out my creations.
-
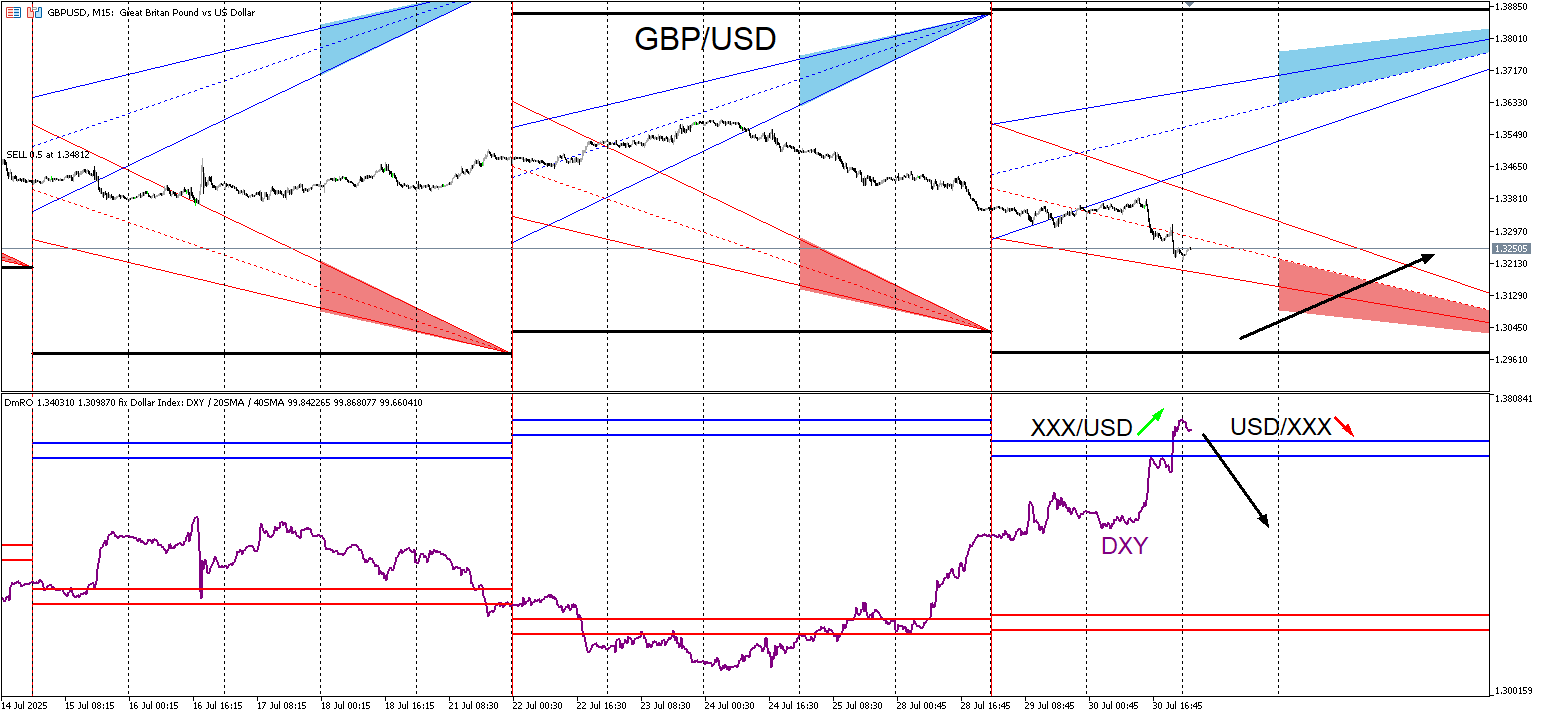
Here is one entry I’m taking using the indicators. The DmRO indicator is modified with the levels adjusted and the DXY is overlayed on top. The idea here is to see where the purple DXY line is at within the indicator. If it’s near or above the positive blue levels, its a sell signal for USD/XXX pairs and a buy signal for XXX/USD pairs. If it’s near or below the negative red levels, Its a buy for USD/XXX pairs and a sell for XXX/USD pairs. For this case price can go lower while the DXY is above the positive levels so I am only accumulating small positions at the start of a probable uptrend. This pair has been trending up for a while and if it’s going to continue, I see this as an optimal zone to hop back on it given the time and what the indicators are showing. There are other pairs that I’m entering in on too but this one is the only one I had time to do a write up on.
-
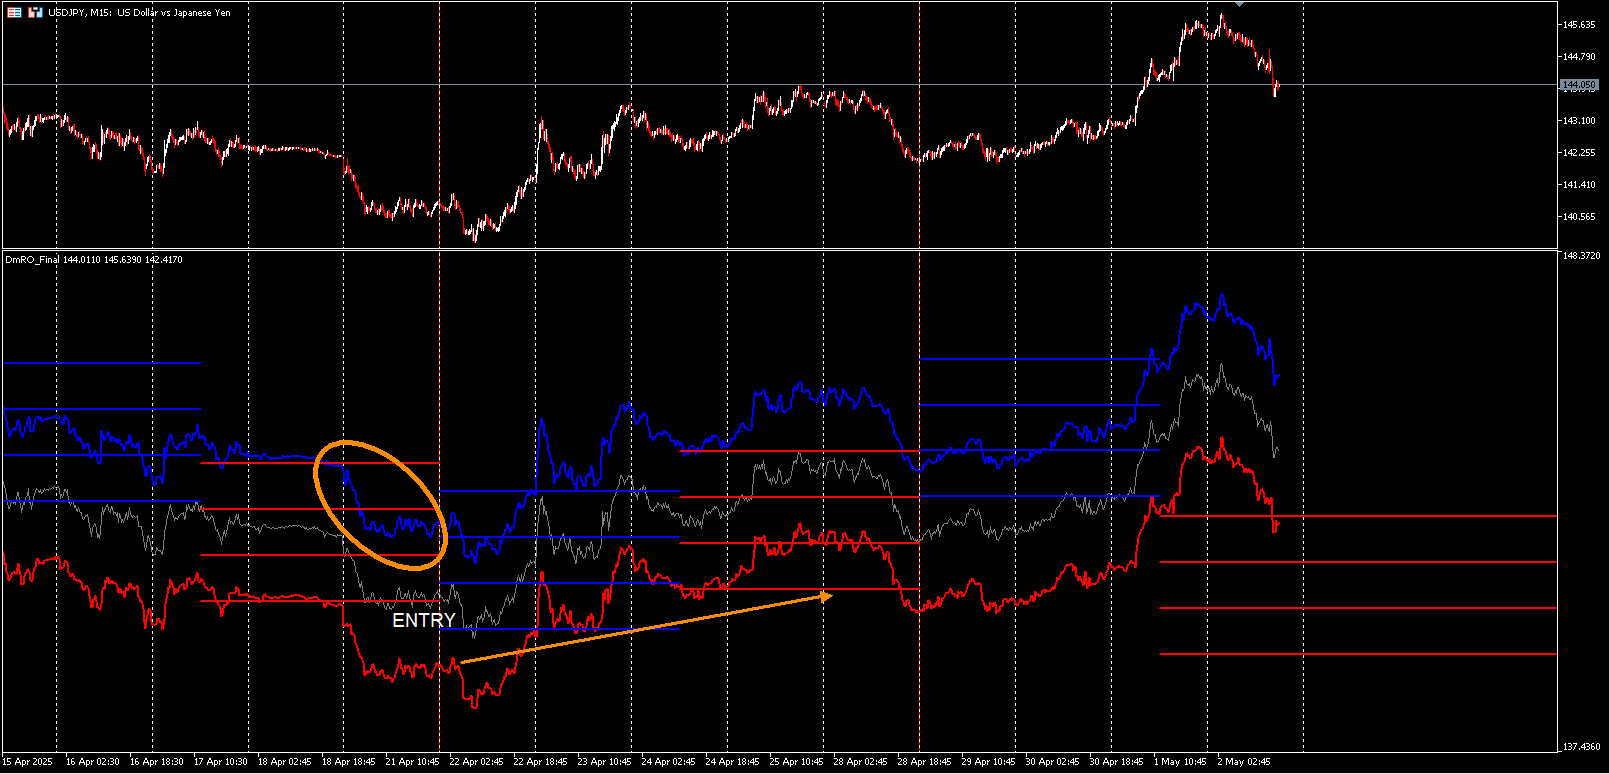
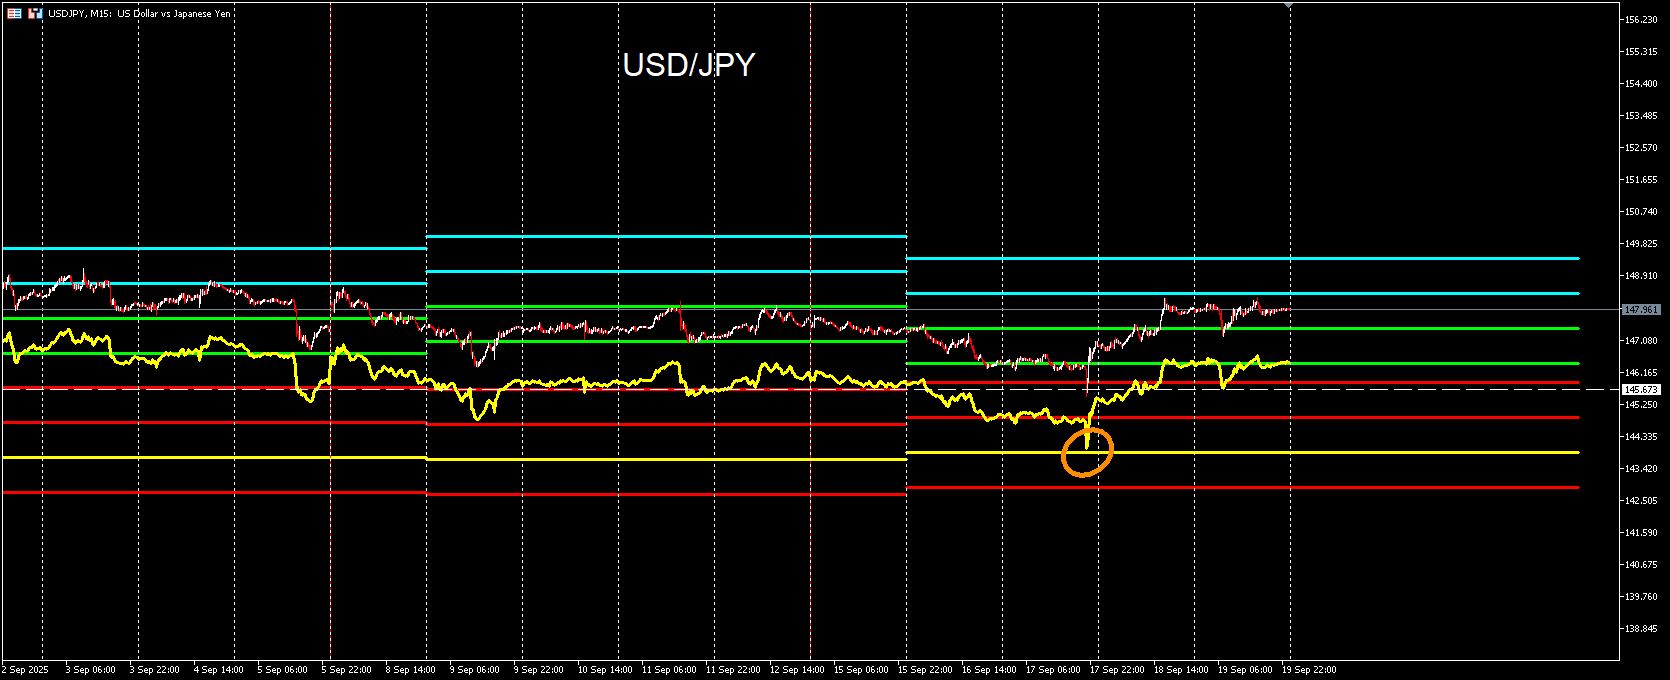
For this coming week I’m getting long signals on the Yen pairs. GBP/USD signaled long too and came just shy of my limit order before pumping up. Knowing that these pairs may continue their uptrends, this is where I want to enter and I’m looking forward to XXX/USD pairs to continue lower and move upwards once the Yen pairs start to consolidate after upward movement. If Yen pairs do continue up, I don’t expect them all to continue up. Maybe a small handful will but I would expect AUD/JPY and NZD/JPY to likely consolidate more and drop lower before continuing up. The USD/JPY chart with the black background is the indicator modified to display it in another template that I use. If I suspect the market will keep trending up, I will want to enter when that yellow tracer contacts the yellow line.
-
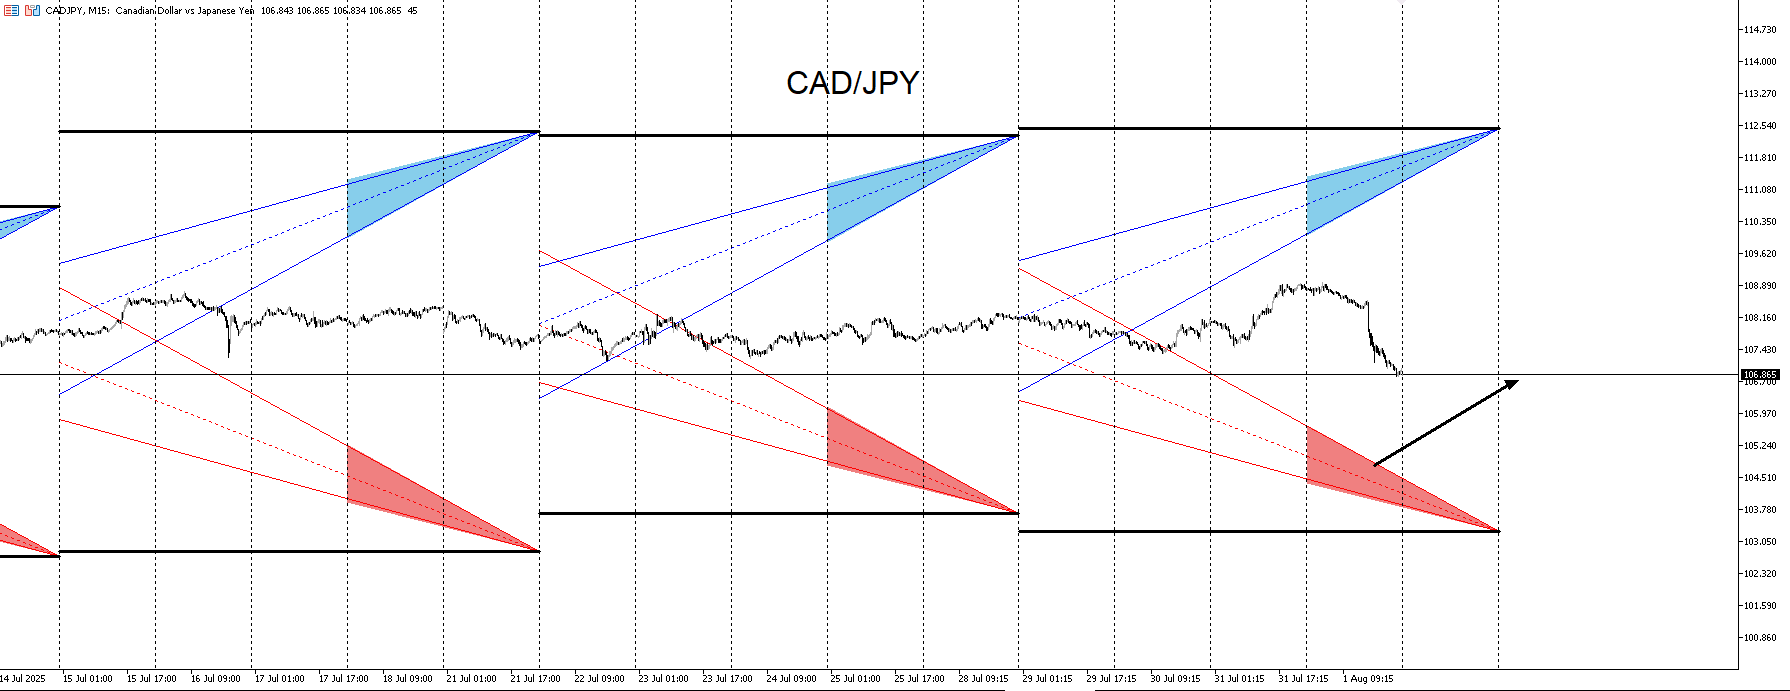
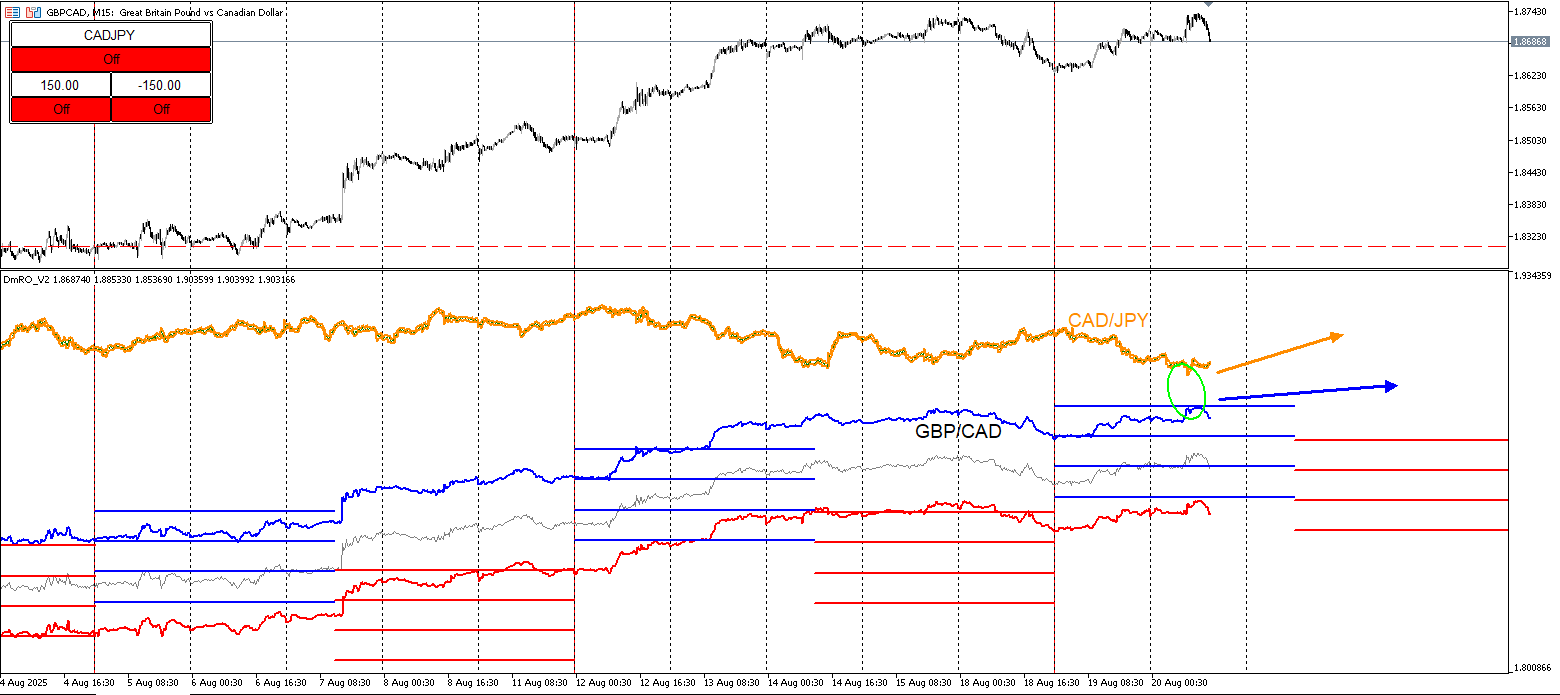
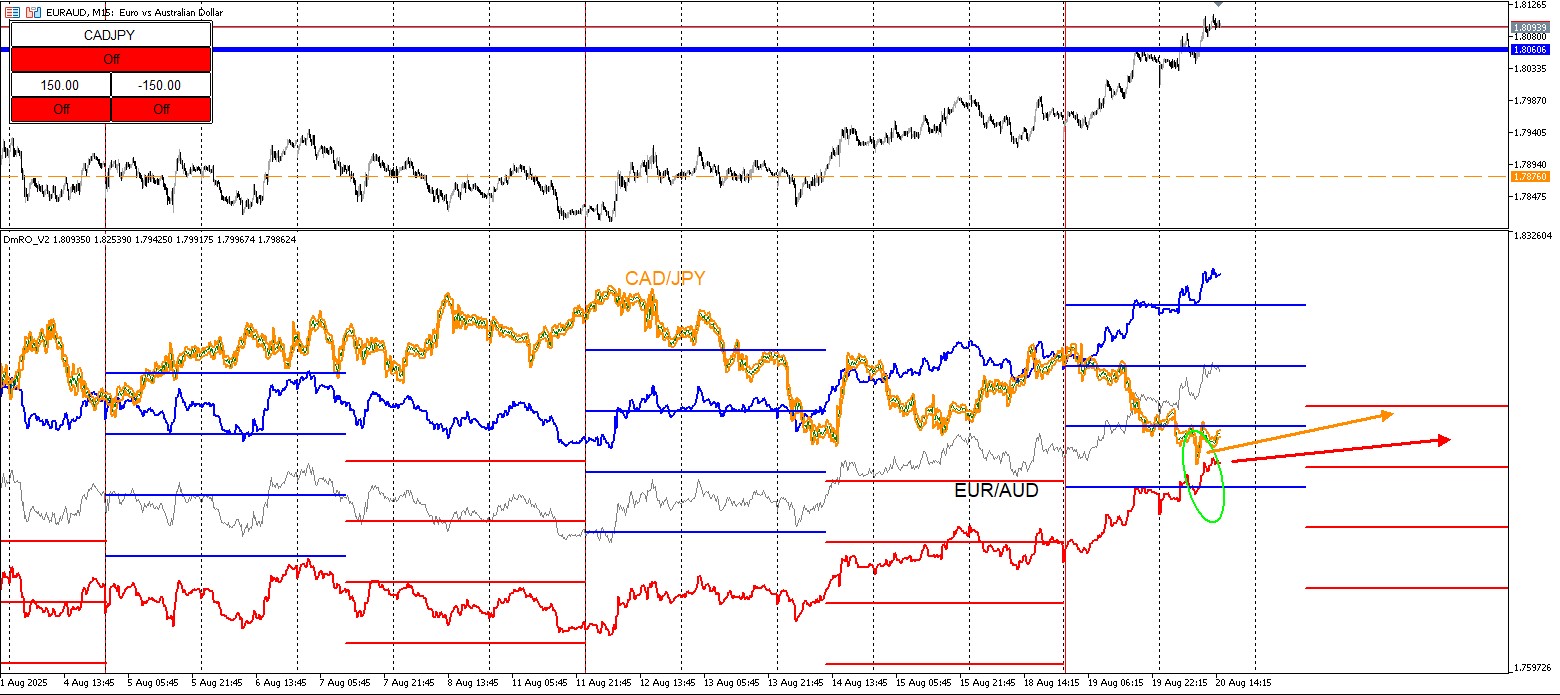
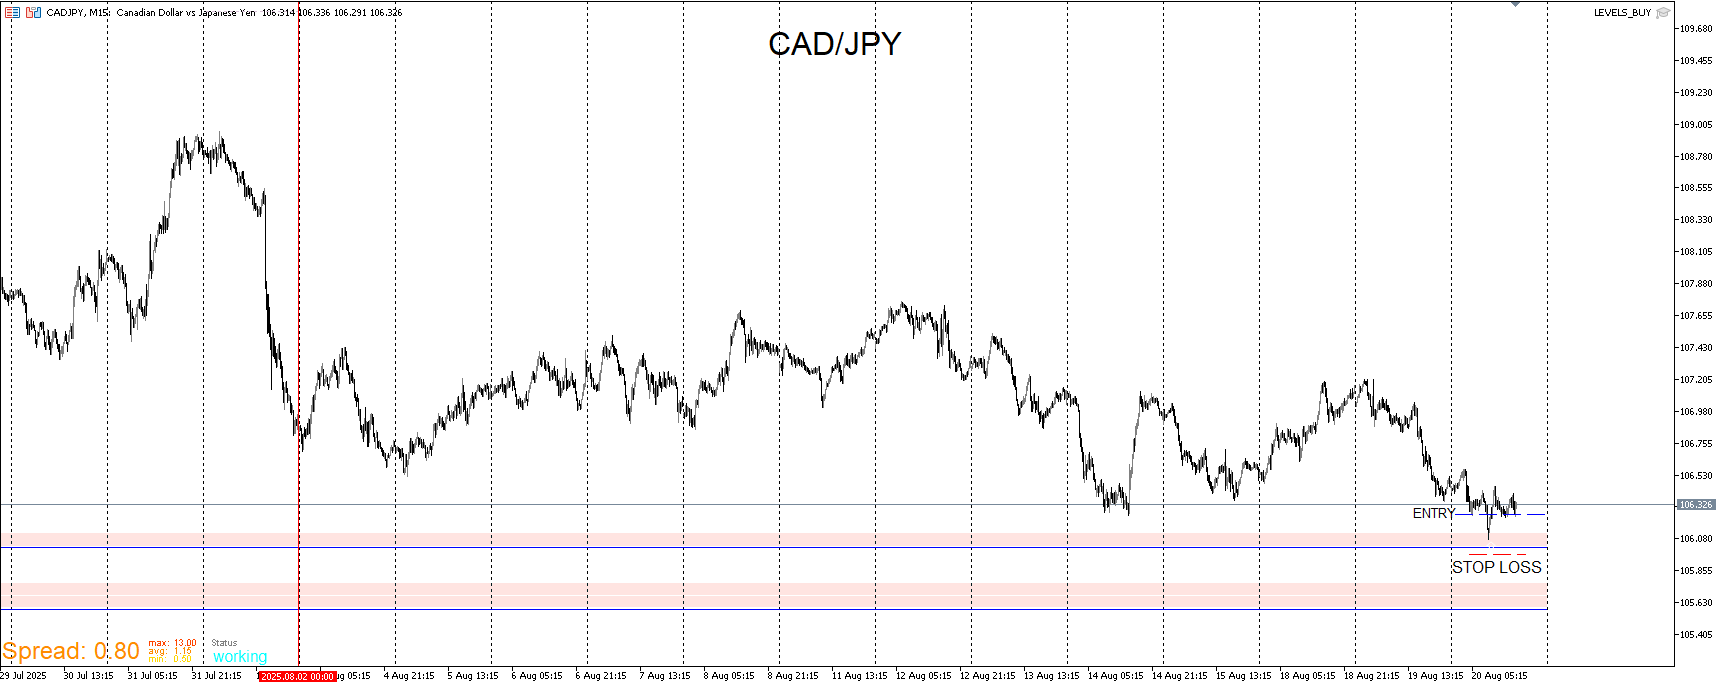
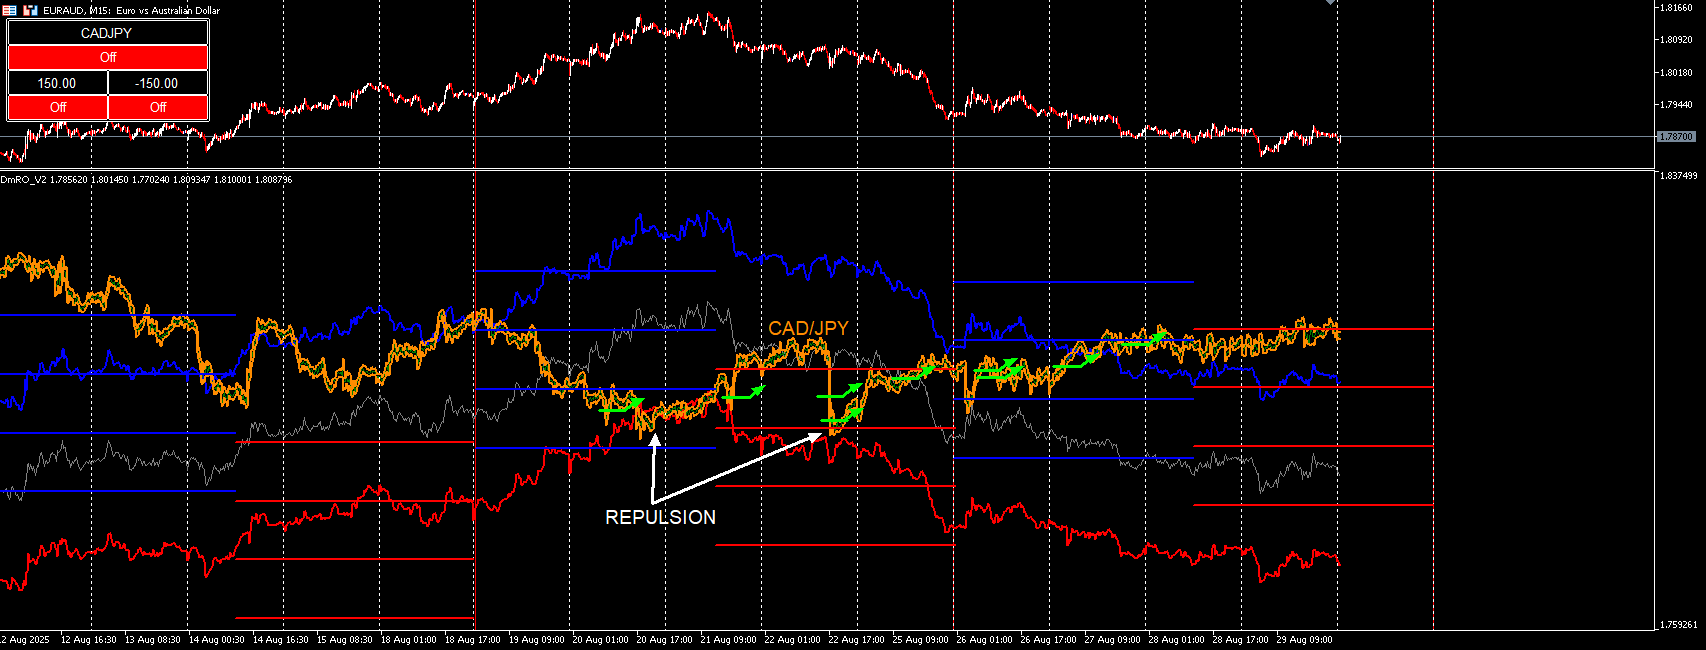
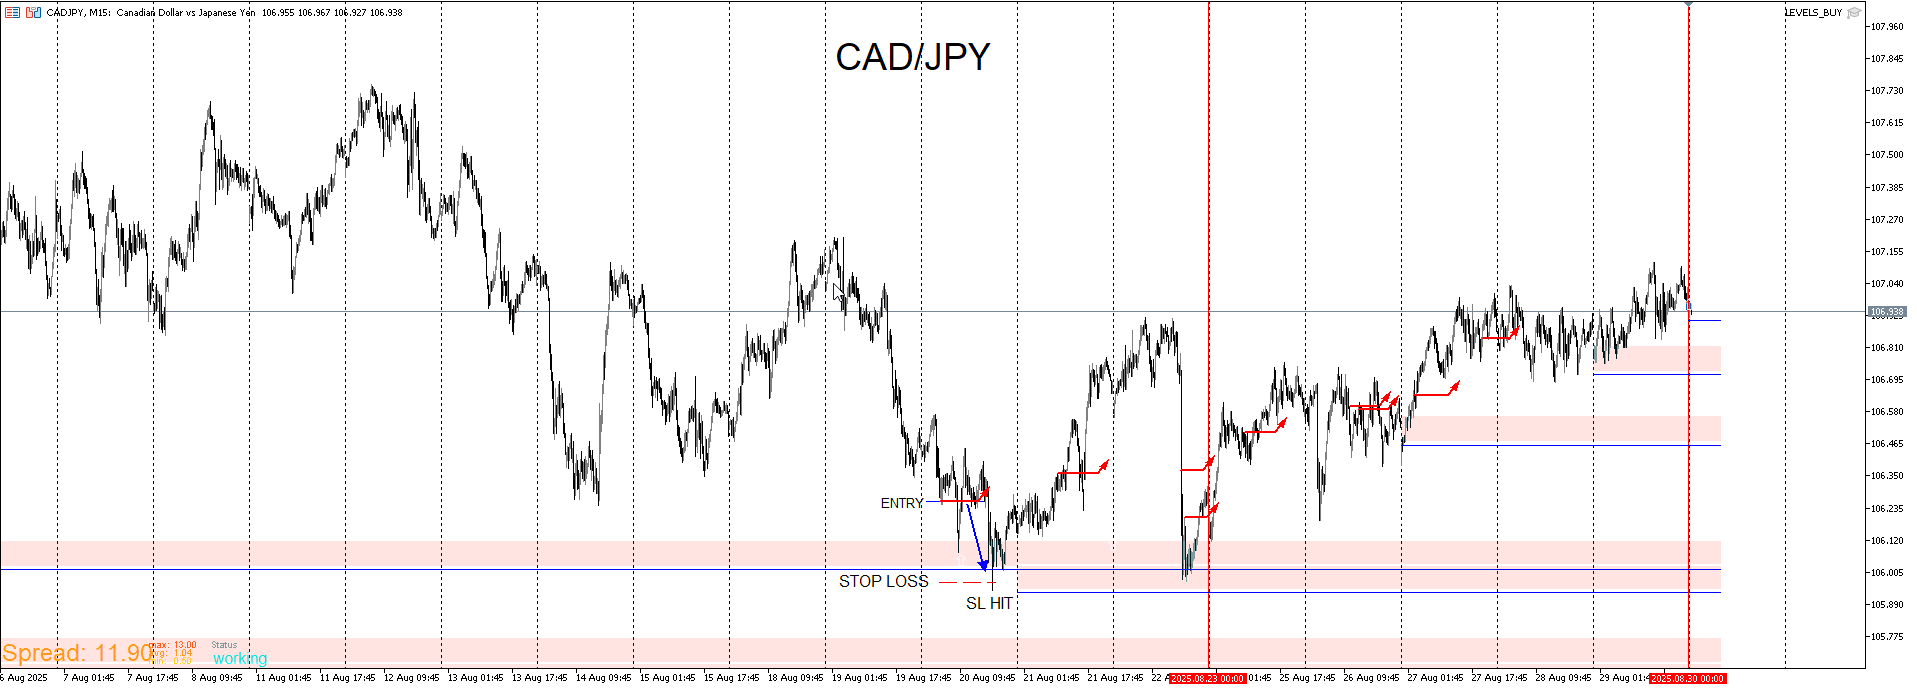
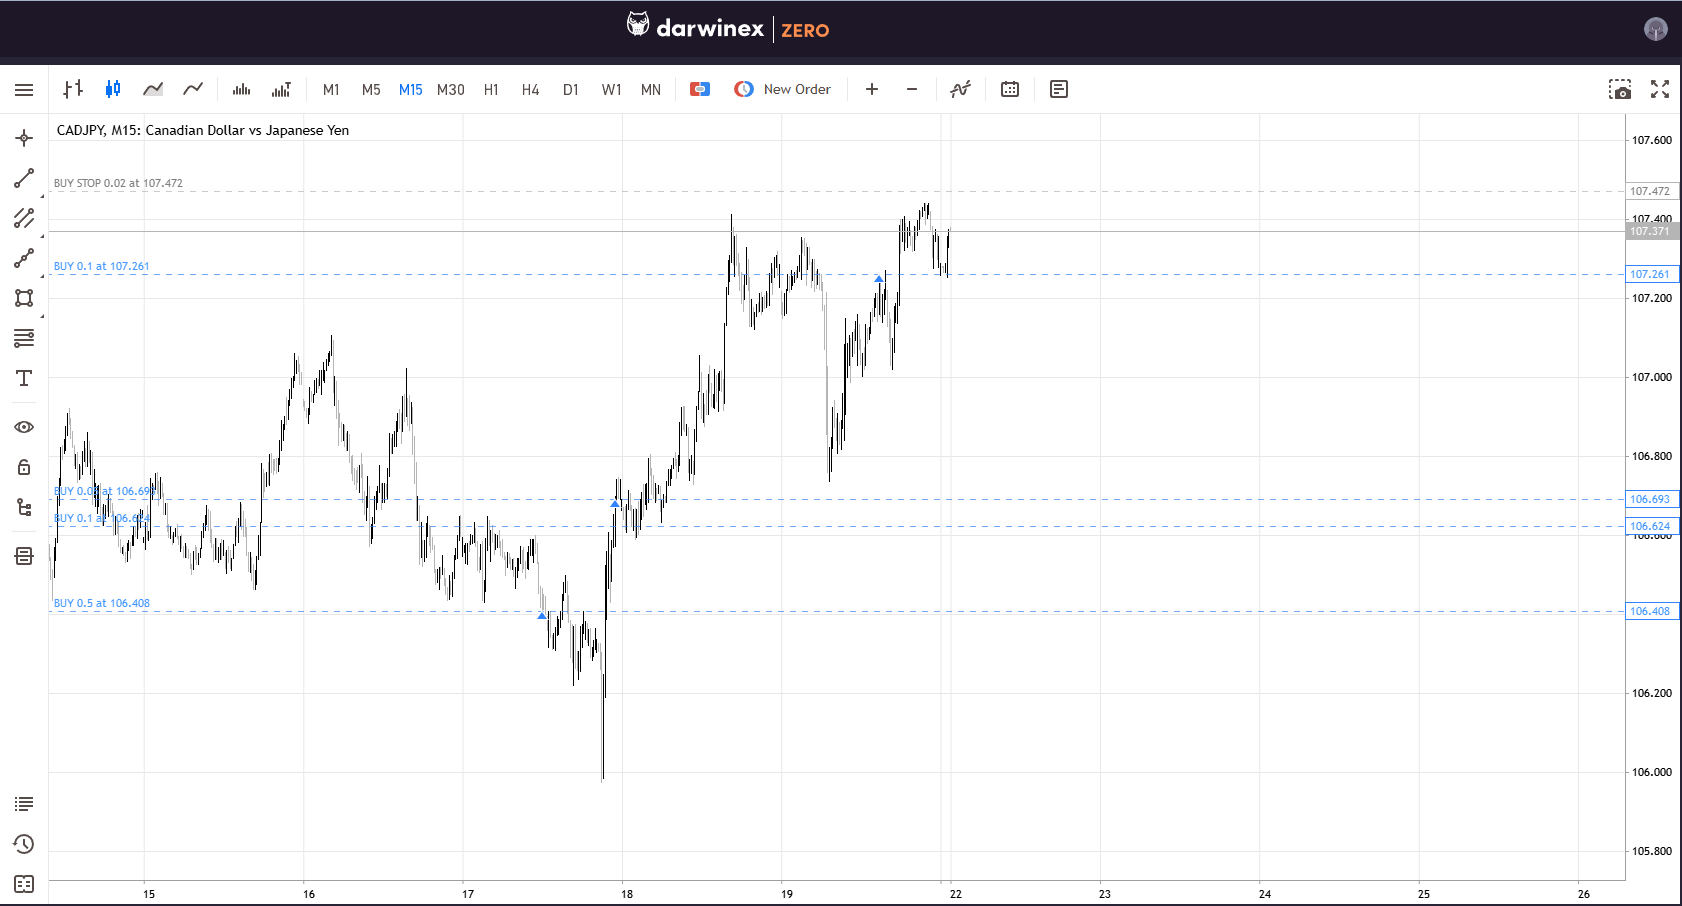
Here’s a setup that I briefly touched on in a previous post. This will be the second time I’m taking an entry with this setup. I’ve actually missed a handful of them due to computer issues so I didn’t catch them live. This is a rare instance and the type of setup that I see as a lucrative opportunity. I believe that CAD/JPY is at or nearing a turning point before upward momentum come in. I entered at 106.253 with a small position. On this version of the DmRO indicator is the ability to overlay another instrument. The feature isn’t 100% perfect for every instrument and can be buggy but overall after a lot of cross referencing and filtering out what works and what doesn’t, it’s a pretty handy feature. A handful of currencies just aggressively pushed up namely EUR and GBP currencies. Though my bias is short on them, that doesn’t mean that I’m shorting now. That opportunity may come weeks later. But what I am looking at is how CAD/JPY is interacting with GBP/CAD and EUR/AUD. CAD/JPY which is represented in the orange moved down as certain EUR and GBP pairs pushed up. I am expecting a repulsion with CAD/JPY going long and some EUR and GBP pairs likely stagnating sideways. Just because one pair puts in a trend, that doesn’t mean that an inverse pair will put in a trend in the opposite direction. Maybe they could go short from here but from past experiences, it never worked out for me shorting into aggressive movement like this. For GBP/CAD, I’m looking at CAD/JPY vicinity to the blue tracer. For EUR/AUD, it’s very near the red negative tracer which is the strongest signal for this setup. The actual price line can be used as well. These lines can break through each other and continue but that’s a very rare scenario so I look for either pinching or some intersecting before reversing. Also it depends on if I have other analysis that confirms my bias which in this case I had other reasons to be long on CAD/JPY. This method assist with timing.
Here's a template that I still use. This helps with risk. If my analysis is wrong or mistimed, this is where I want to be invalidated at. I can always give it another shot later.
-
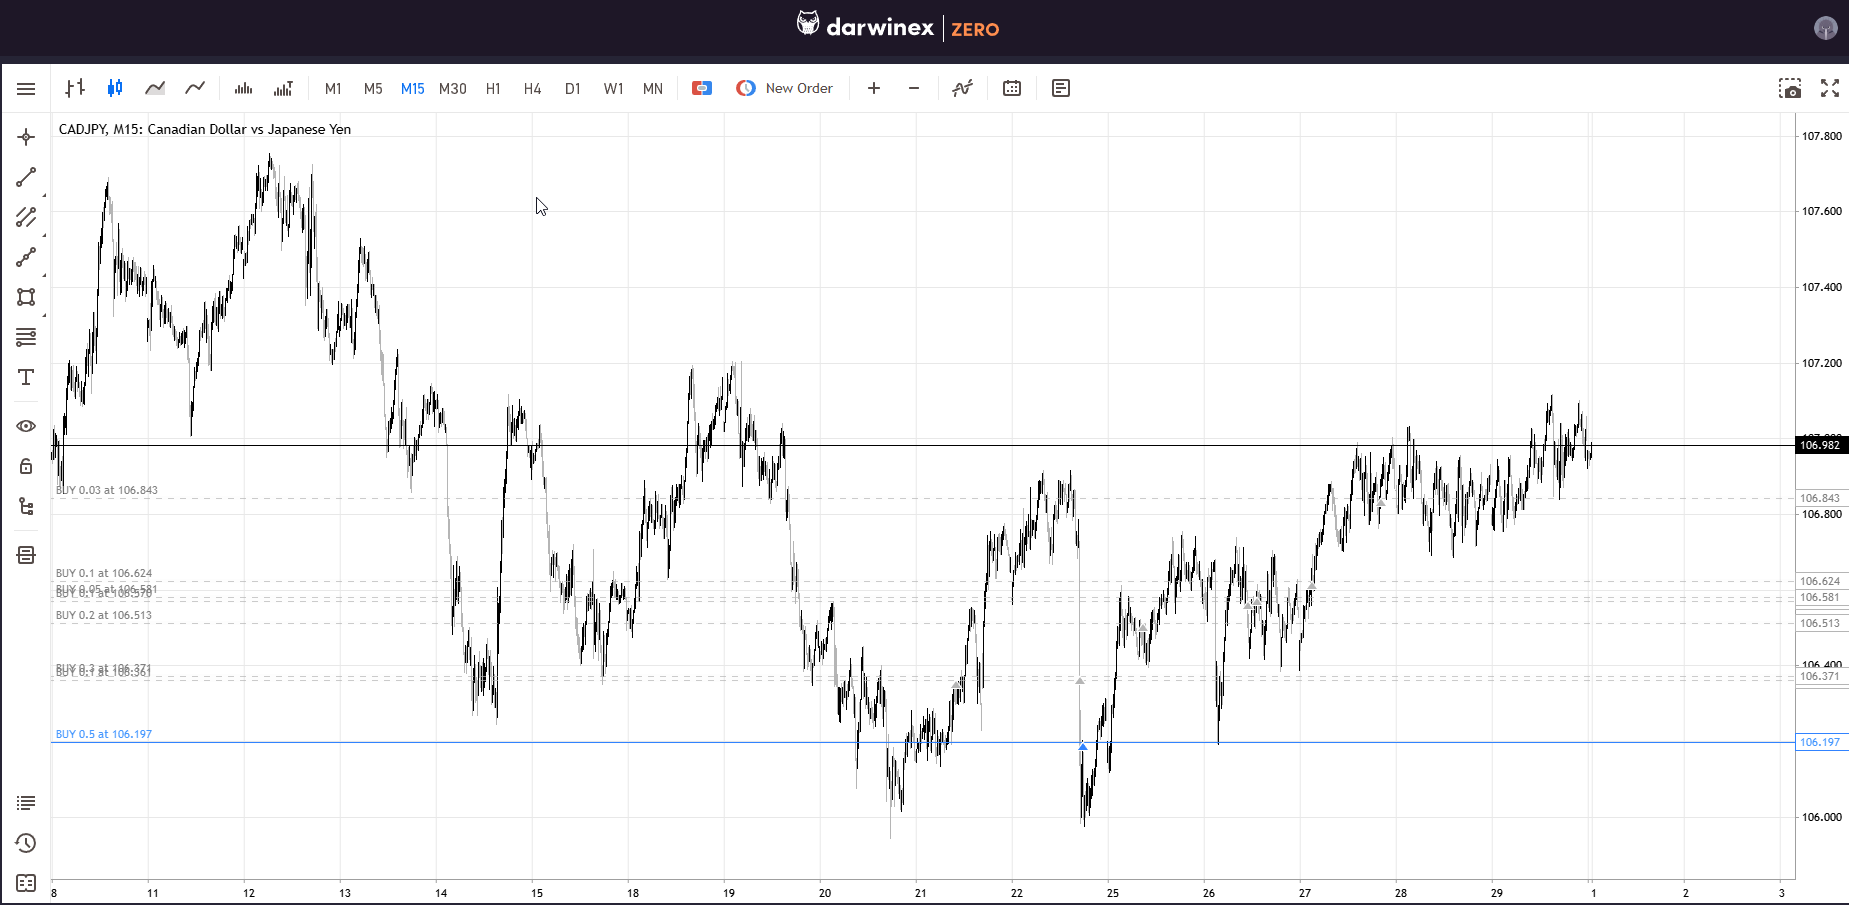
Here’s an update to end the month of August. My first entry on CAD/JPY got stopped out. That was why I used a very small position on the first entry. Even though I got stopped out, that didn’t change my bias. I re-entered and added more positions of varying sizes but all still reasonable to the account size. The stops are also set underneath market structure. I don’t know if price will continue upwards. But if it does, this is where I want to be positioned. While I do look for bottoms, they are really hard to time for entries but I will pyramid positions if I believe the bottom was recently put in. Highlighted in green are my positions. I did add a couple on the drop but in this case I didn’t worry because this is a rare instance I’d feel okay with doing so. I’ve also shorted GBP/AUD and GBP/CAD which both moved down. Now I will sit and wait and let it play out regardless which way it goes. When I see another opportunity to add I will post an update.
-
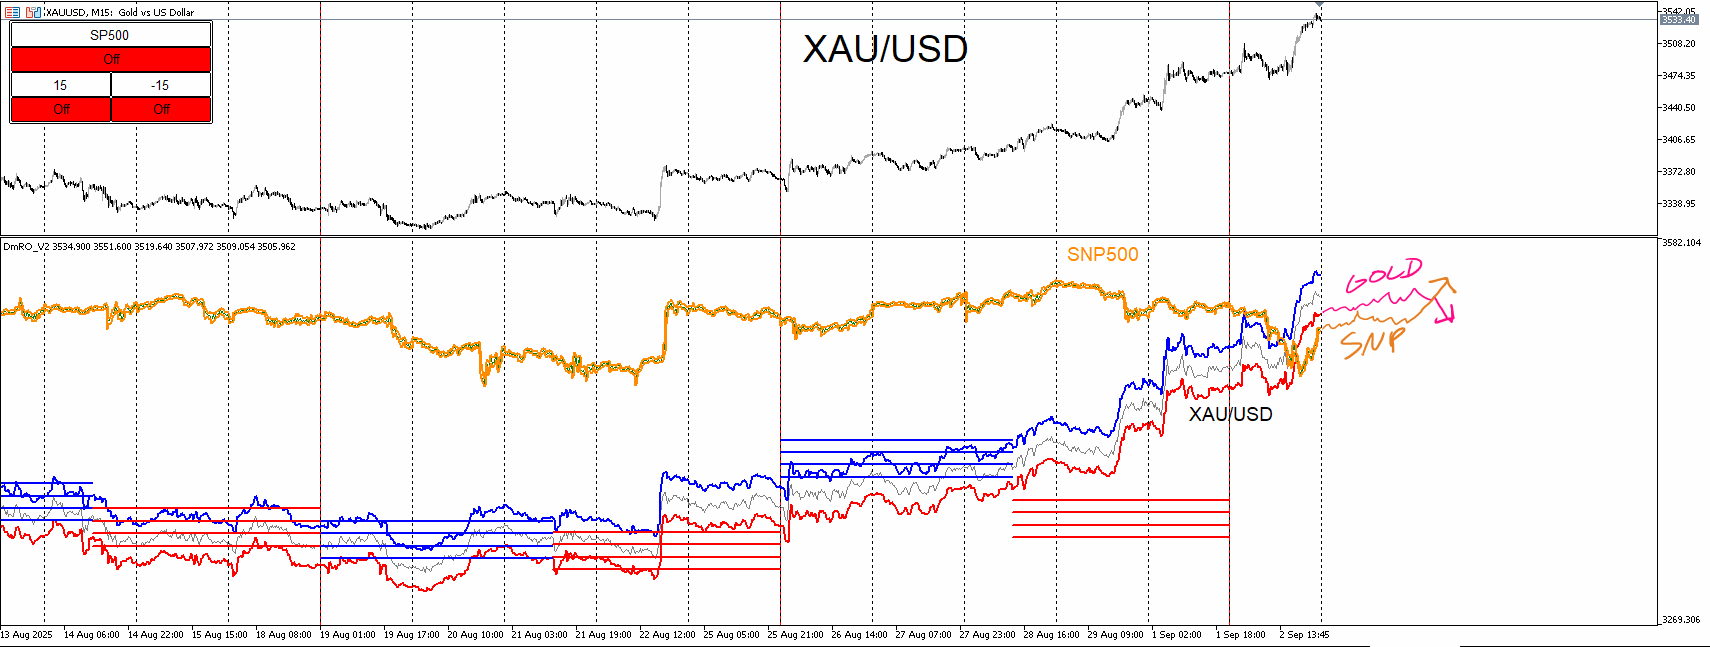
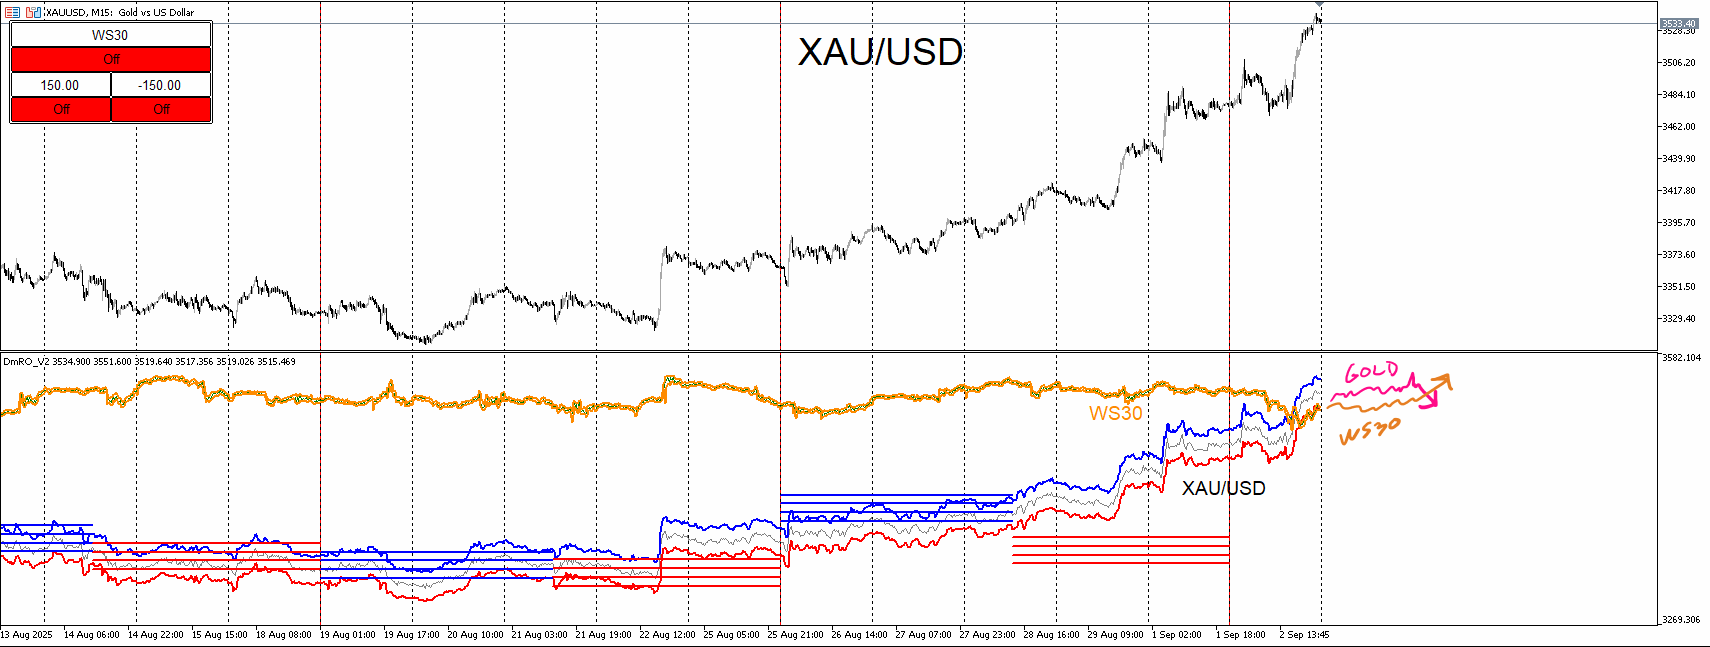
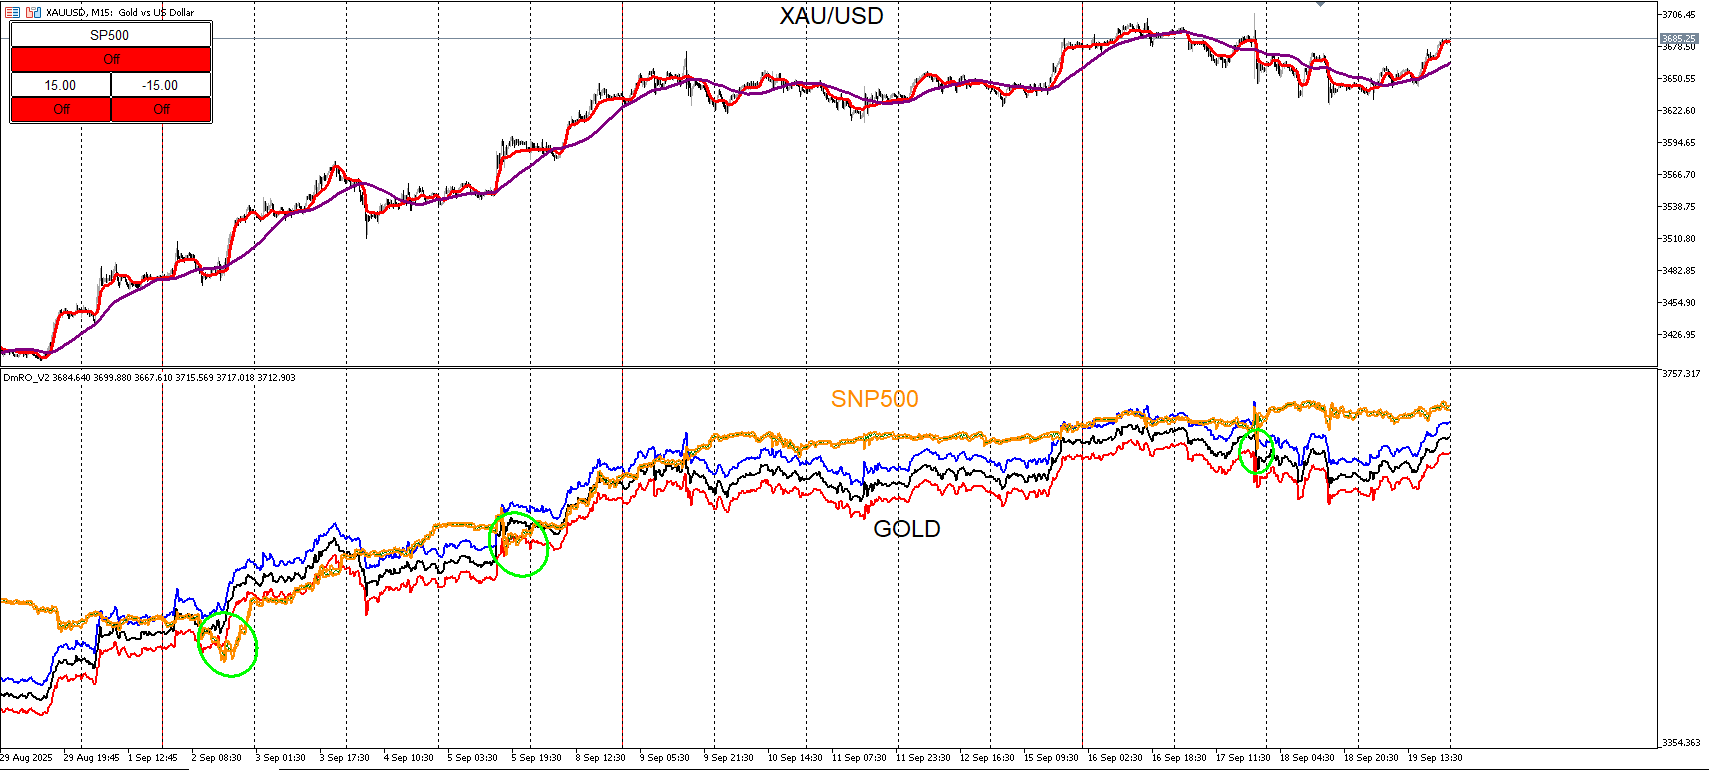
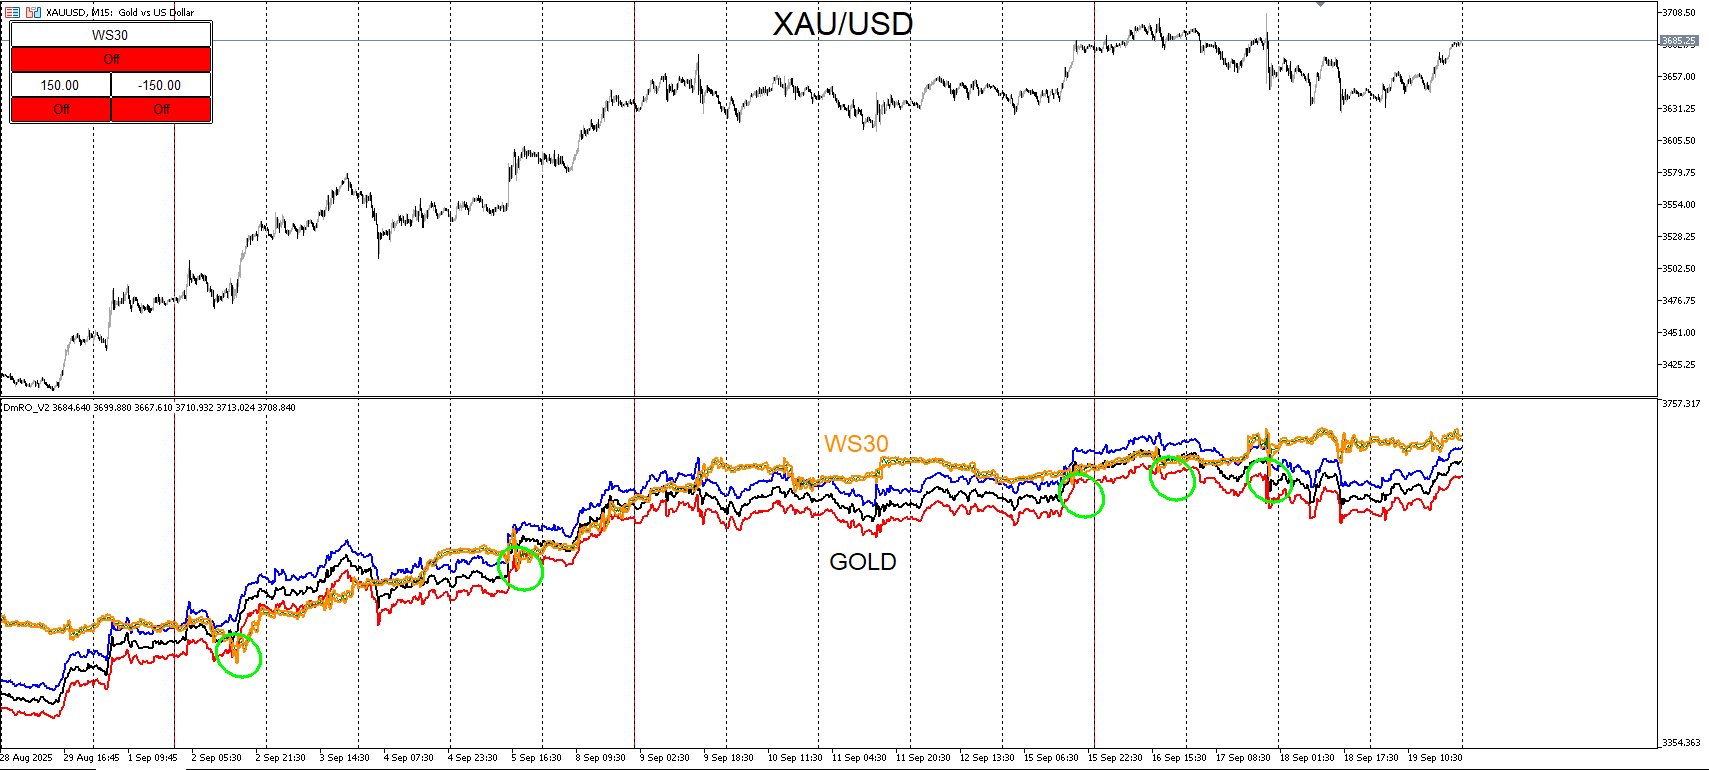
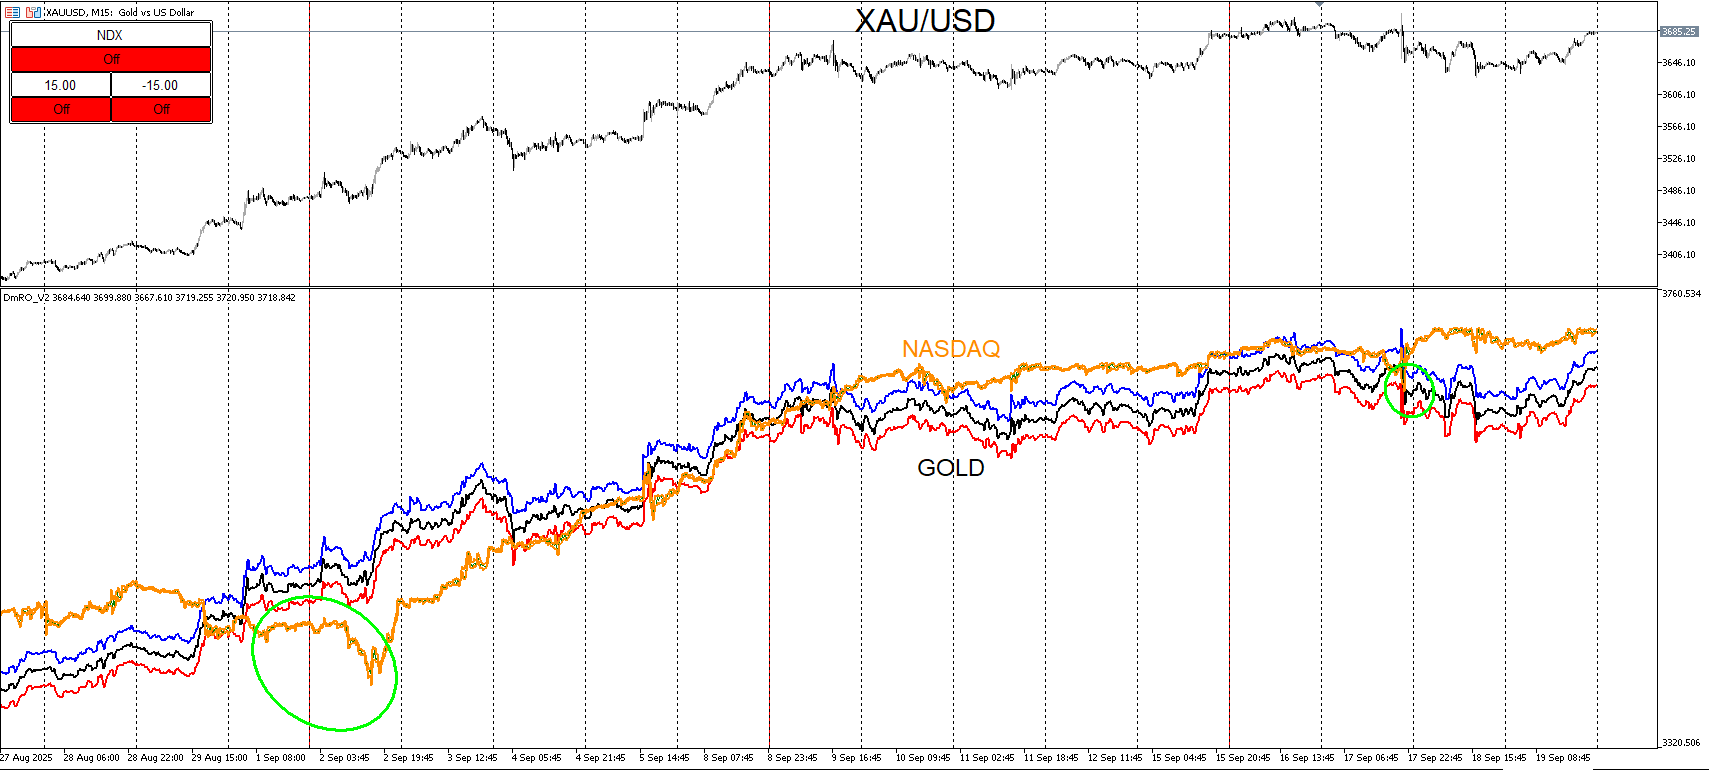
Here’s a look of the DmRO indicator when applied to indices and metals. I don’t focus much on indices and metals but there are opportunities that can be spotted from time to time and I believe this may be one of them. Looking at XAU/USD, it’s been a bull market for quite some time. One should be very cautious of shorting all times highs and possible squeezes up but I believe that there is a time and place for everything. What ‘’should and shouldn’t’’ be done when it comes to trading the markets is entirely dependent on the trader when it comes to strategy, edge, and risk when it comes to tolerance and how it’s managed. I don’t view all trends or phases within trends as the same. In this situation I am more willing to short gold. That doesn’t mean that I expect it to fall from here. I prefer to see it climb up more and pyramid shorts into bullish volume over a period of time. I will not go heavy while expecting a drop. I will enter small and manage risk so that if I’m wrong, the losses will be very minimal. This is more so an opportunity to long the SNP and WS30 for a long term entry. 5 out of 5 of the previous interactions within the indicator throughout this current year were opportunities to get in with the April drop being the most extreme. This is my idea for an entry based purely off that probability.
-
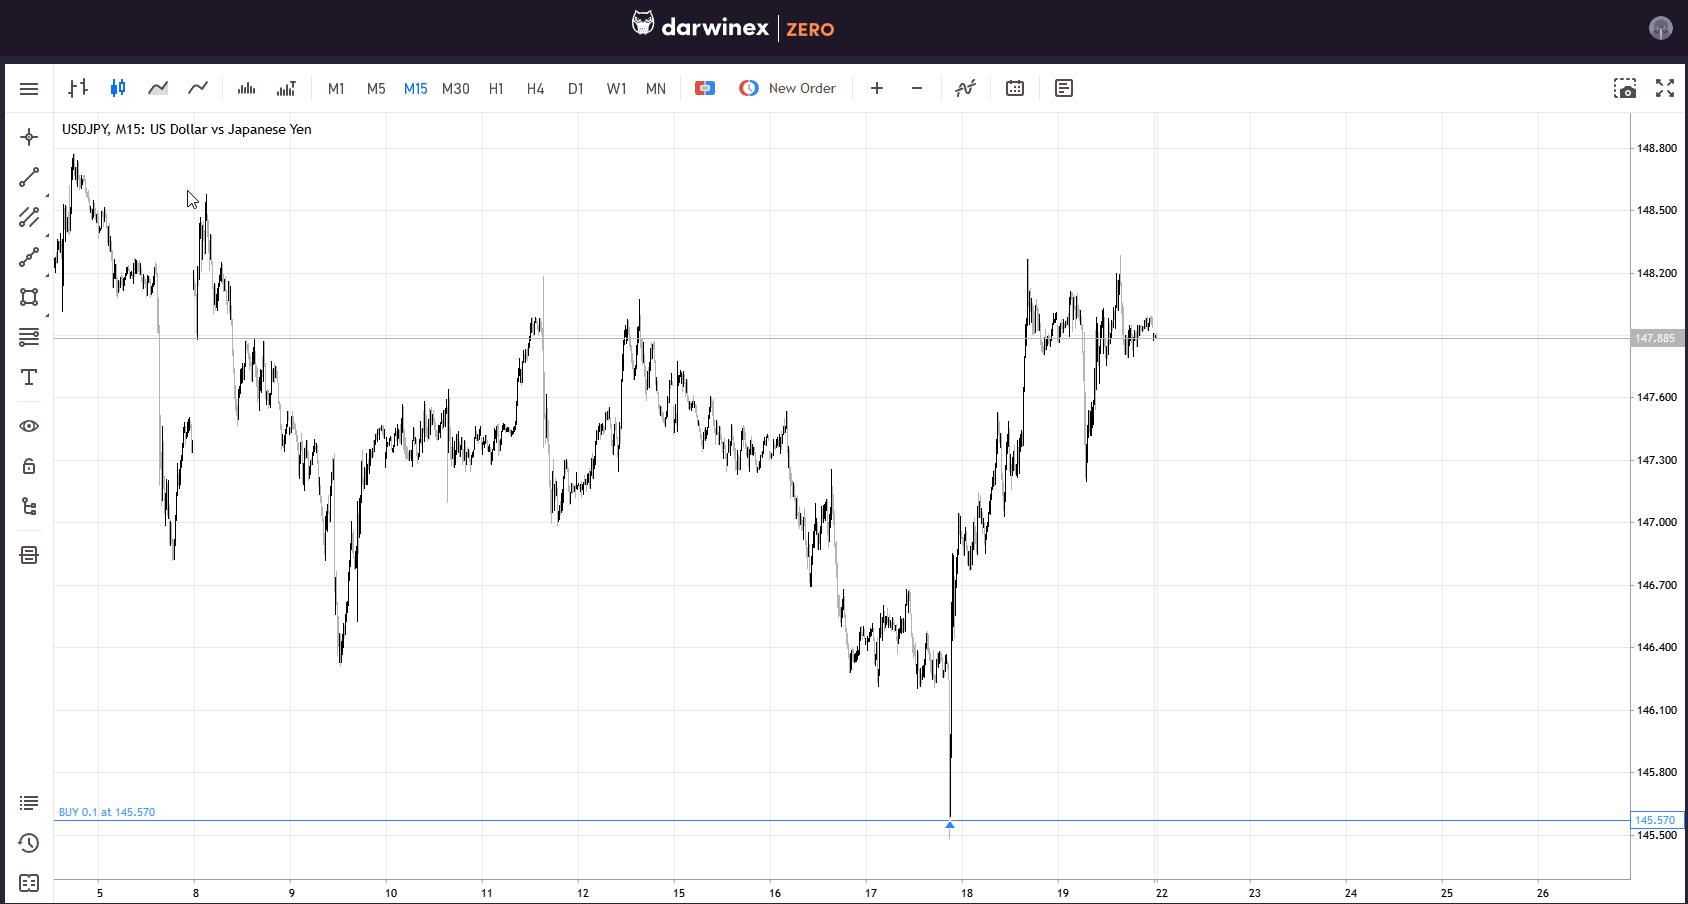
Here’s an update on previous charts starting with USD/JPY. I posted a setup that I was anticipating and didn’t get it at the time. It took around an entire 6 weeks to get the signal. Price mostly consolidated and the idea was to enter only when the yellow tracer contacts the yellow line. Since price was sideways, the levels weren’t too different. It just happened to be generated at nearly the exact ranges of the first post. This isn’t to say that I believe that price will trend up from here. It’s just an entry based on probabilities that if it were to put in a trend up, this is where I want to be positioned early.The buy limit got triggered and I will look for another entry this coming week.
CAD/JPY is another pair I covered recently and took entries on. I did add some positions but they were taken out with some being at break evens and some with a small loss.I did re-enter and will continue to look for more entries if it continues up. I re-entered because it was still respecting the EUR/AUD and GBP/CAD interpolation tracers. It actually came into contact with GBP/CAD for the first time so I took the entry just in case they diverge and won’t return again for another while.
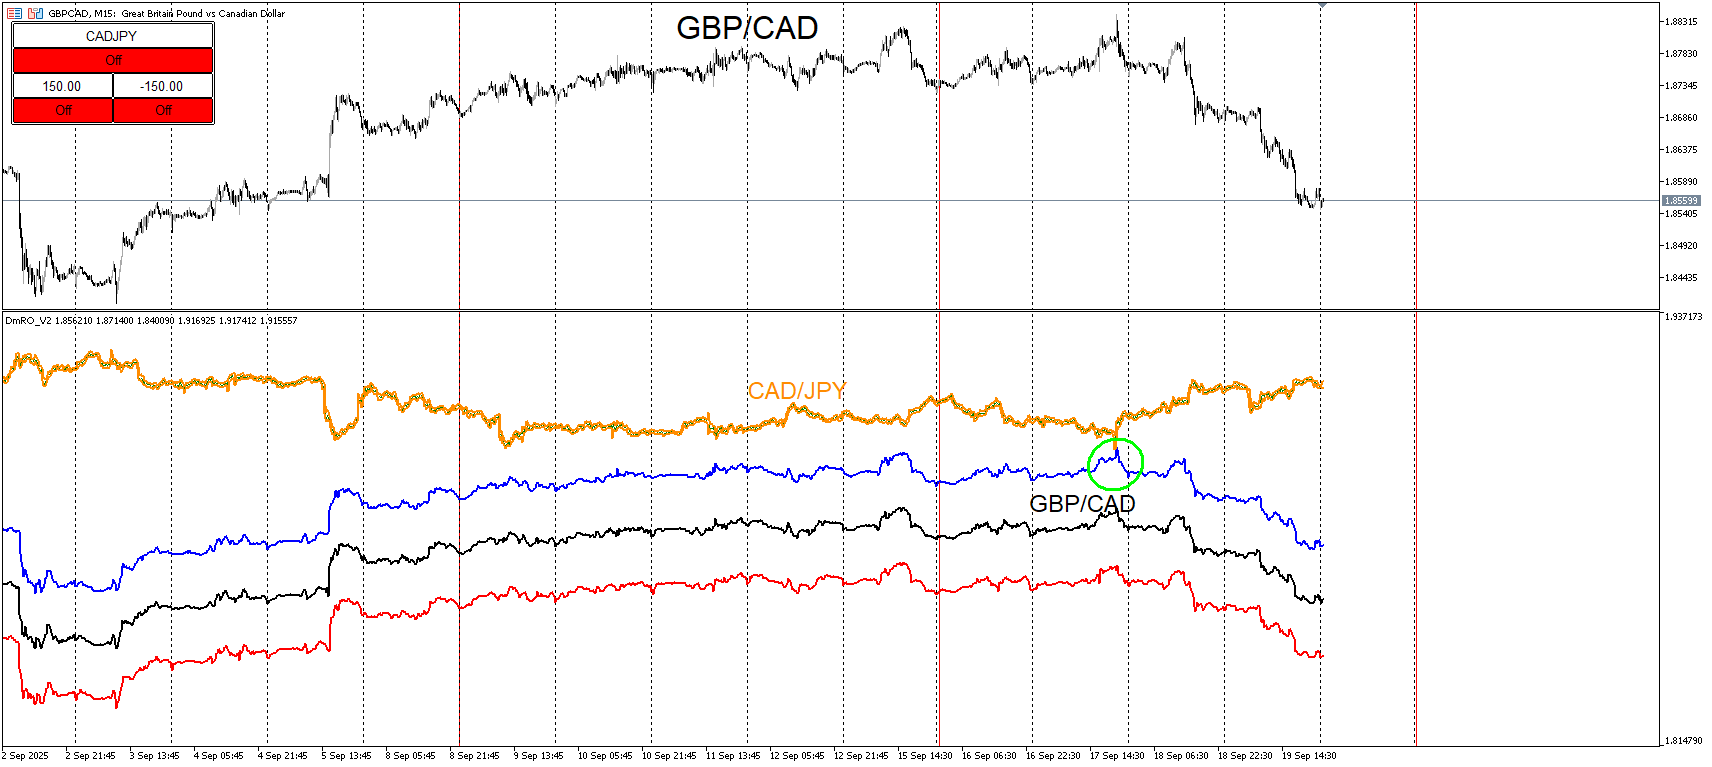
Here’s EUR/AUD with CAD/JPY overlaid on top.The last buy was when CAD/JPY was below the red. If CAD/JPY is to keep trending up, there is a very low likelihood that will dip below the red again before doing so. The black line is more likely than red but still unusual. But the bluE tracer is a much more likelihood for re-entries.

For indices and metals, both Gold and the SNP moved pretty similar since the SNP overlay crossed below the red tracer of gold. I added on to the SNP whenever it retraced back down below the red. For gold I am adding shorts around bullish momentum over time. Not heavy but this is how I’m shorting gold even though it looks like it’s still going up. I view bullish momentum here as traps before it retraces back down.Overall I see the SNP overlay as a wall that gold is pounding before diverging.
-
-
DmRO indicator has been updated and finalized.
It's available here
https://jaymart15.gumroad.com/l/skdsdf7 day free access to it with pdf and video instructions. Really short and simple and for a fair price.