My EA update
-
Que locura... esto es otro nivel.
-
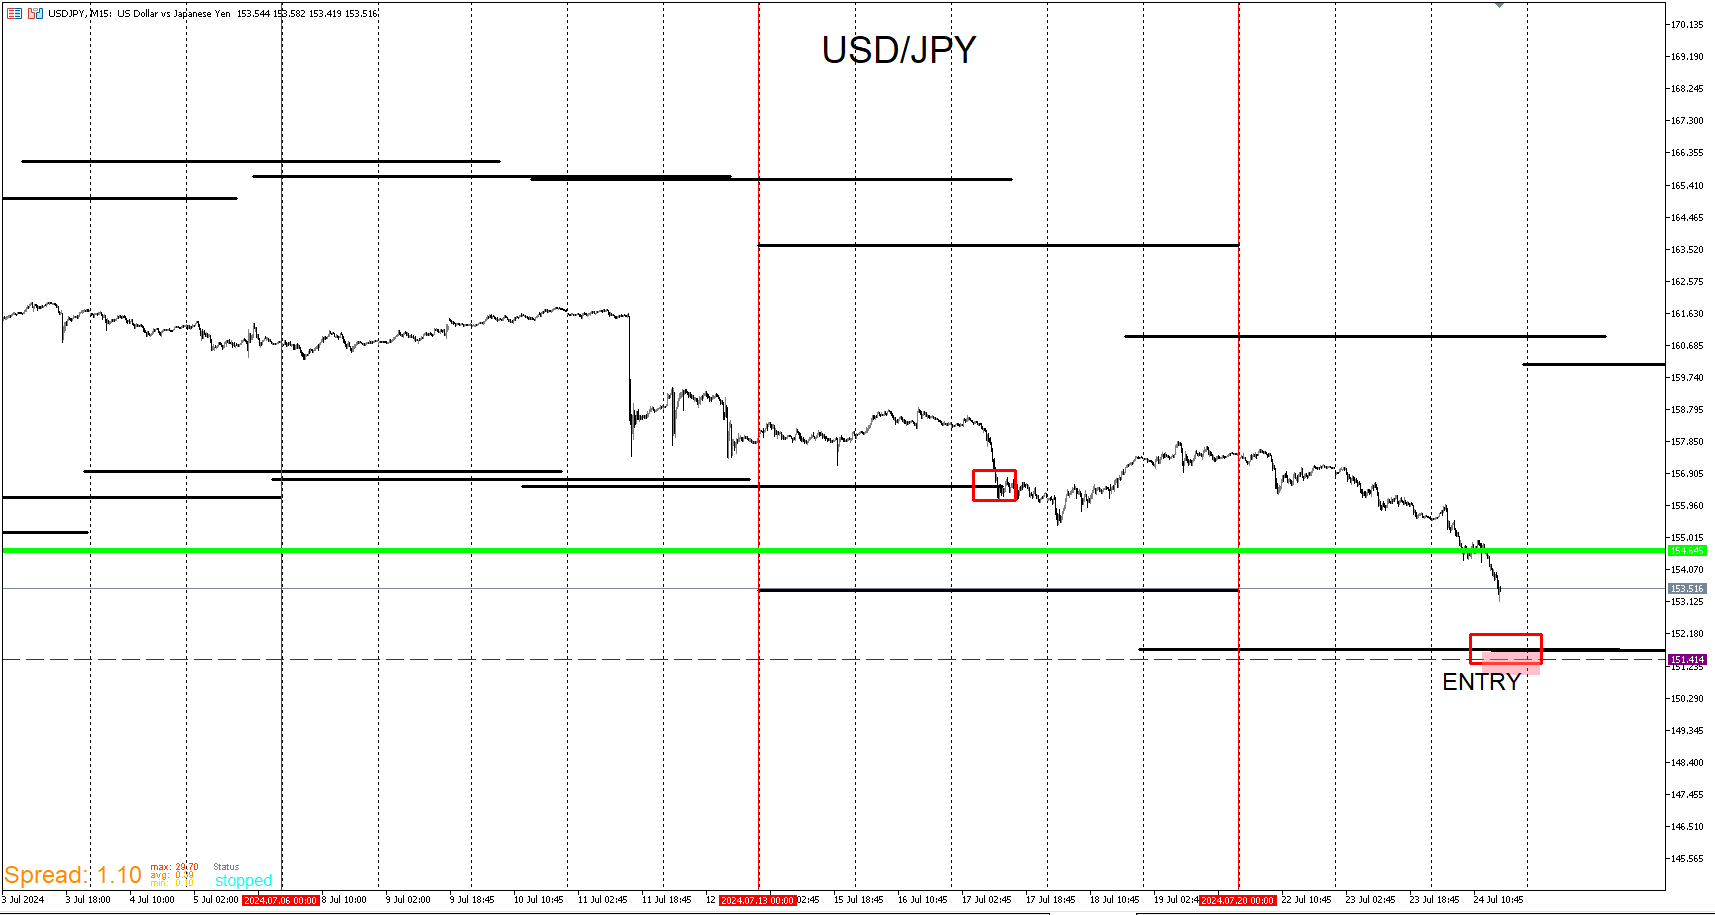
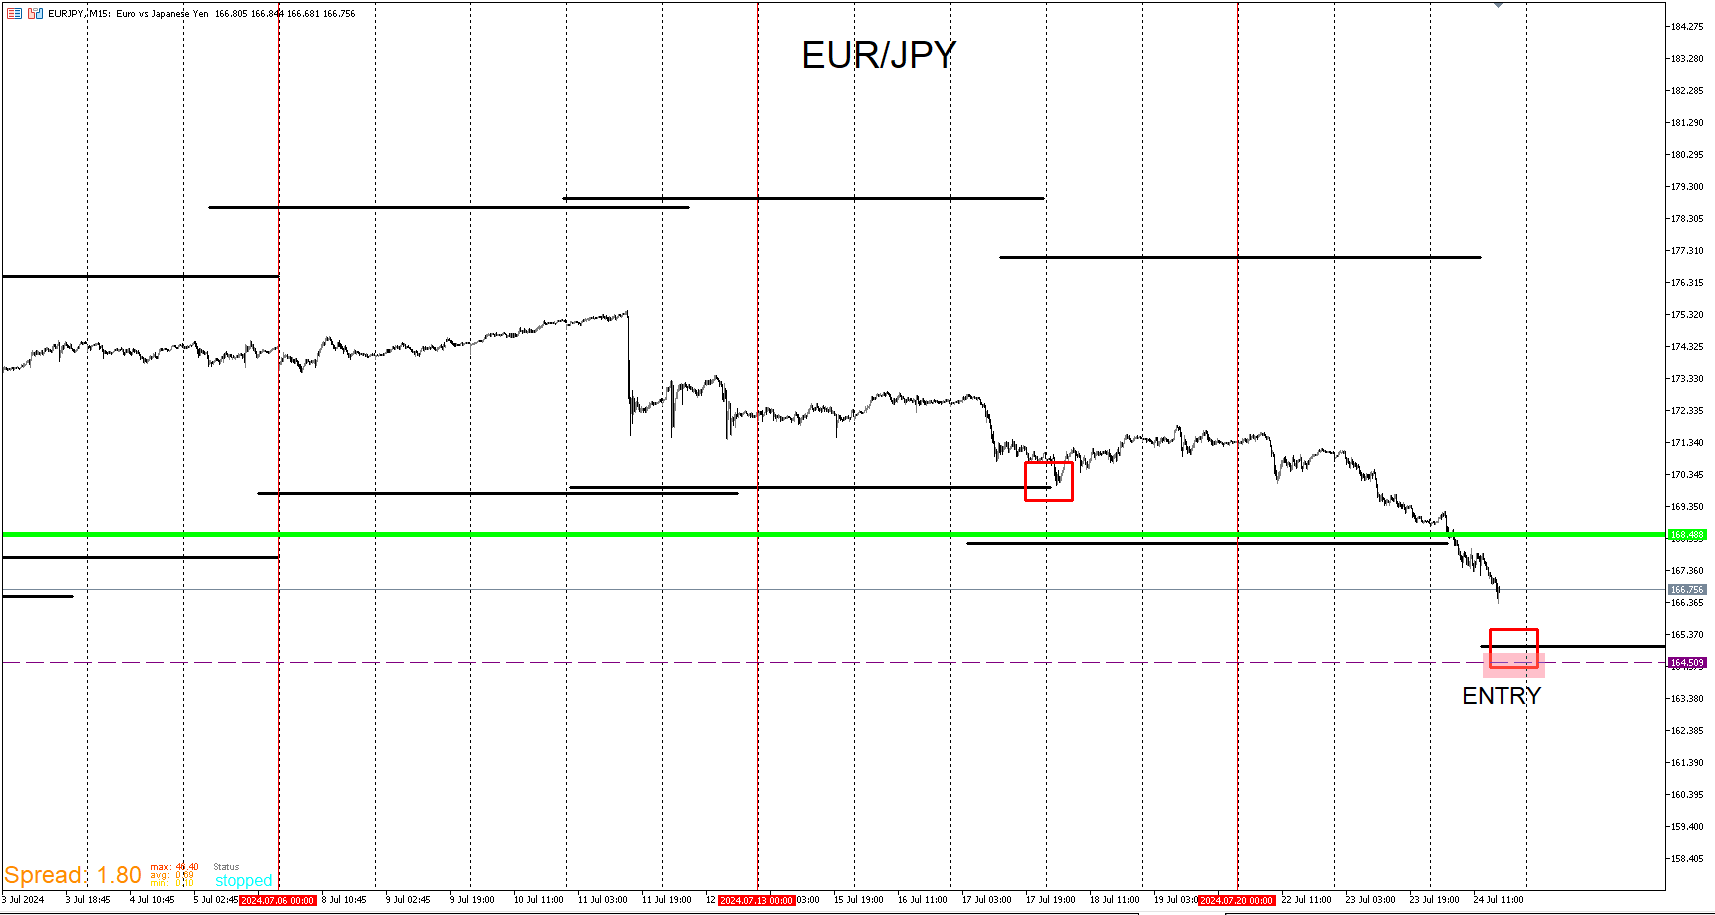
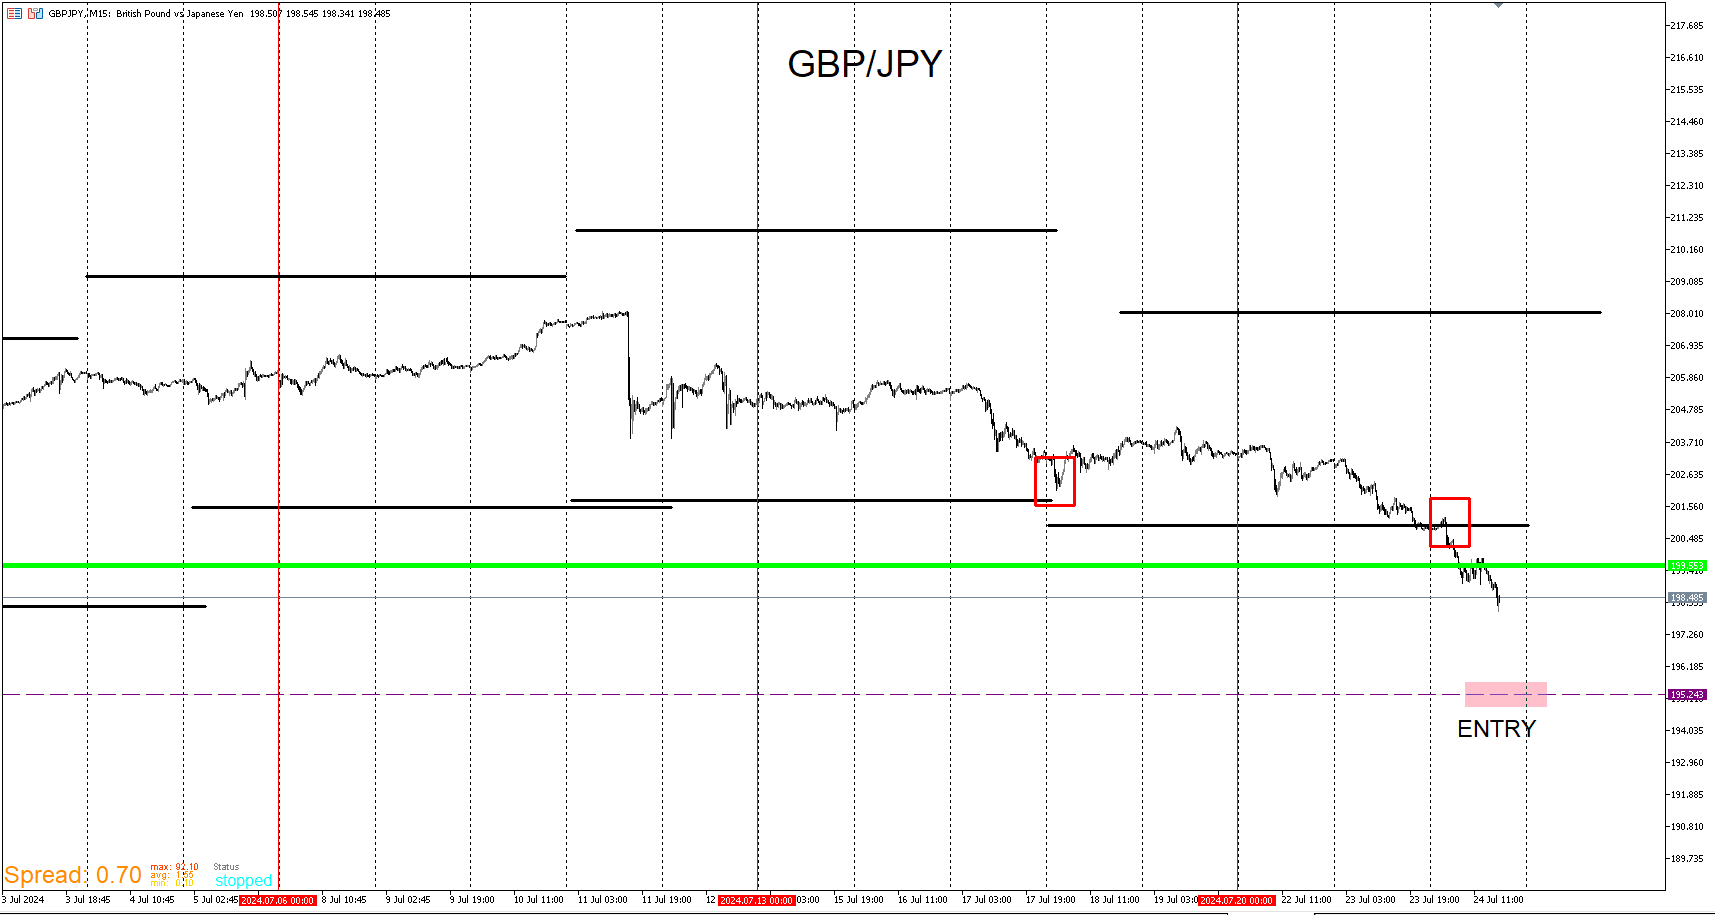
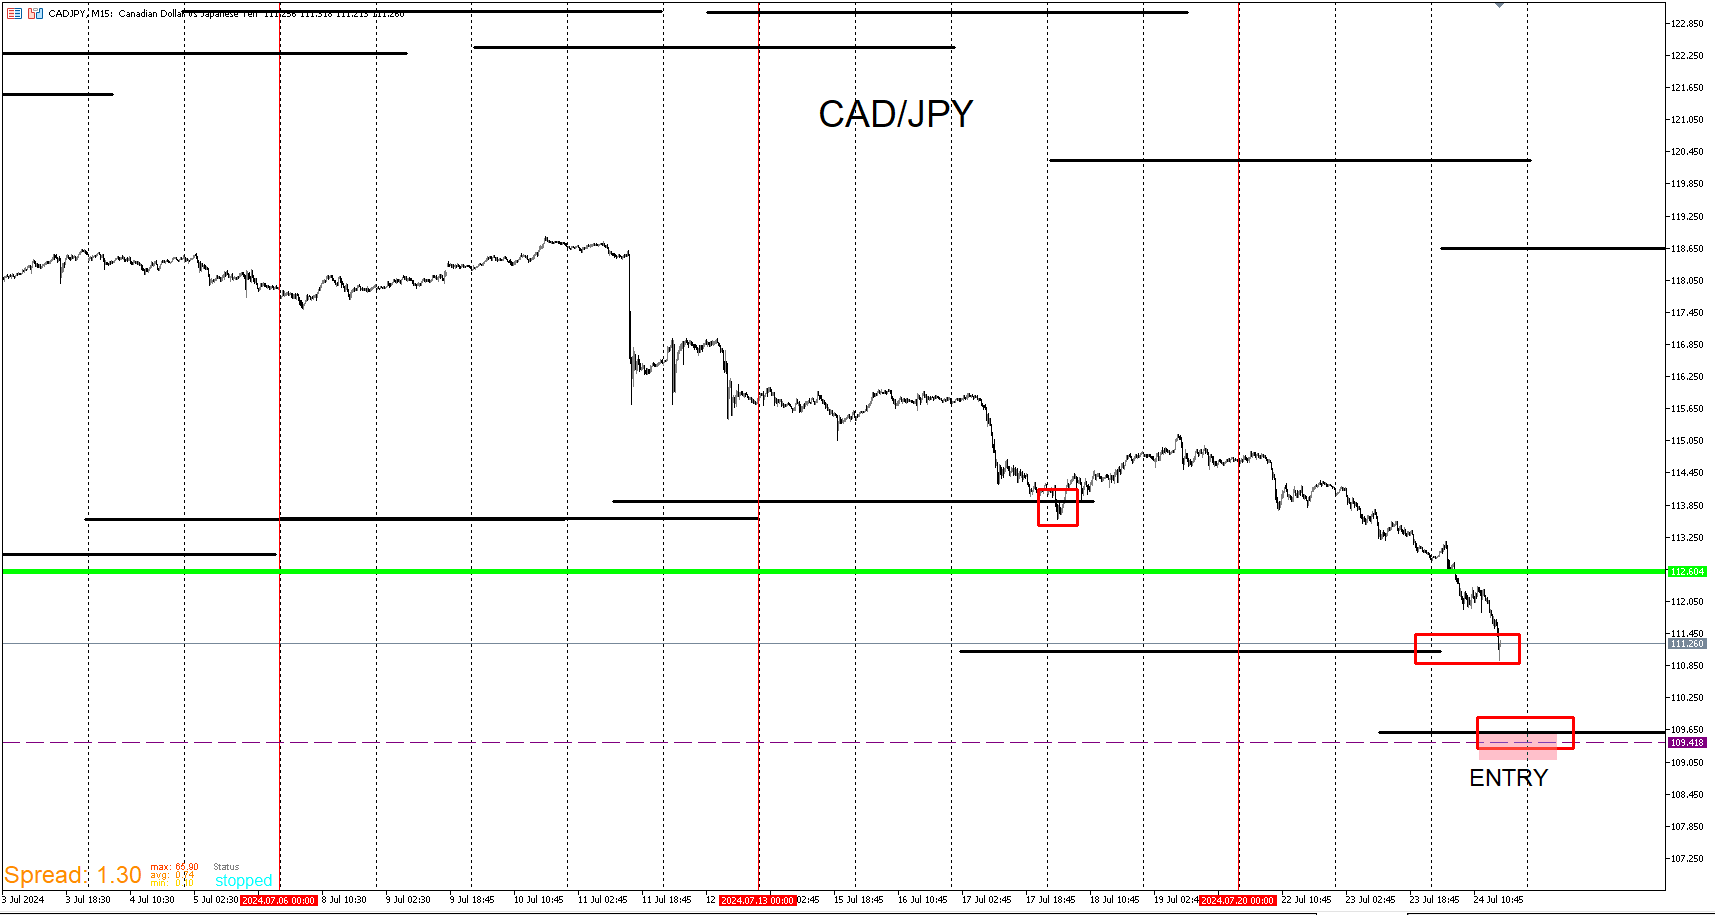
Here are Yen long setups using the wall template. If price intends on pushing up I see these entries as good entry areas.
But only if price aggressively flushes down. My interest terminal isn't loading so I'm not able get as refined as I'd like
to but I think these may be good general zones. I'll mainly be focused on USD/JPY,EUR/JPY,and GBP/JPY for the rest tend to follow those.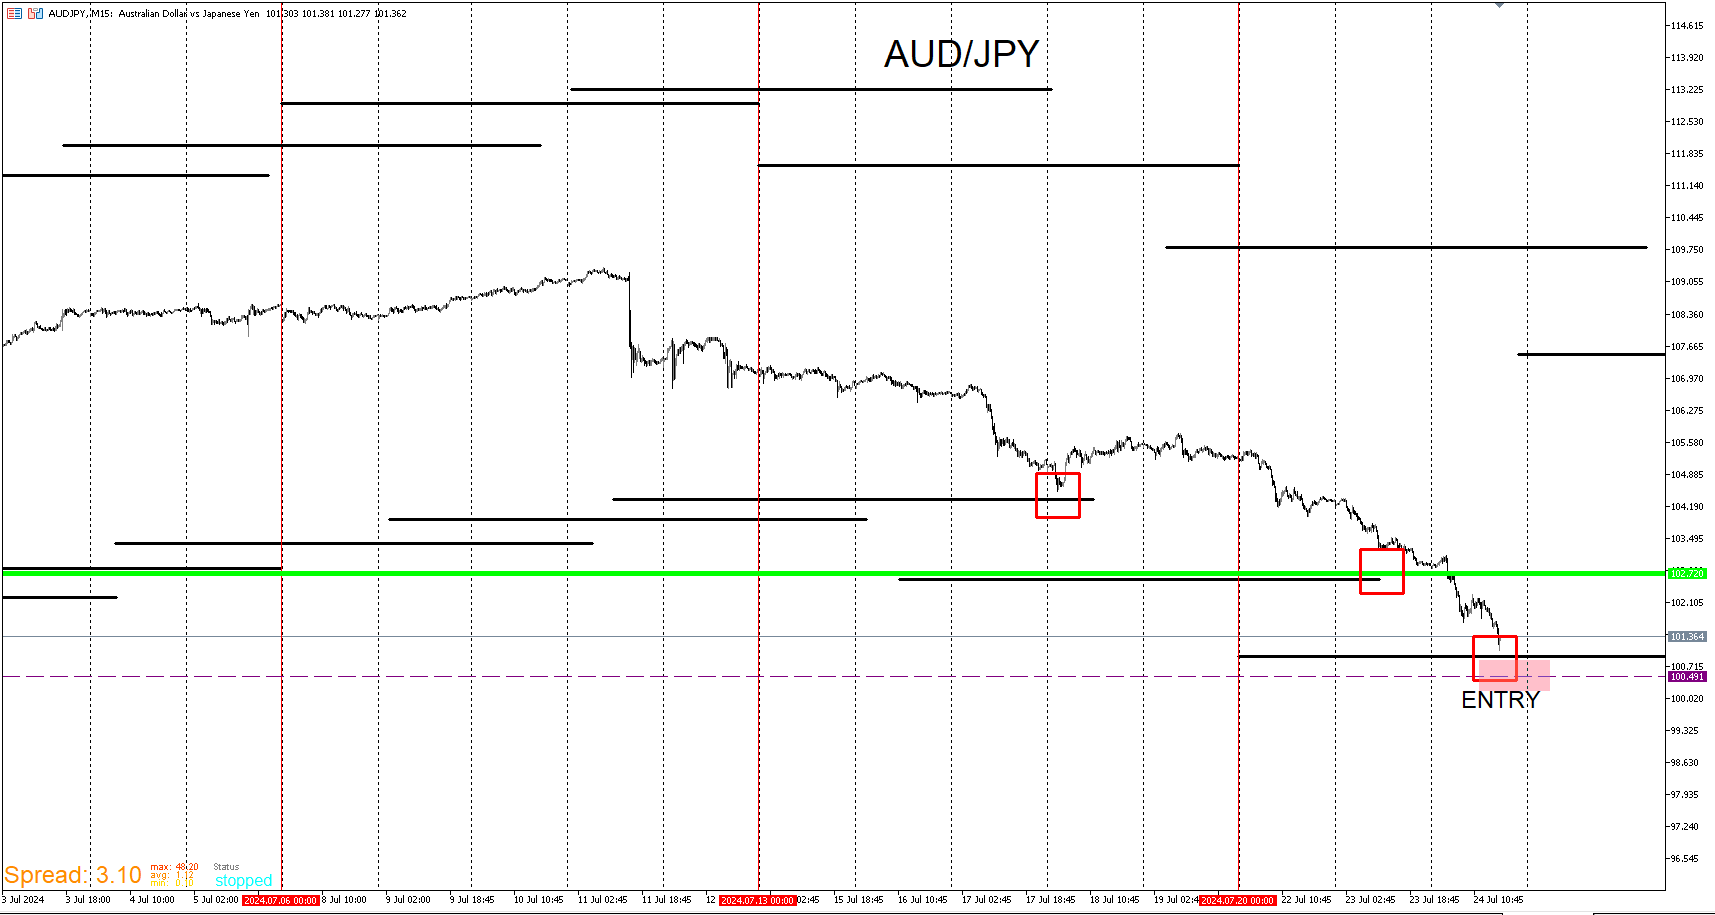
-
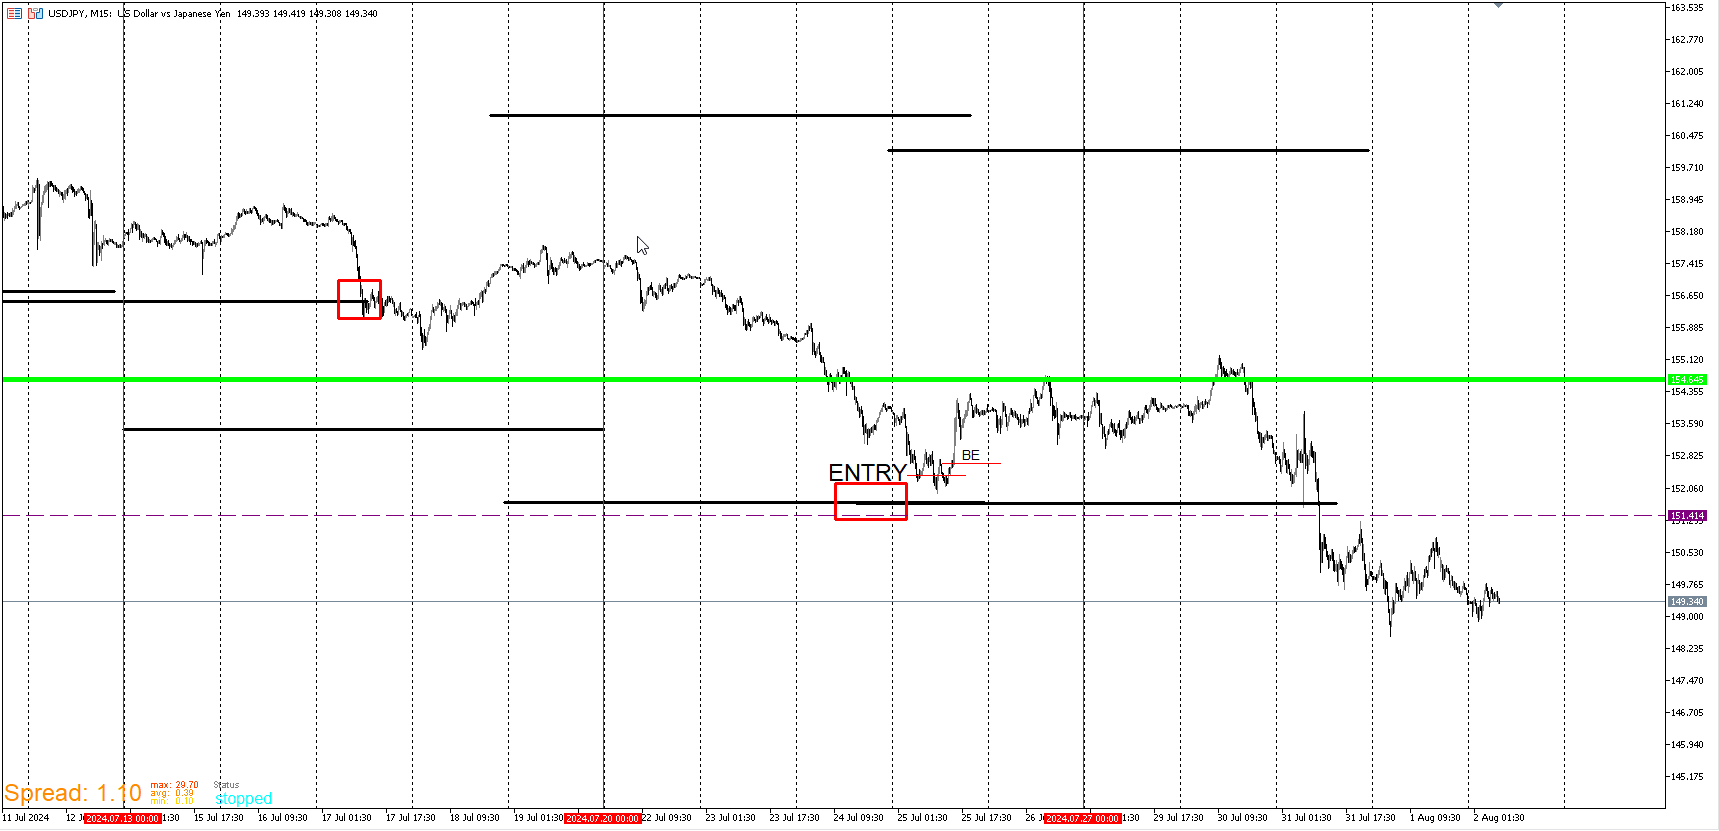
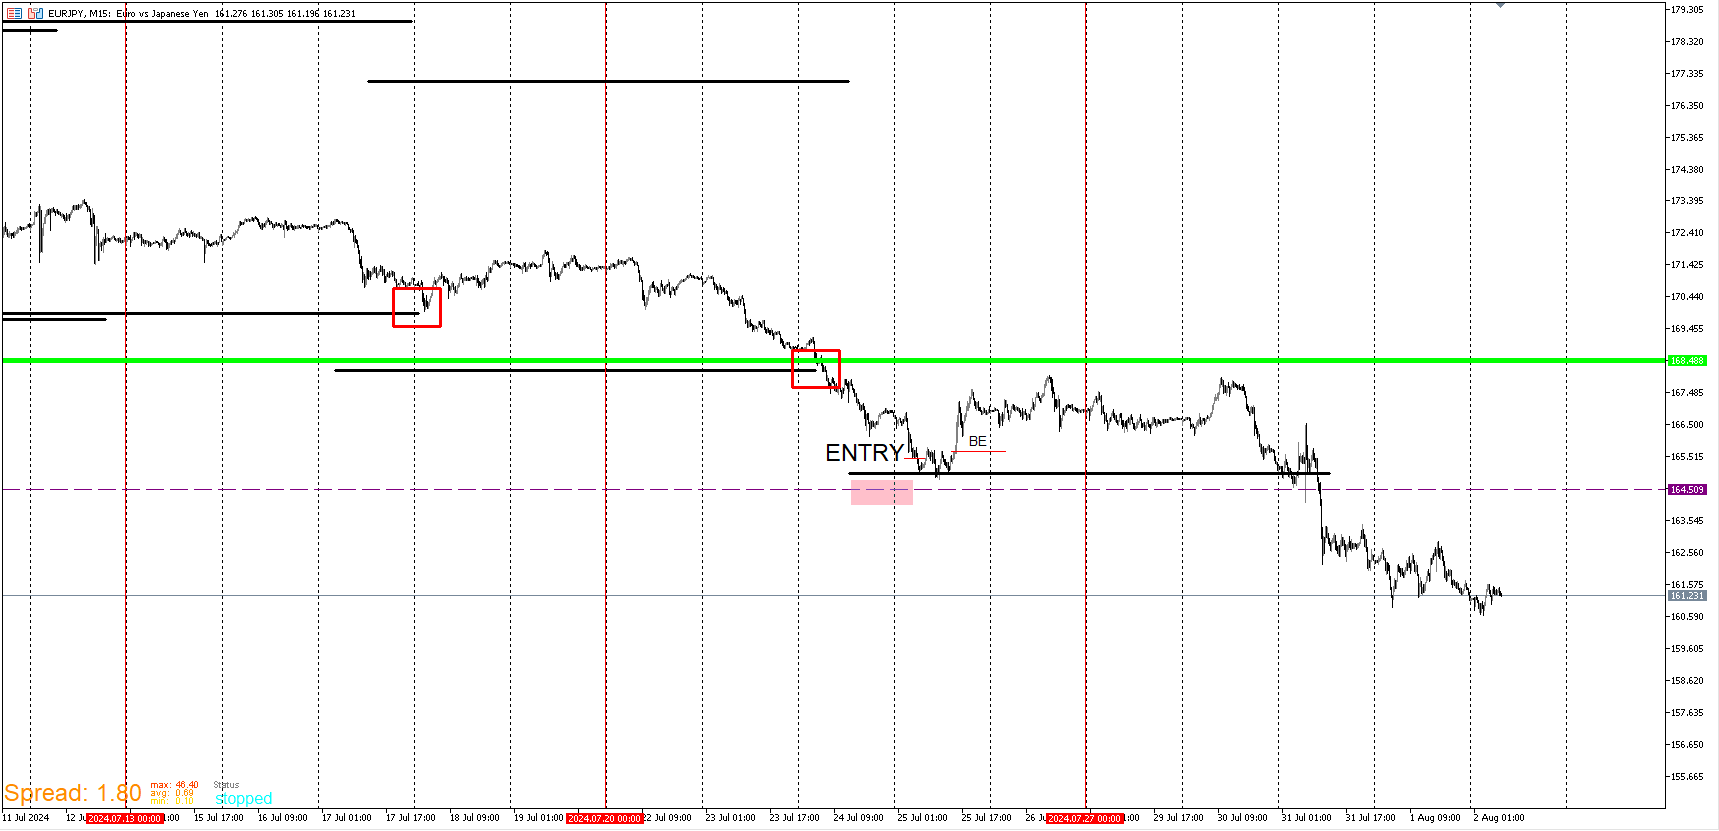
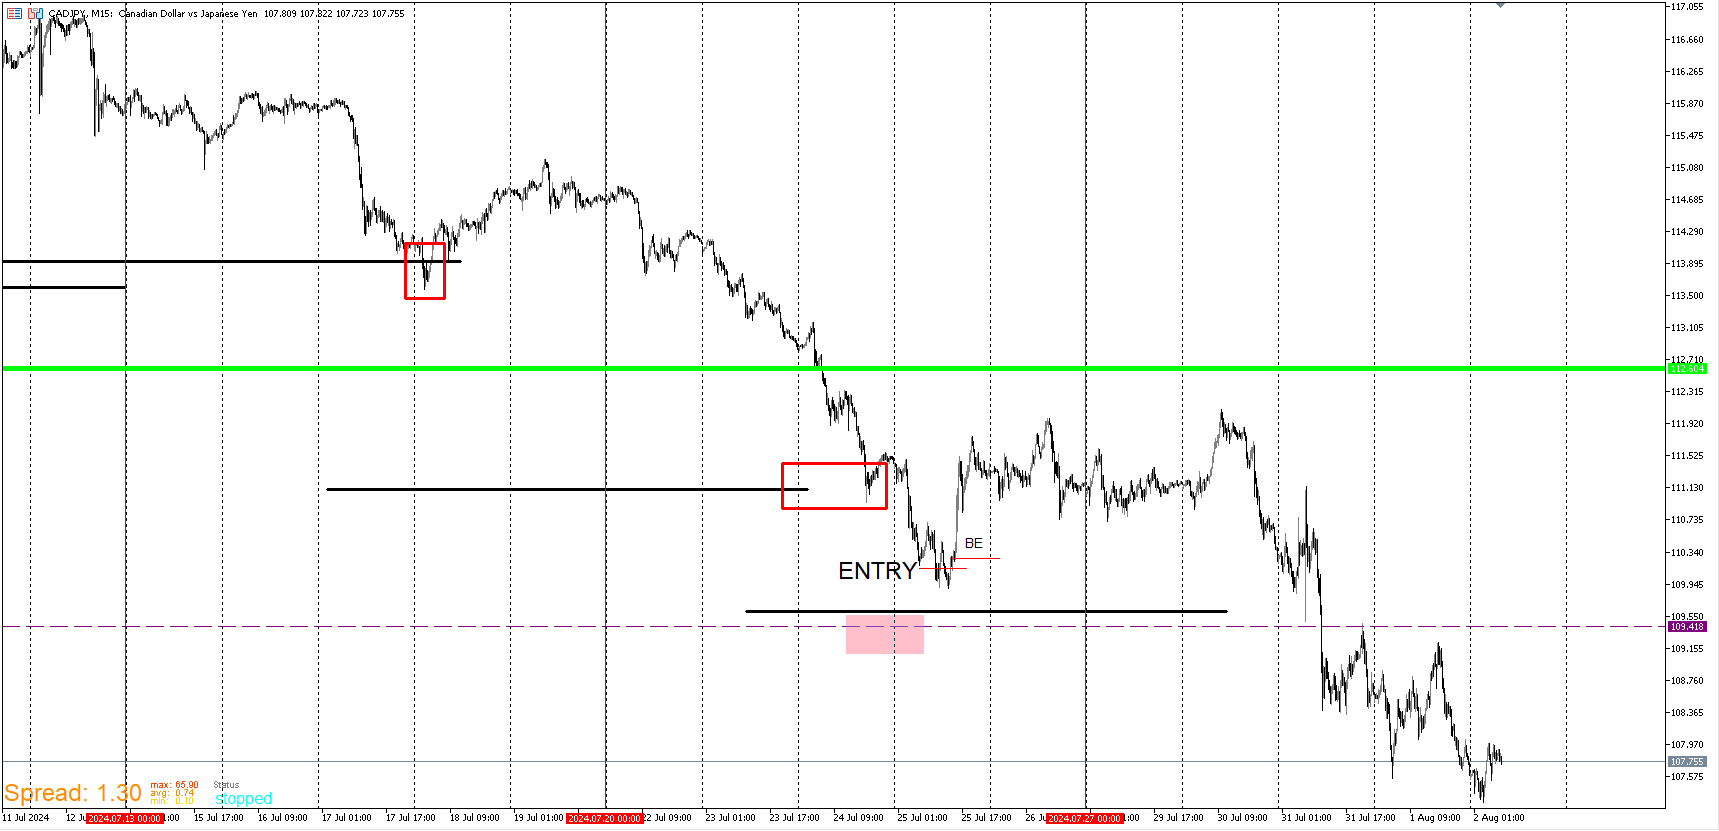
Update on the yen pairs here. Instead of entering at the original entries I posted, I entered short of it because there were buy clusters right above the wall. Price did push up and I placed my stop at break even because If I believed that price wouldn't go down any further that was a safe break even point. It held up for some time but price came back down past my levels further. So I was wrong but I didn't lose any money. When price pushes up so far and dips down to walls, I'm more hesitant which is why I didn't enter on any of the above walls. There still may be downward momentum so I will step out the way.
USD/JPY
EUR/JPY
CAD/JPY
-
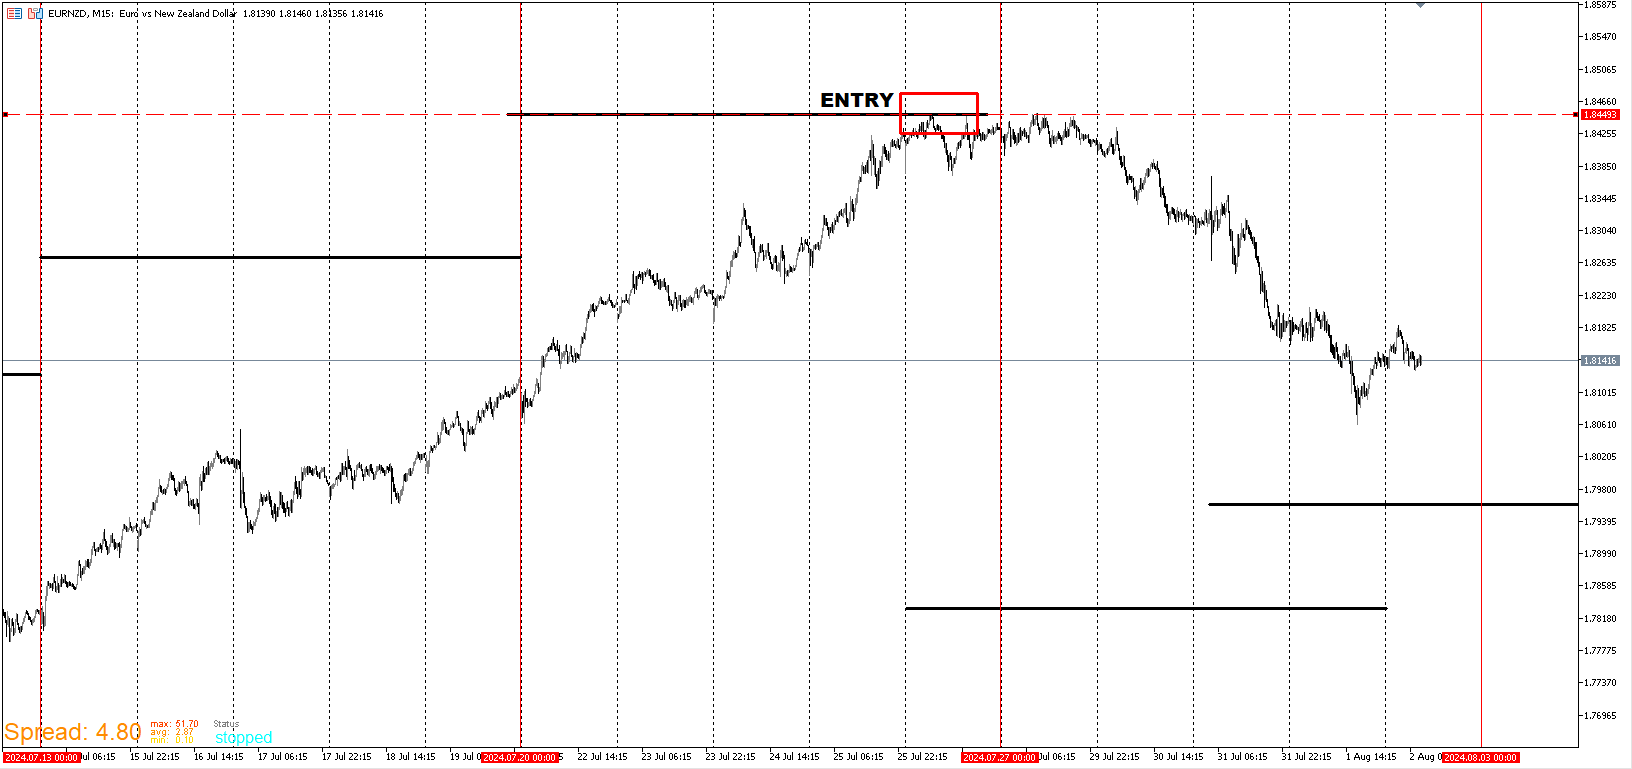
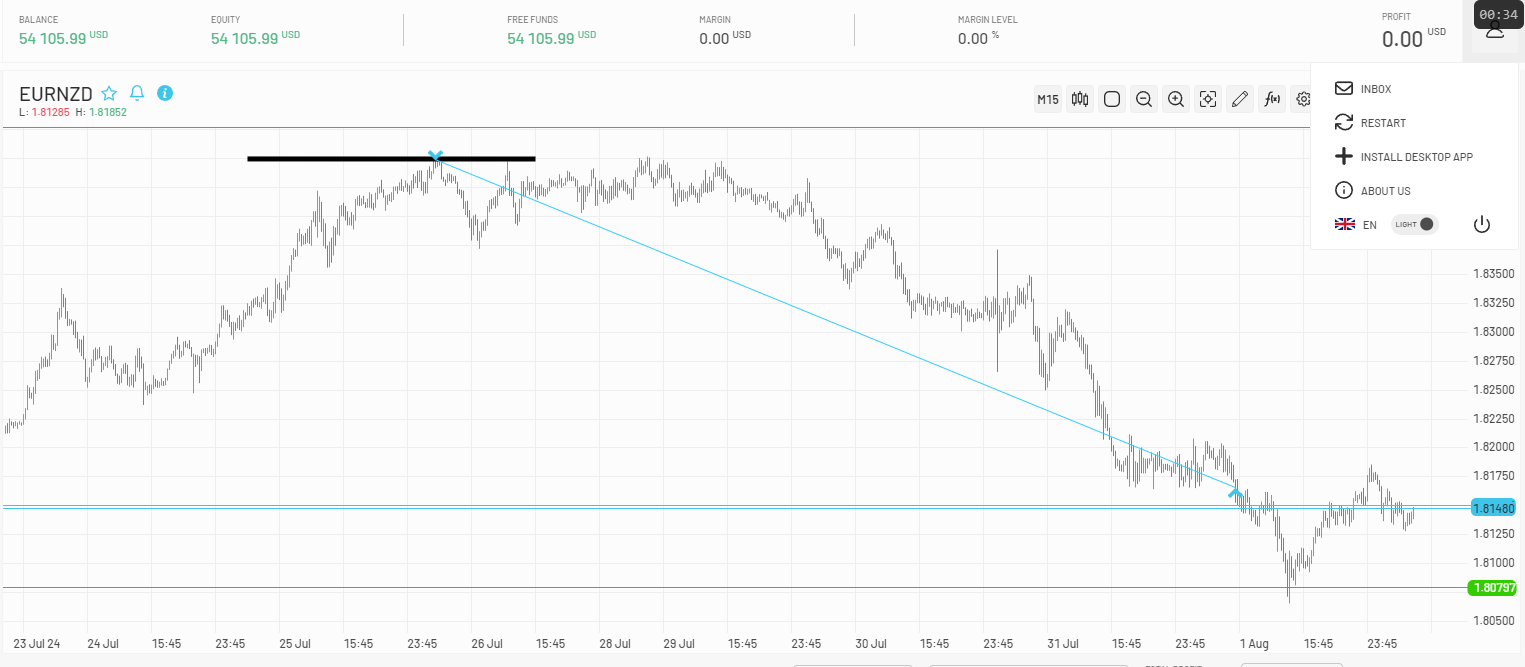
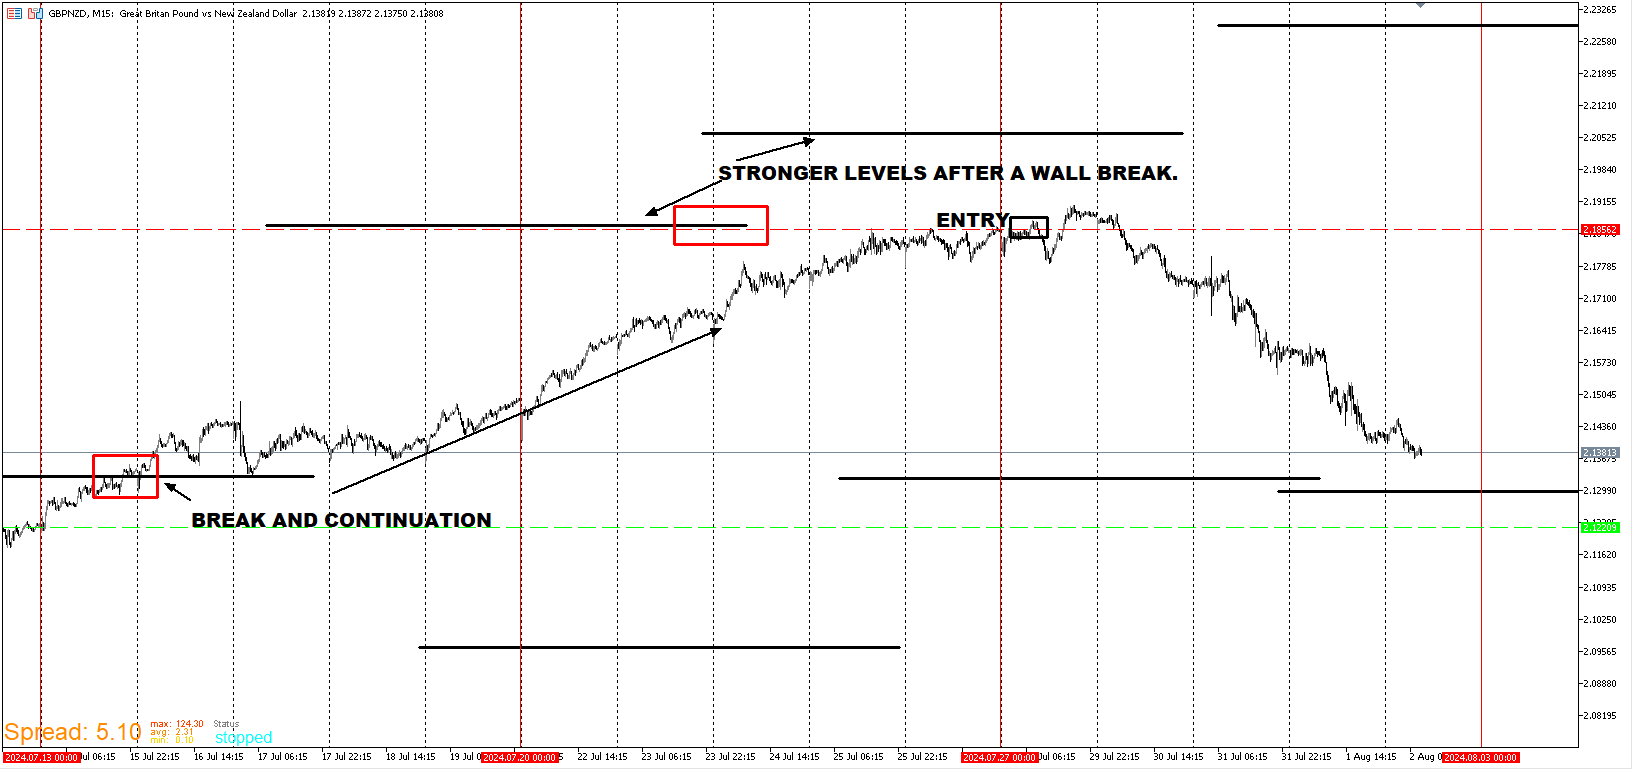
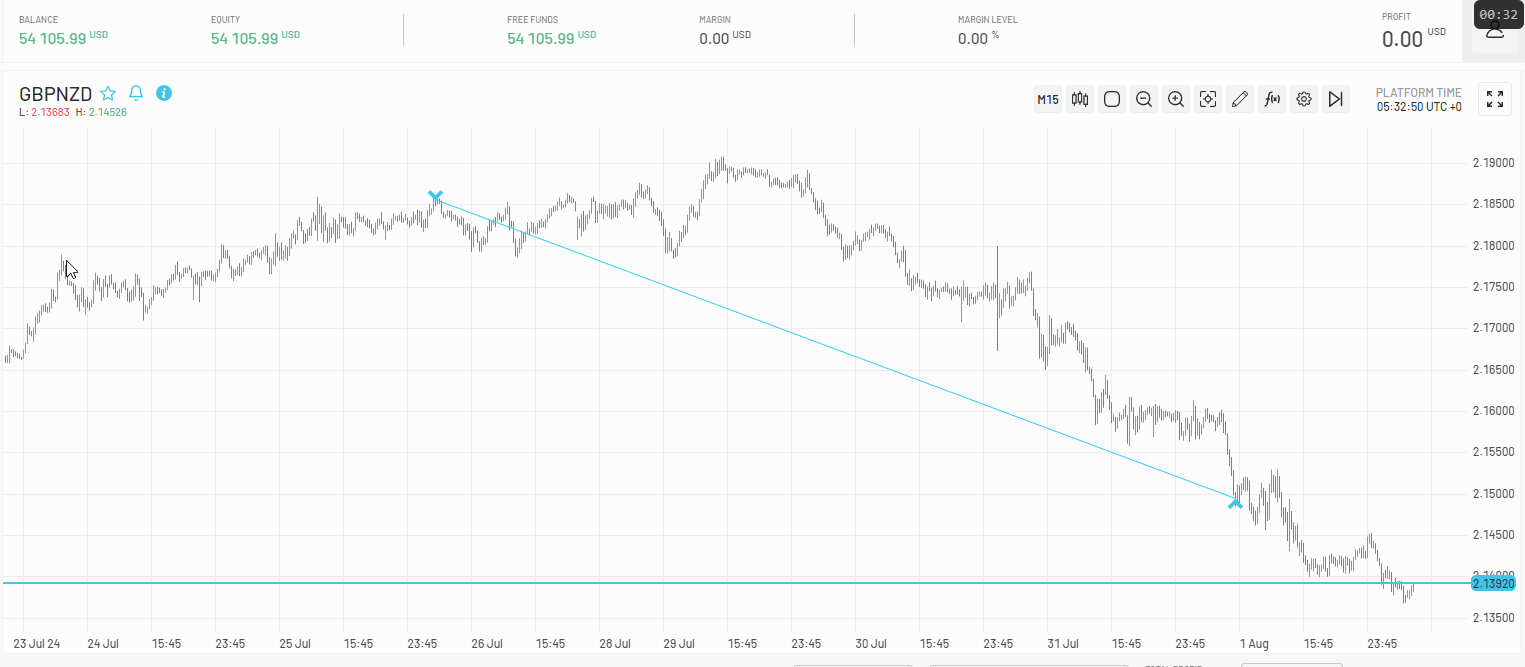
I did post GBP/NZD and EUR/NZD a couple of weeks ago I believe because they were approaching walls but I was looking for an aggressive push up that never happened. I waited and for GBP/NZD, price slowly grinded past the was and done so substantially. I waited up price neared the upper walls and for EUR/NZD to contact a wall. That's when I took the short entries. These entries were taking on an evaluation and passed. I continued short on the second eval but closed with some profit instead of aiming to pass it. The GBP/NZD stop was a bit wider than the EUR/NZD because it tends to extend out more even when both pairs move in the same direction. The goal with these strategies isn't to be right all of the time because it's not possible. But to still be profitable when it's not timed right and the profits come from big moves with little drawdown.
-
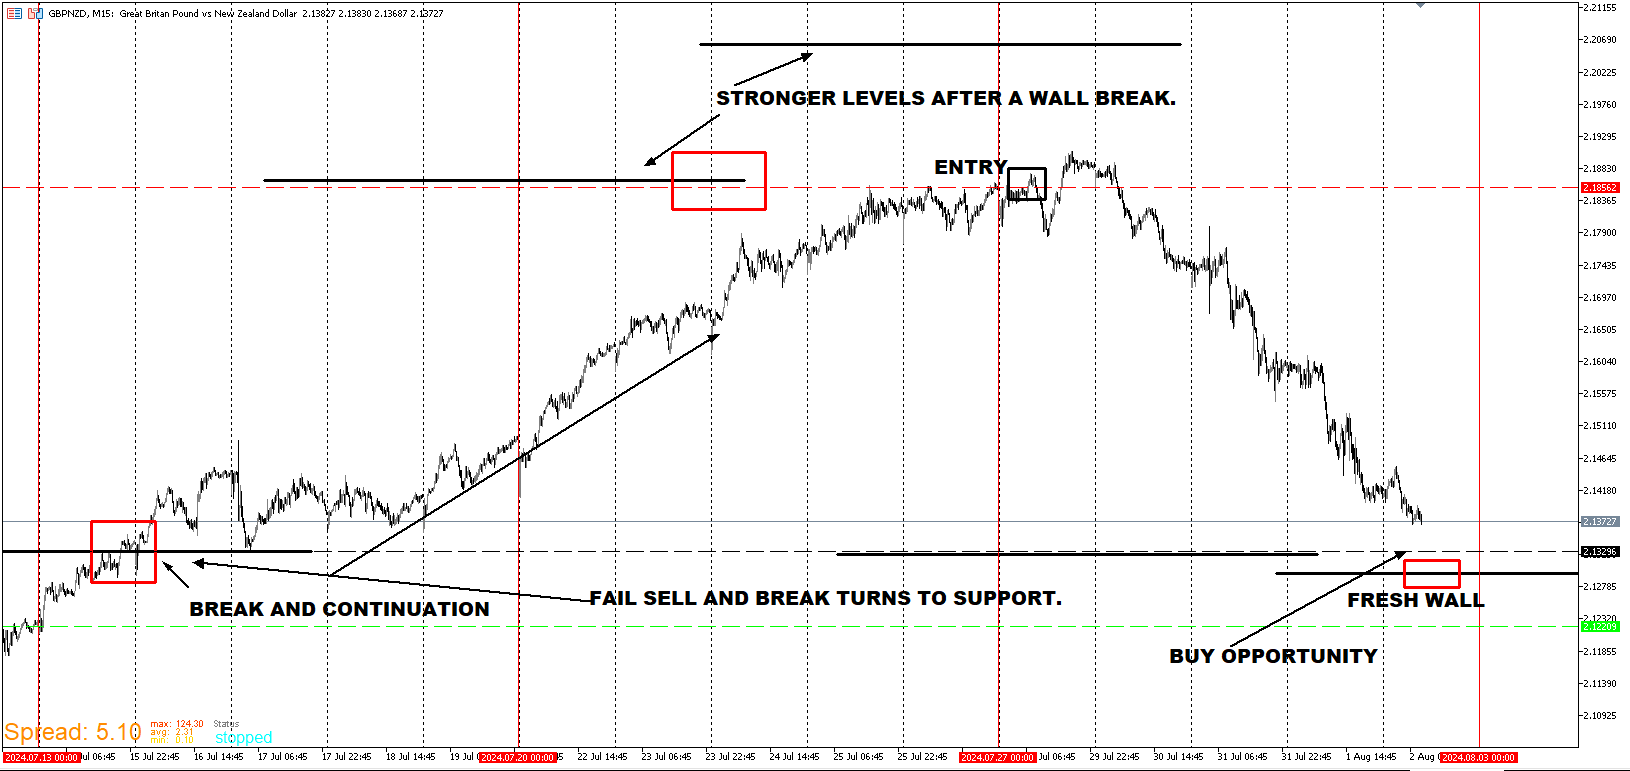
I will take a buy at the previous wall level that was broken. There is a fresh wall underneath as well.
-
It has been a while since I last posted but I have been hard at it nearly everyday creating new ideas and templates as well as testing trades in the live market. I will release some material regarding what I've come up with as well as more predictions. I know it's been a bit and the more I experiment and put stuff together, the more I learn and know what to look forward to to get better at achieving what I aim to achieve. Some information in this thread shouldn't be taken all that seriously and that's why I don't post every idea I have because some stuff isn't all that useful. Stay tuned.
-
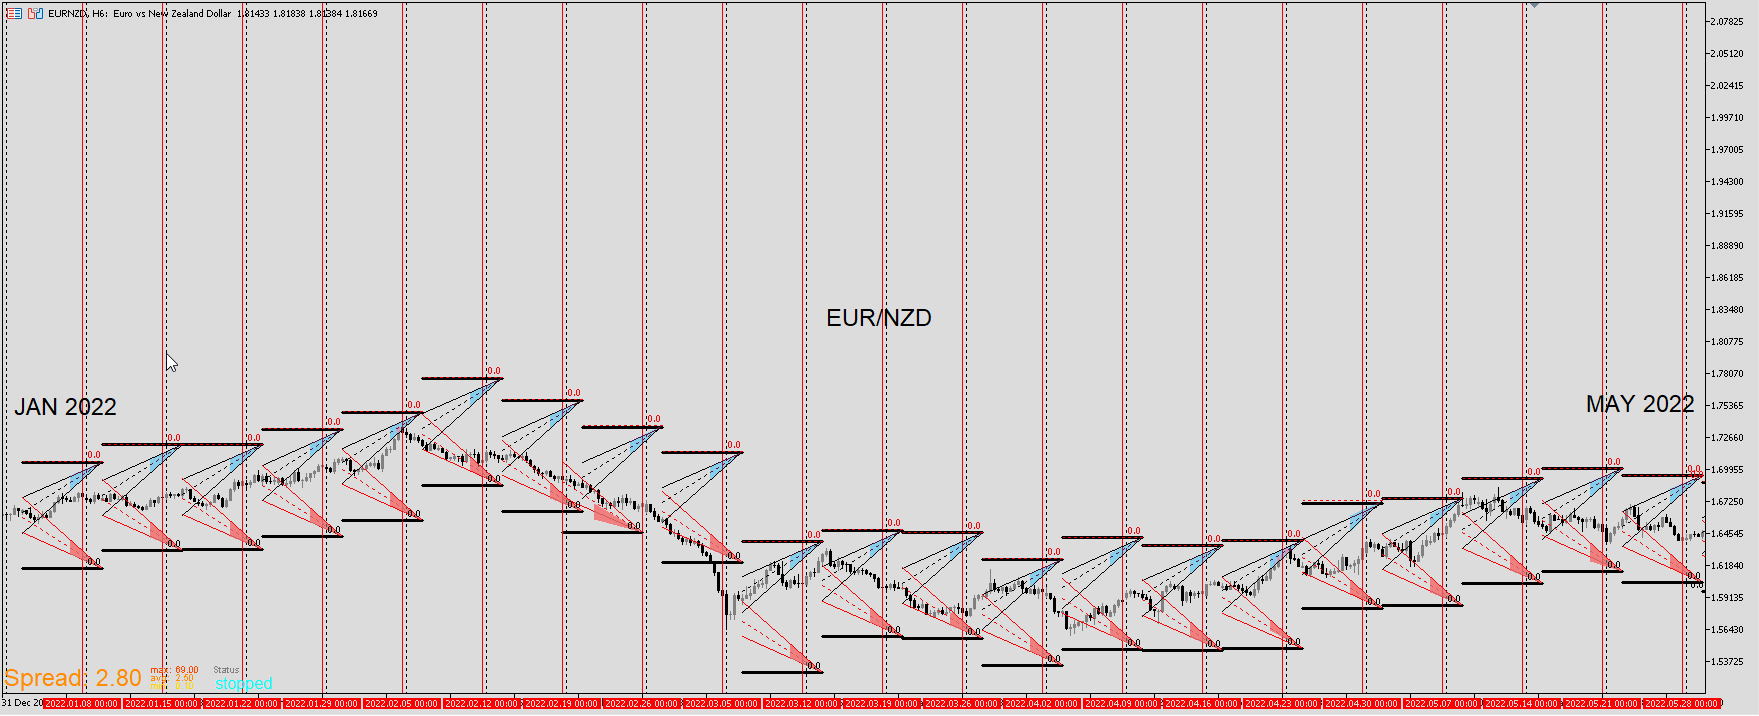
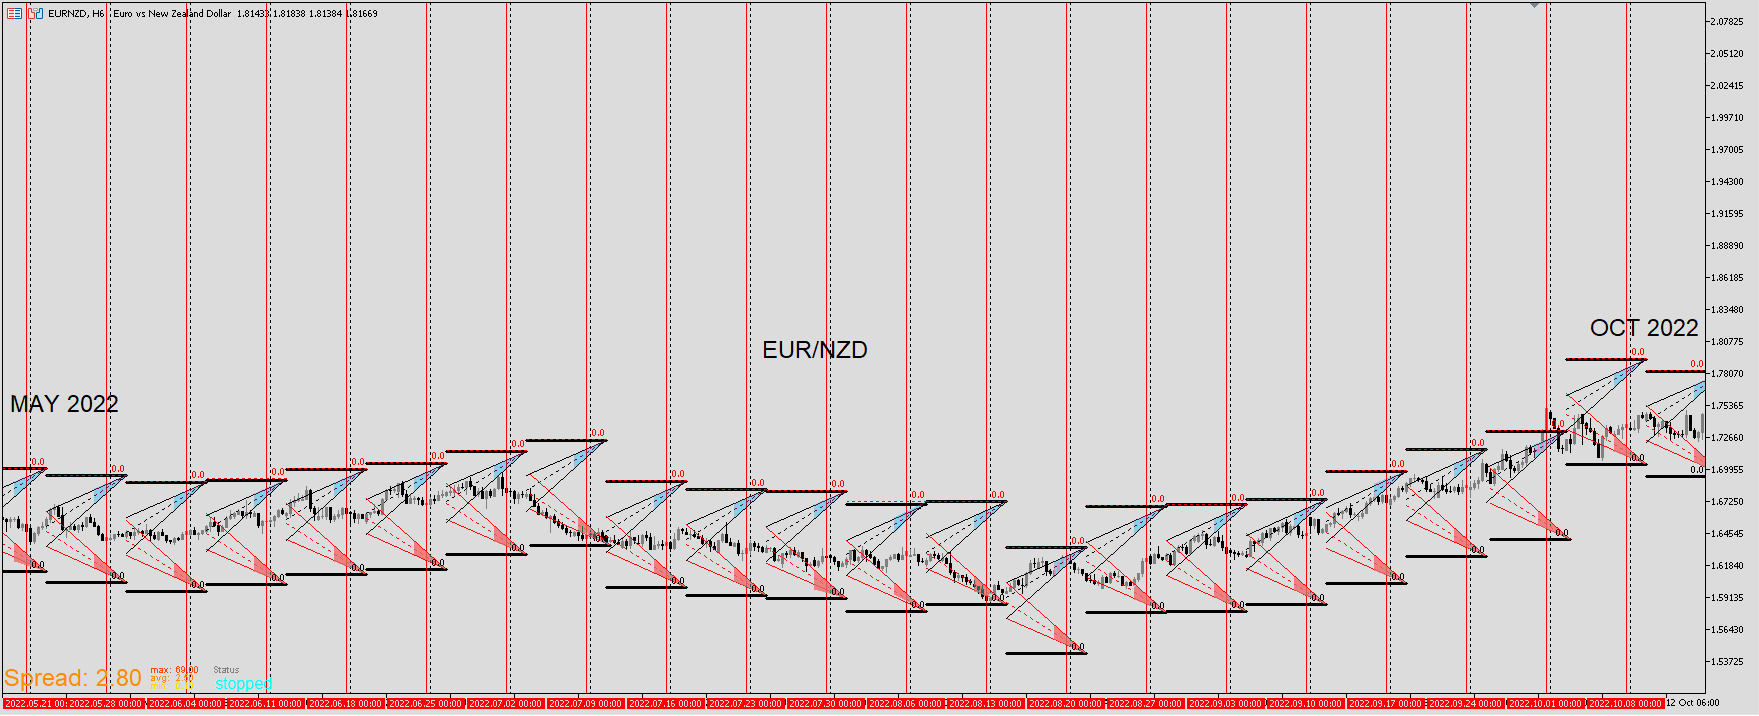
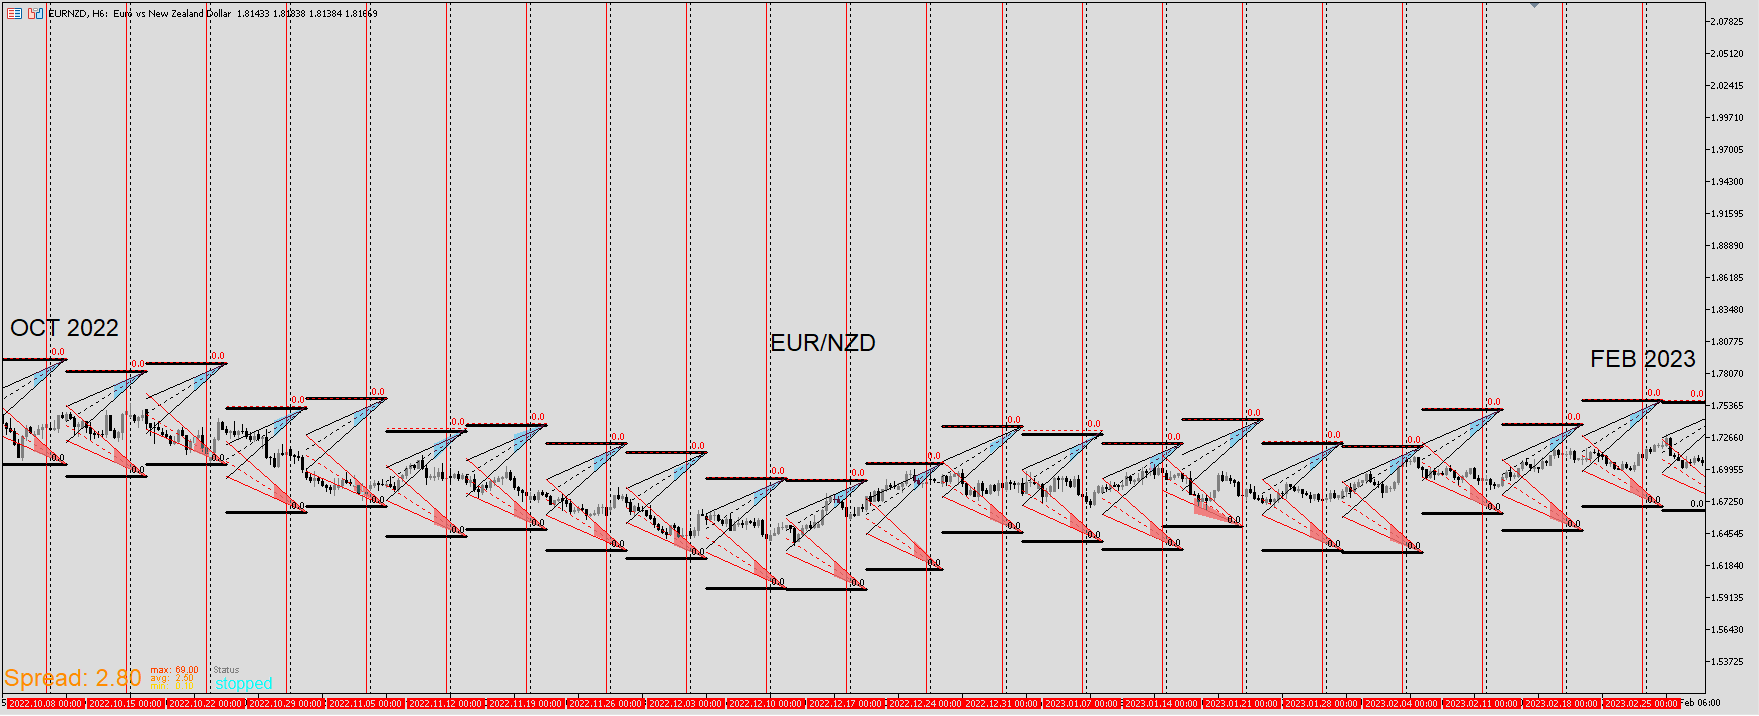
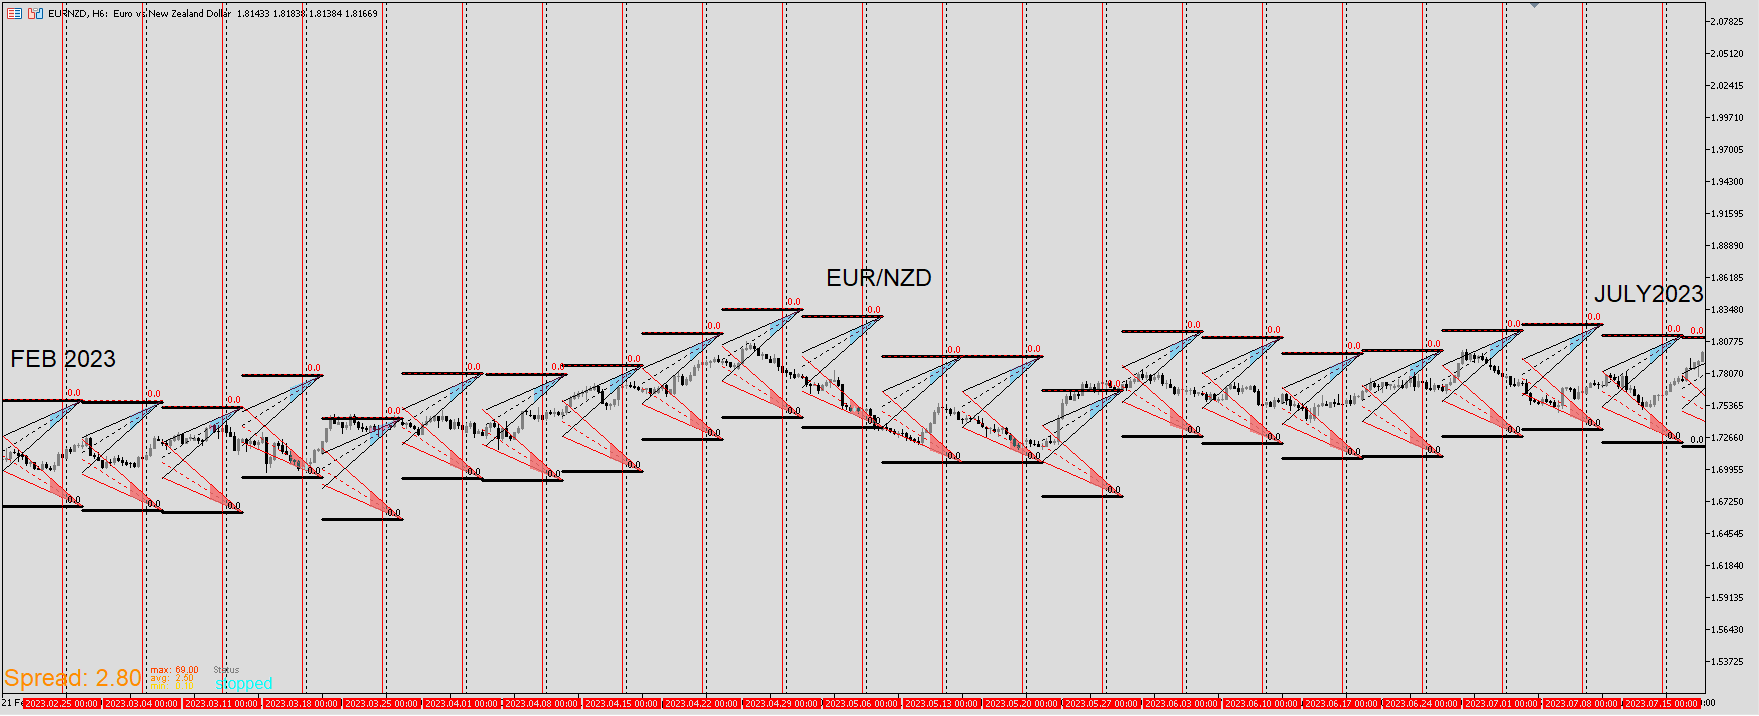
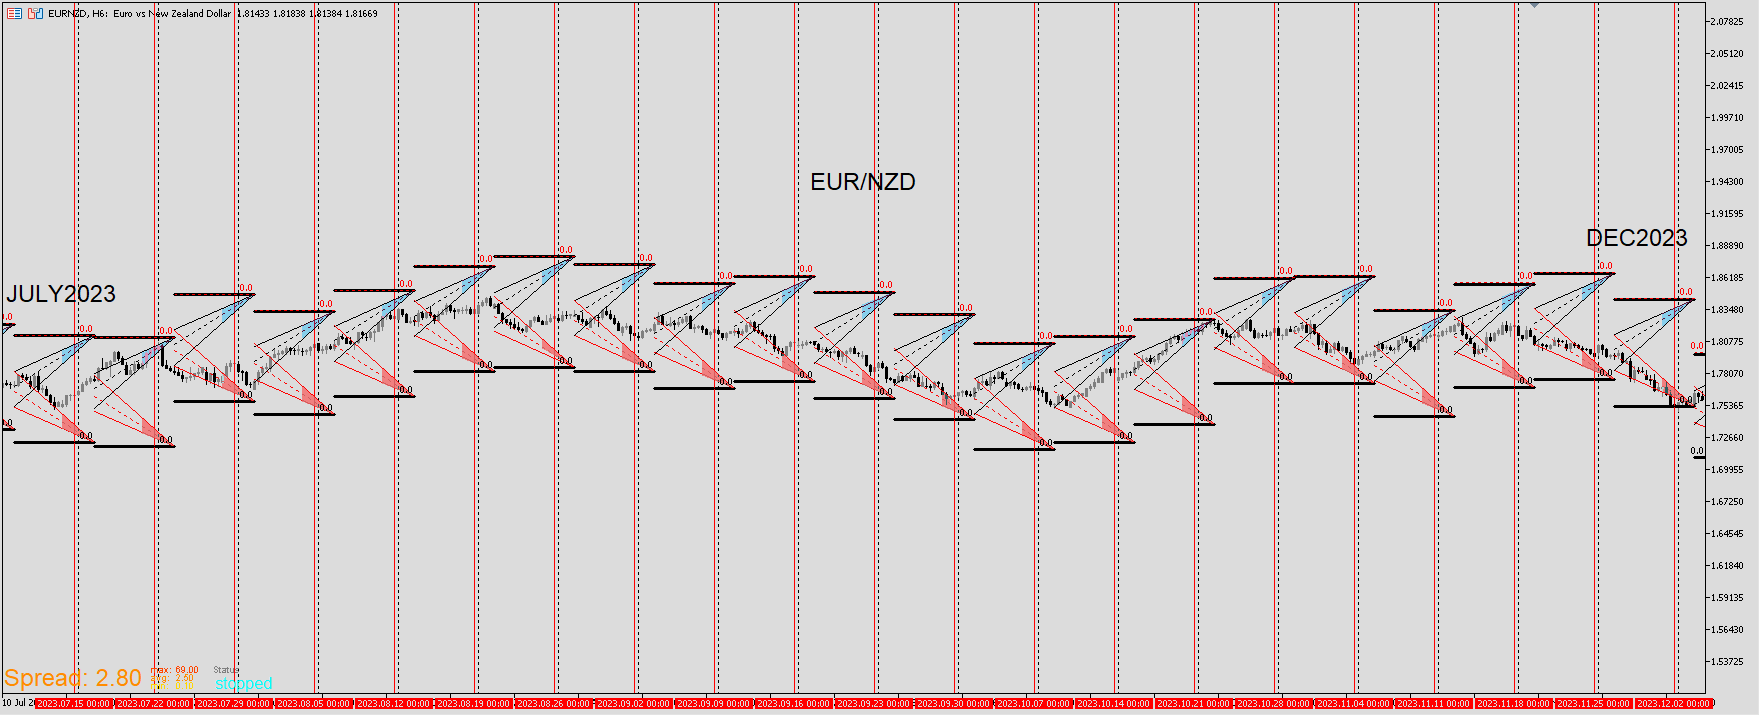
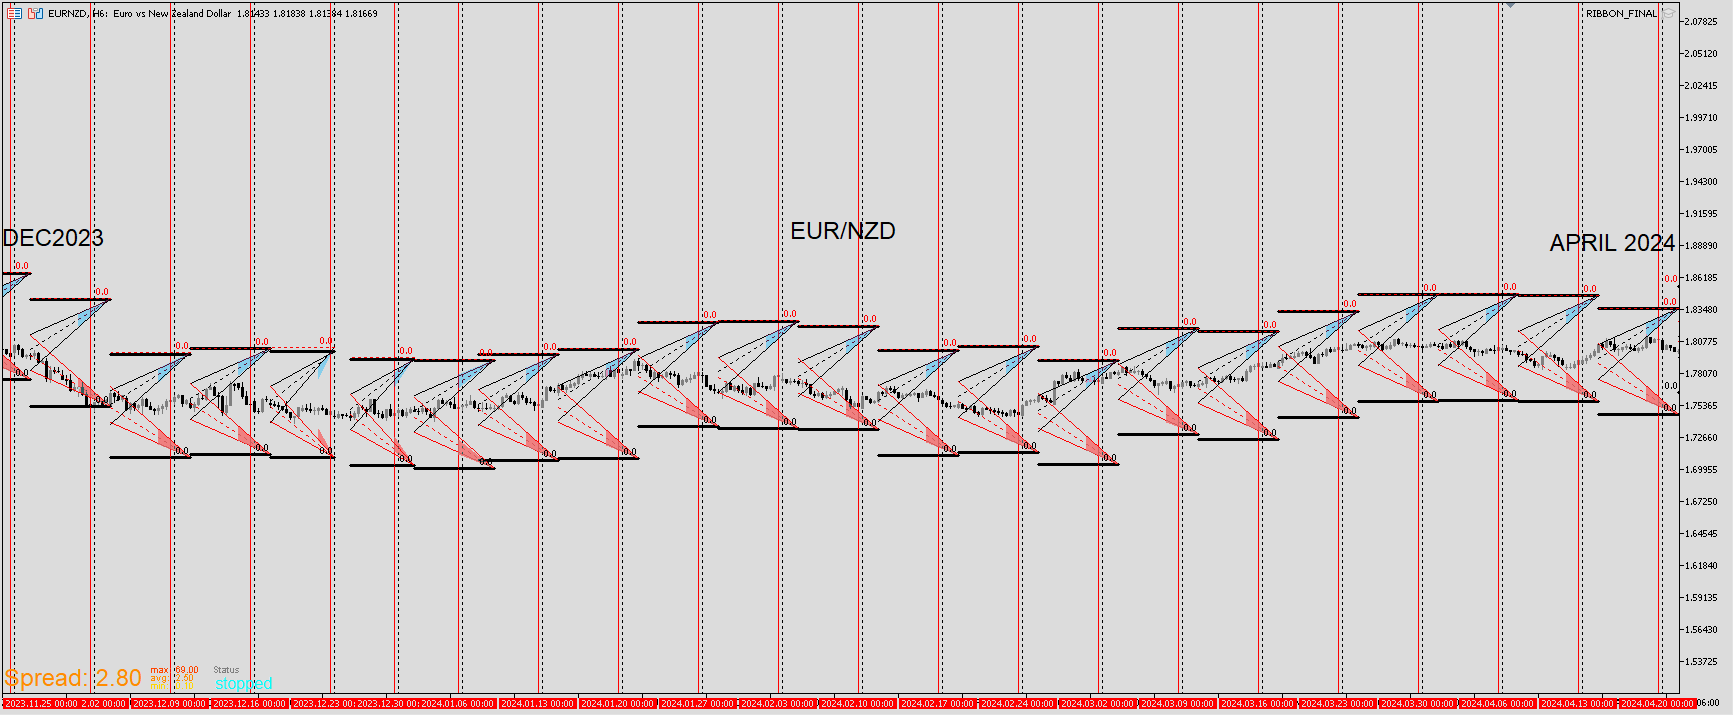
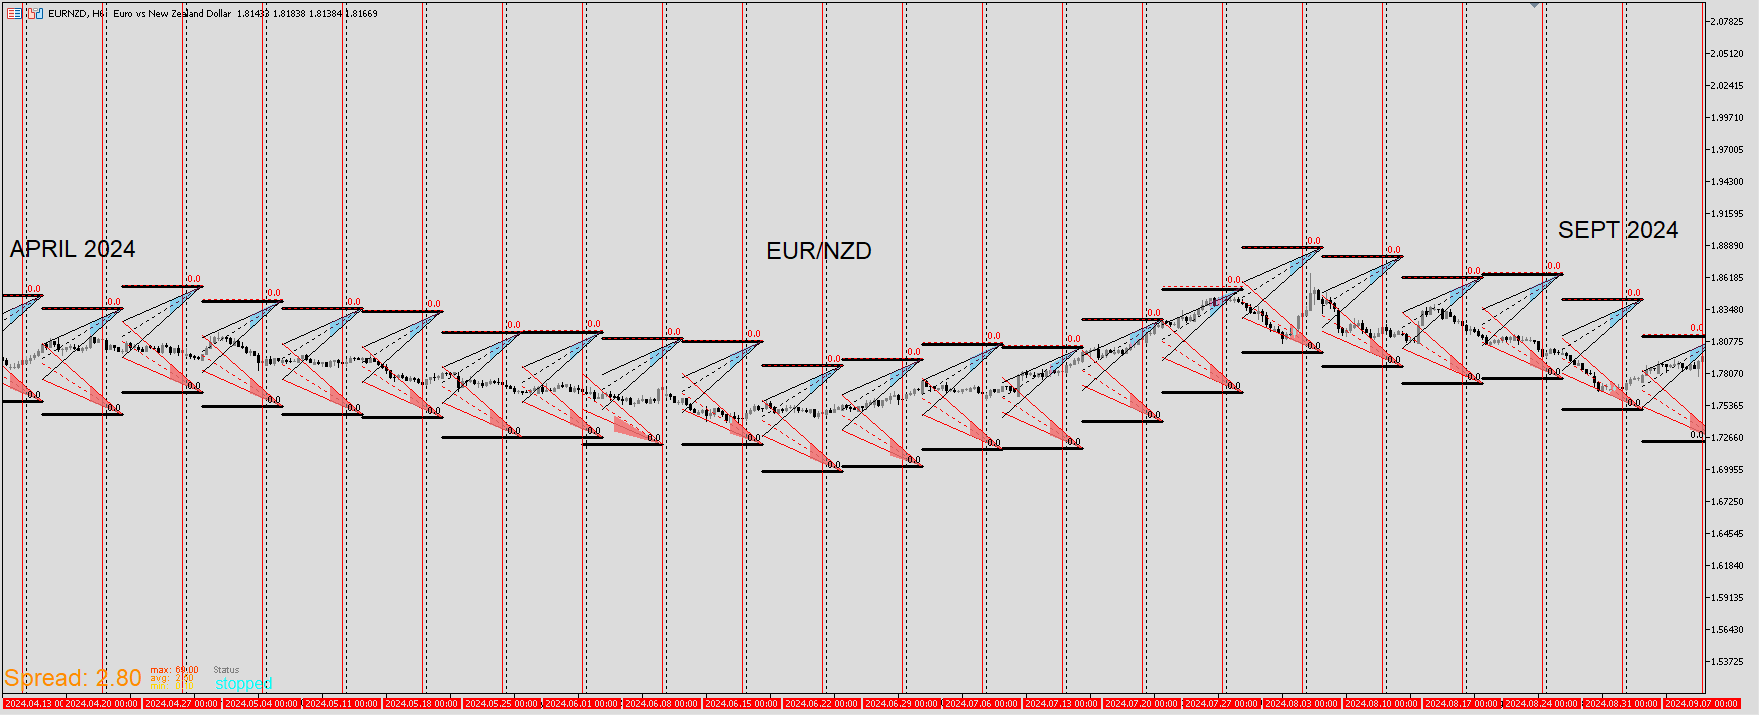
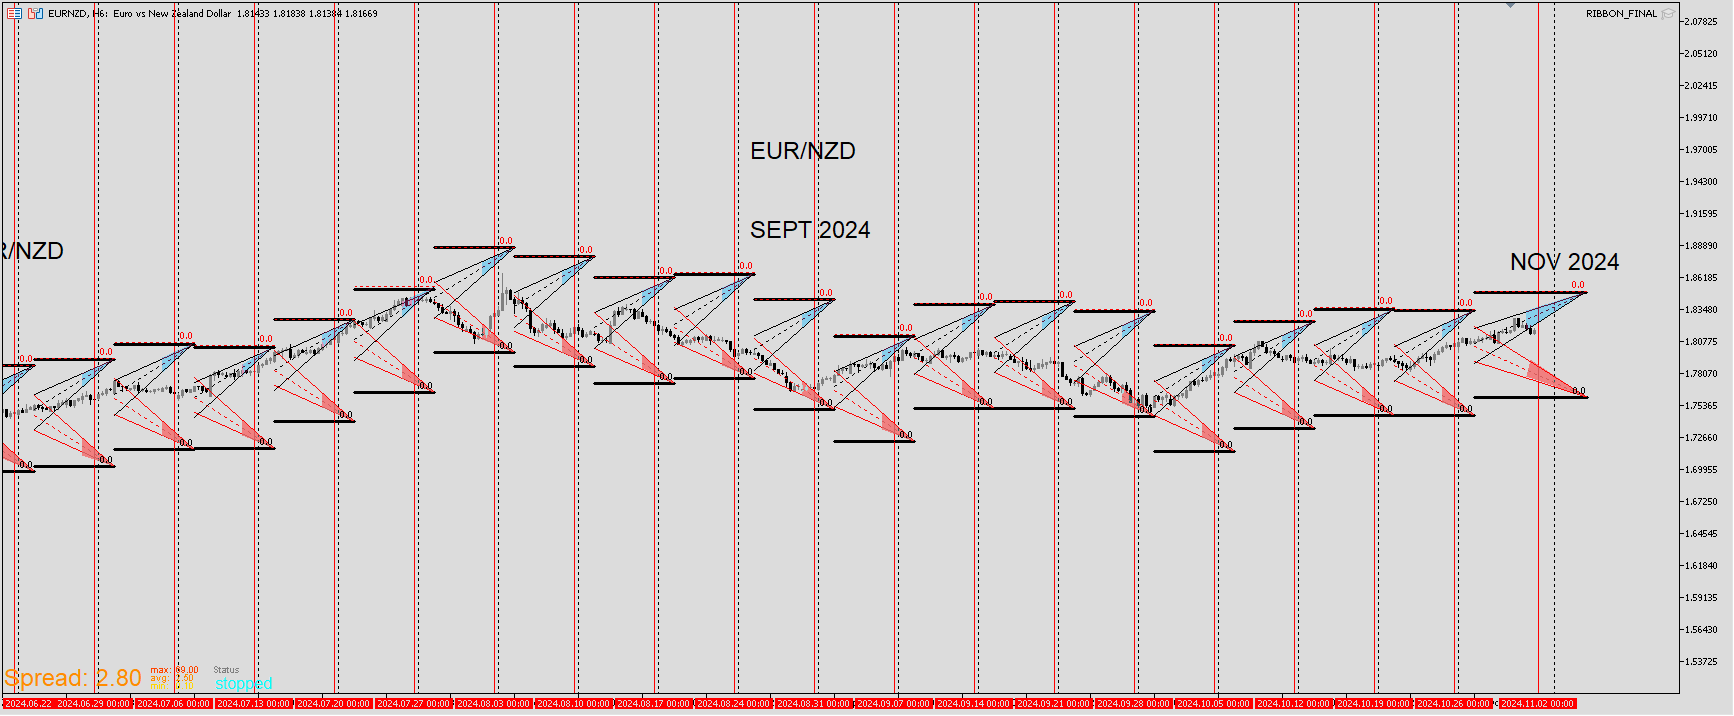
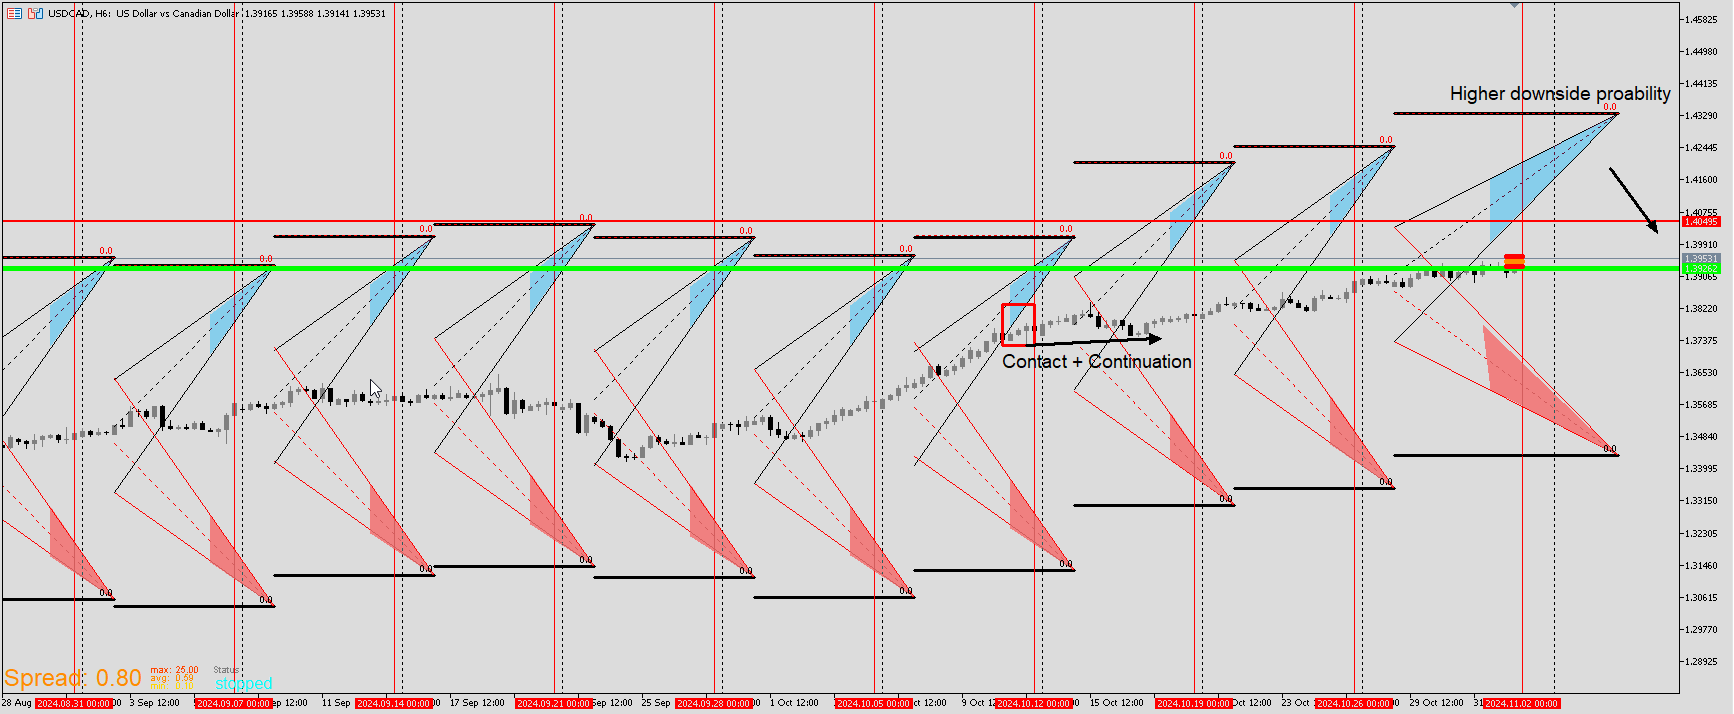
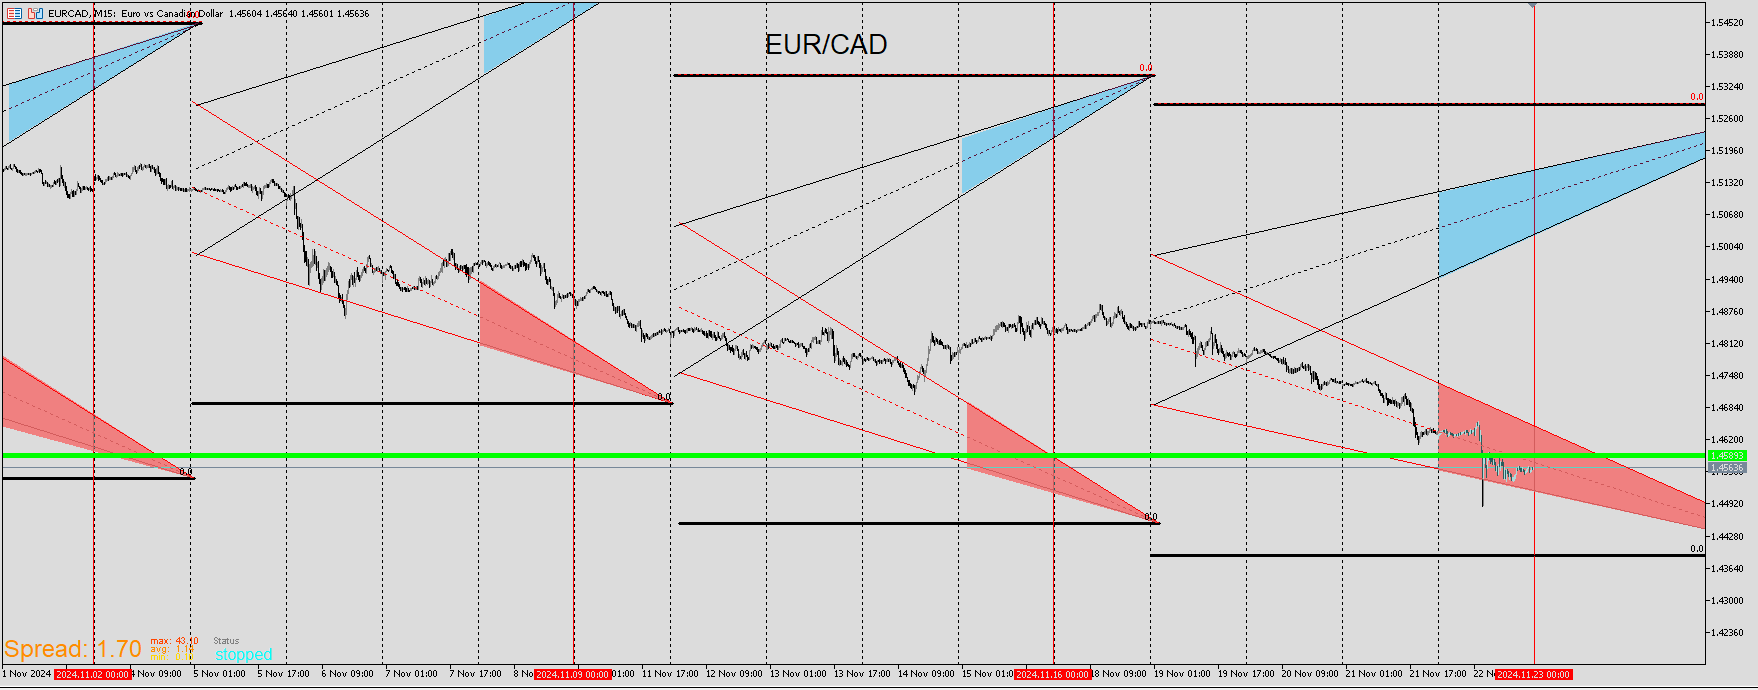
I will continue where I left off and demonstrate what my templates are currently forecasting. For a while now I've been coming up with ways to build reliable strategies for intraday setups. I have finally came up with a couple ideas and I'm currently testing them live. I was able to achieve them through reverse engineering my wall template and combining correlation techniques. But before I get to them I'd like to show and updated more improved template of the wall. It's the same principle but I decided to get rid of the extra lines and narrow it down to just 2. One top and one bottom for each week. I also marked the ends of them with zones that I expect price to reject. Not every touch of them will be a rejection but it's still useful information to have. I have other templates and methods to help decide to enter or not and this is still strong and okay on its own. I call this the ribbon template because it somewhat resembles a ribbon. As mentioned before, these templates are designed with rarity in mind. Meaning that yes it is possible that price can break and continue, But it's rare and even if it does happen, a reversal becomes much stronger.Price doesn't not drop nor rise for weeks at a time all the time. Very rarely price will breach and continue before reaching the colored triangle zones. If it does intend to go lower, it's much more likely to use those zones as a magnet to do so.
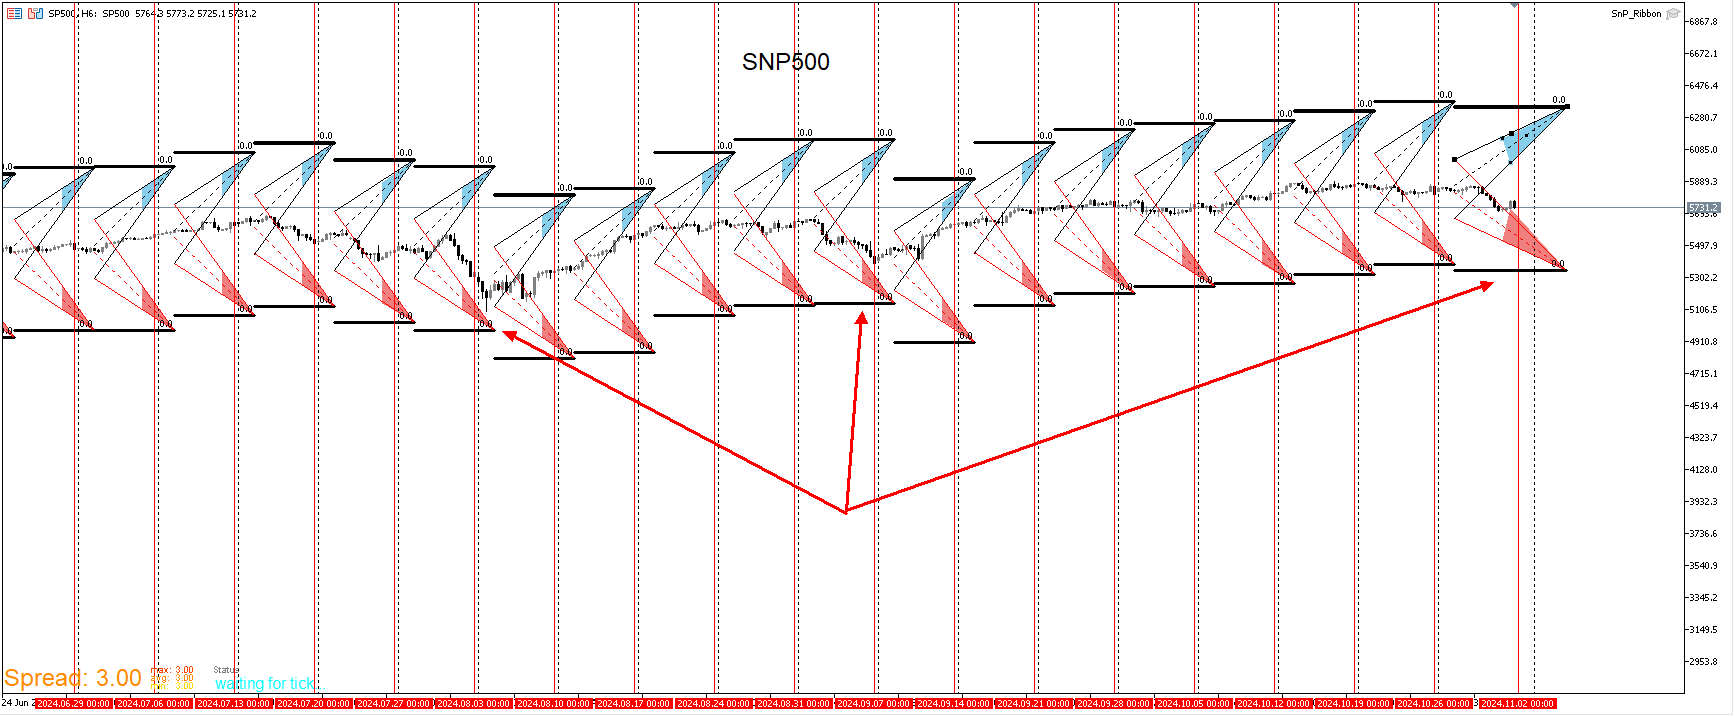
I've also been adjusting my EA's to indices,metals,and commodities. There's still some work to be done but here's a version of this template for the SnP.
-
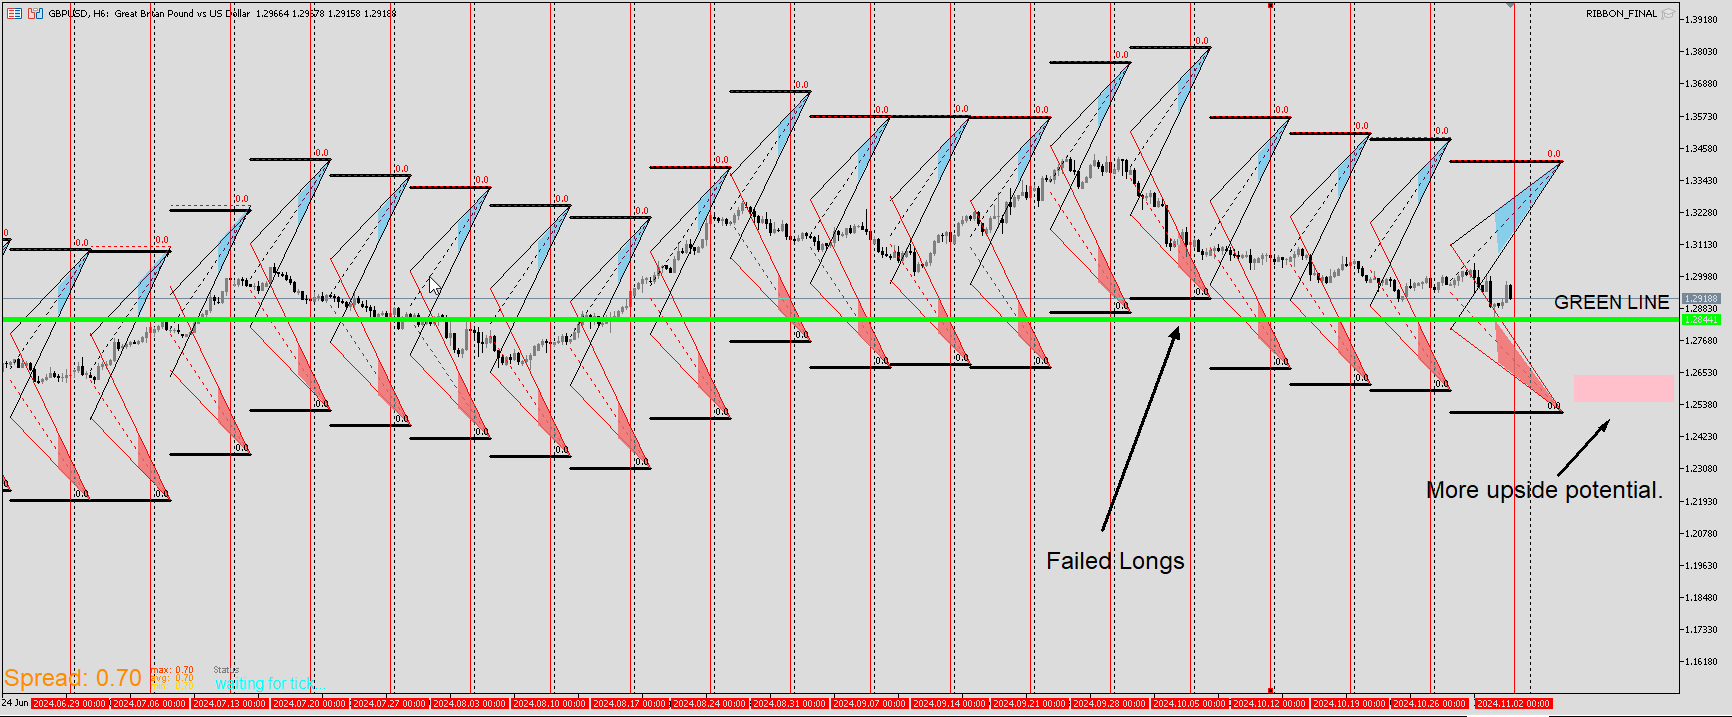
I would post more examples but it would take a while but what I will do is post upcoming relevant signals starting with GBP/USD.
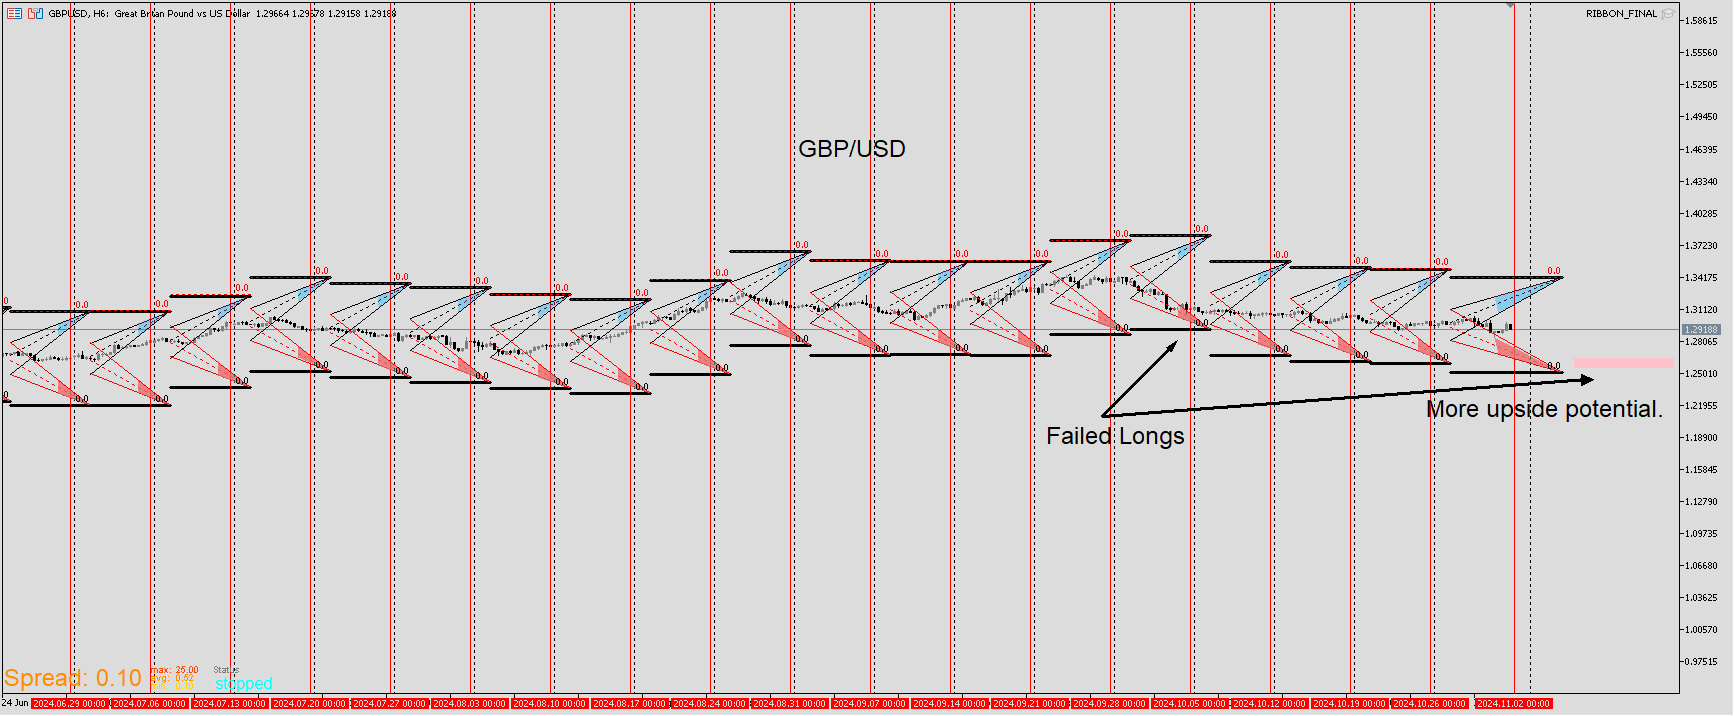
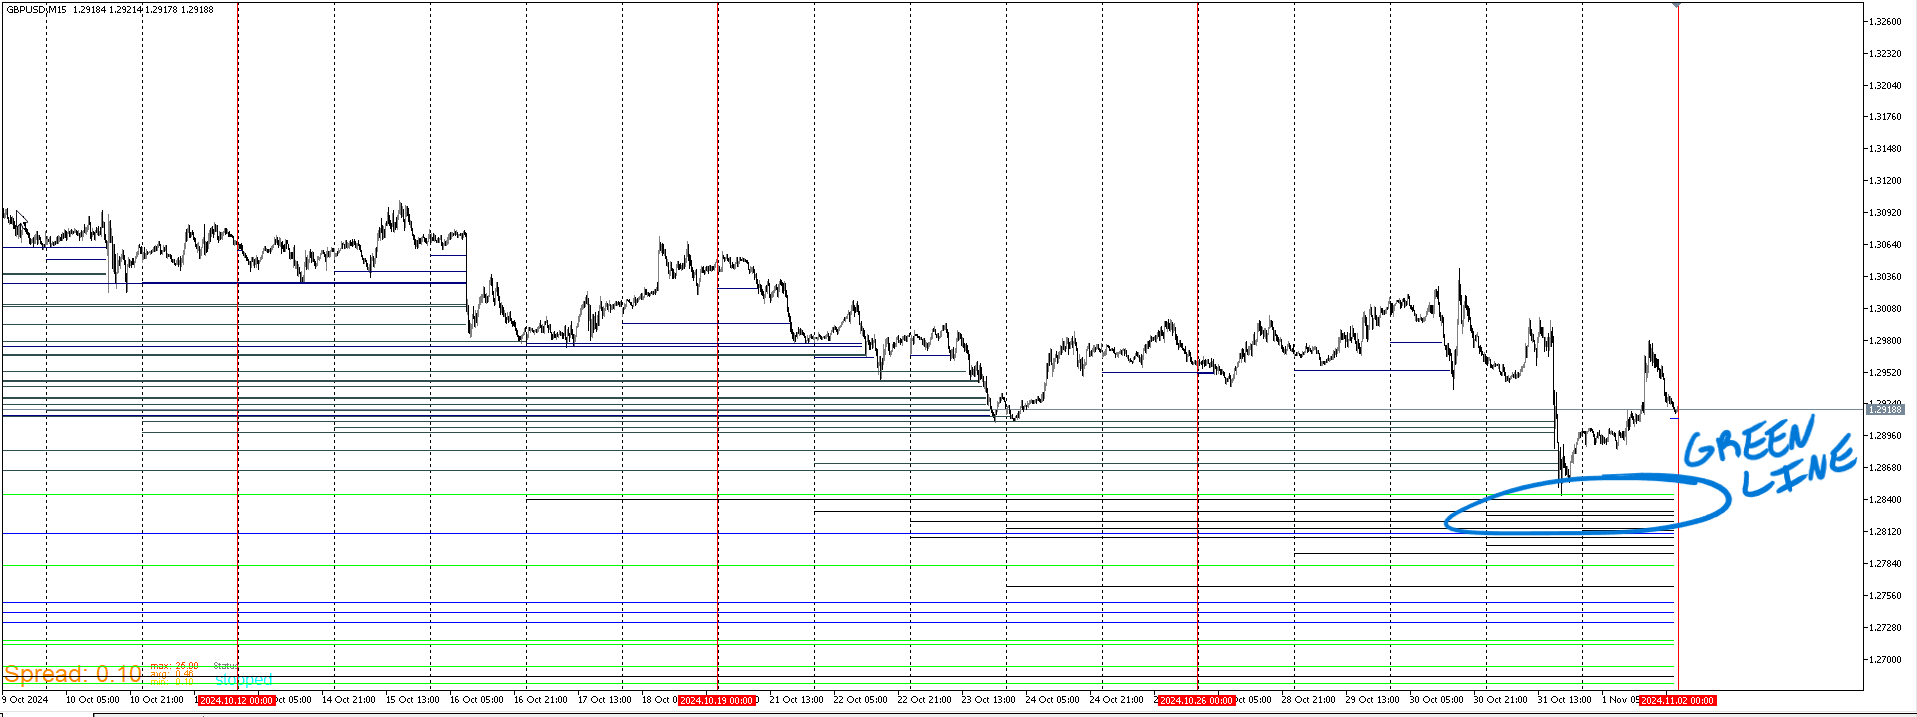
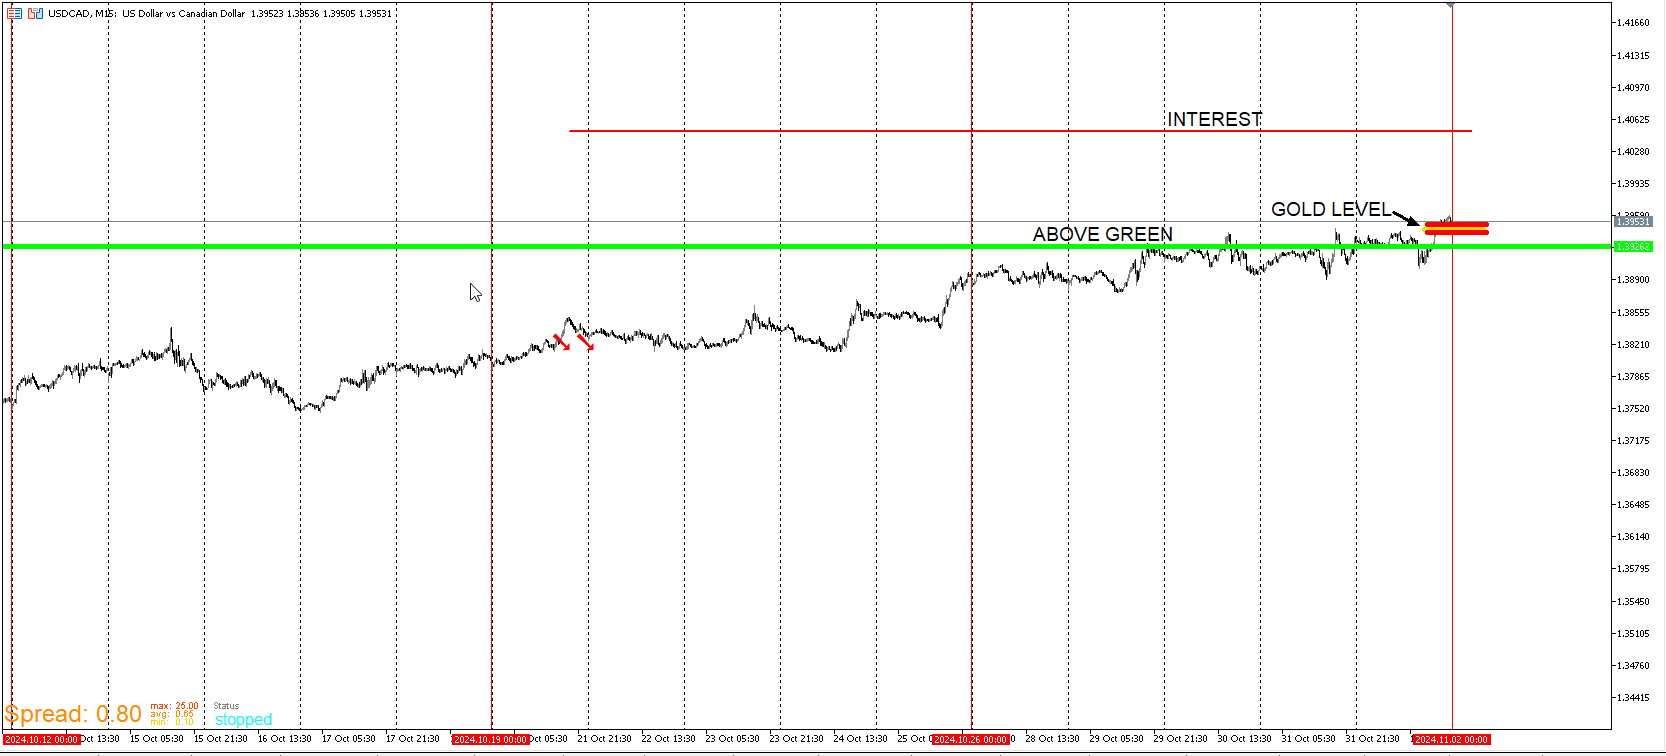
The Green line template is used to filter out from entering early. It's not applied to a live chart and only the backtester is used to get the price value of the topmost green line when going long. Very rarely price hit's it to the tick before making a substantial move. I need to see price do some work below. How far below is determined by other algos but as of now I wait even if price moves up a little.
-
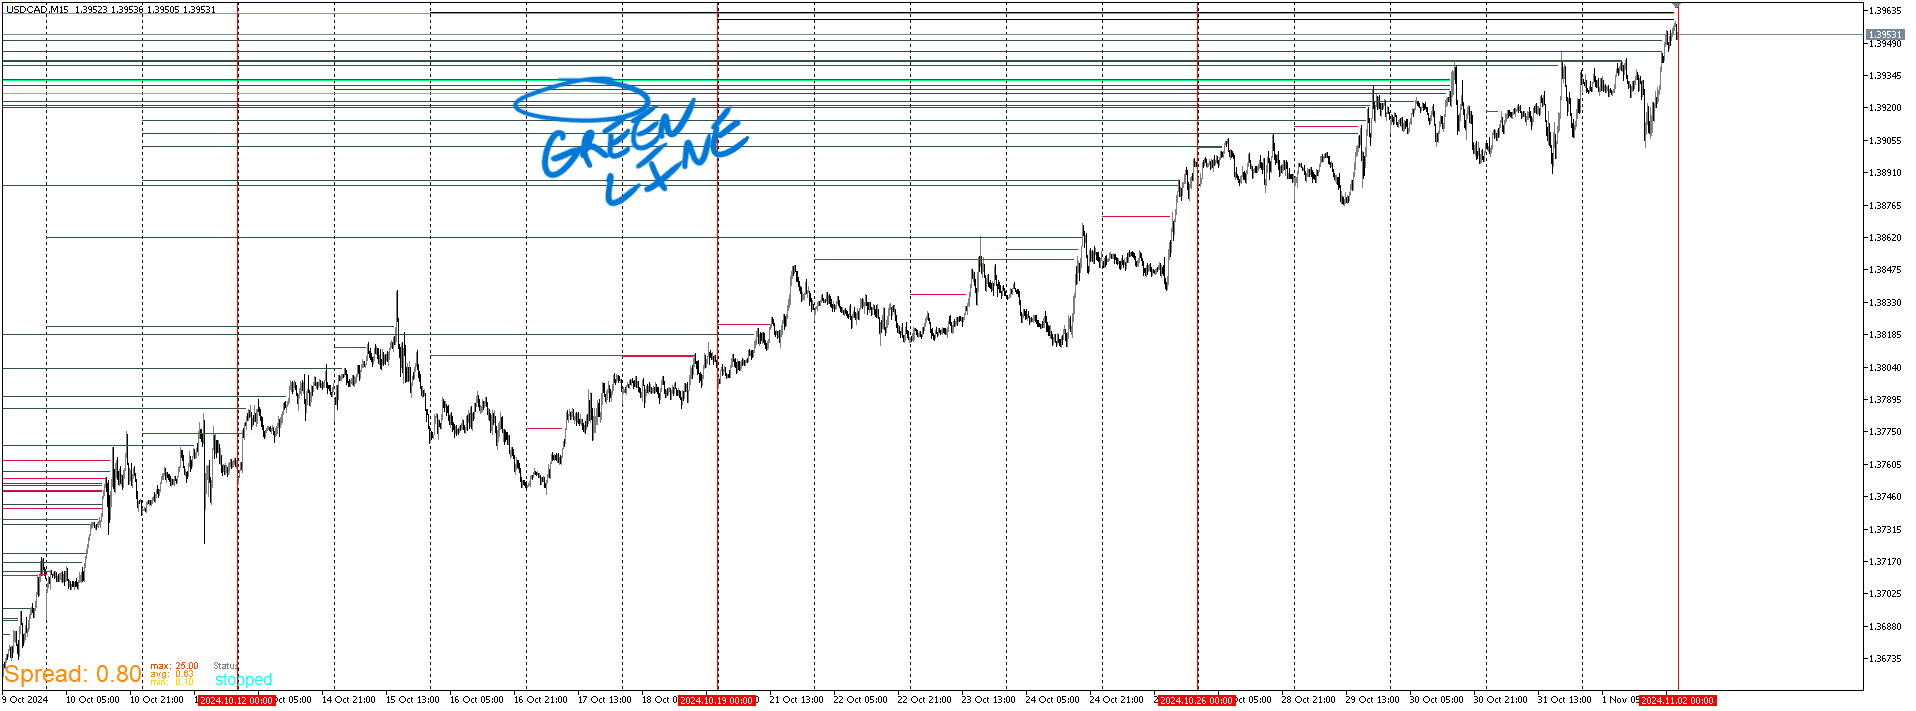
I'm also monitoring a USD/CAD short setting up.
-
Really interesting. Could you please share some myfxbook/fxblue performance results for them?
-
@l-andorrà At the start of next year I will dedicate accounts for certain entries so that the results will be restricted to the EA used to make the decision. While I do take most entries that I post here and make pretty good profit assuming that my limits are hit, I still take other trades to test out other EA's and sometimes they don't work out and I don't want those results to be representative of the ones that take a while to set up and work. So I'll set up a swing/positional account so that my intraday strats don't affect it. I should have done it a long time ago and used demo but I'm still learning. One thing that can't be denied is the accuracy of the predictions because I post them before or as it happens and I do show screenshots of entries.
-
Nice. I'll be waiting for it.
-
Back with potential setups. I will introduce a couple of EA's that's been built around the Wall EA. I will be showing the thought process behind them and will apply them live this coming week. It's nearing a year of this thread and though I don't post often, I have been spending much of the time building on ideas and extrapolating what I believe to be useful elements and expanding on them and eliminating things that may not be all that useful. I can say with confidence that I feel pretty good about what I've come up with recently. It may seem confusing at first but there is logic to it but the goal is for the output to deliver a straightforward simple visual as I'm am someone who understands things better visually. I don't use Fundamentals, Reports, Etc. I don't think that stuff is important for my strategies because I stress the stretching of price within a given amount of time as well as what a correlation pair is doing. I don't look at market structure in terms of daily highs, lows, weekly this or that etc. I look for opportunities that don't come often while offer substantial reward and I believe that I've come up with some solid methods/tools to spot them.
-
I'll be starting with EUR/CAD. In this example I'll explain why I expanded on the Wall template. Though I still use the original and think it's still useful to have. It's not a great entry tool. I see it mores o as a canary in a coal mine meaning that something is to come. Look up that phrase if you want the full depth definition but that's the gist of it. I don't want to sell on the bottom wall. Price could continue but I'd rather be on the safe side and be long but only if other analysis supports it. Regarding this template, I've always struggled with picking which line. The Ribbon template eliminated that problem as well the green line template. Plus there are templates designed to spot what would be good entries. It's good information to know that price is nearing these levels.
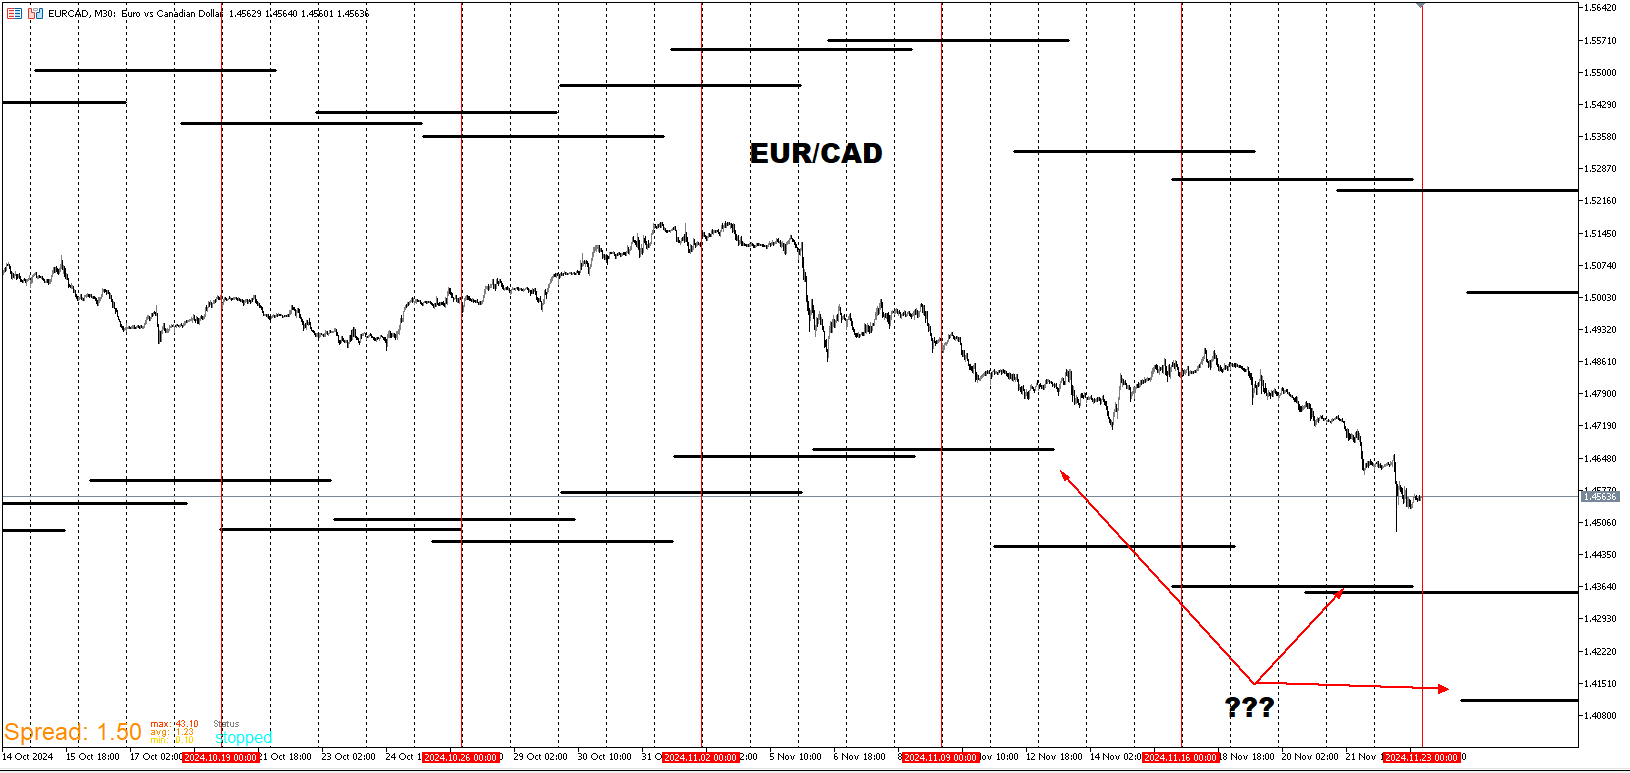
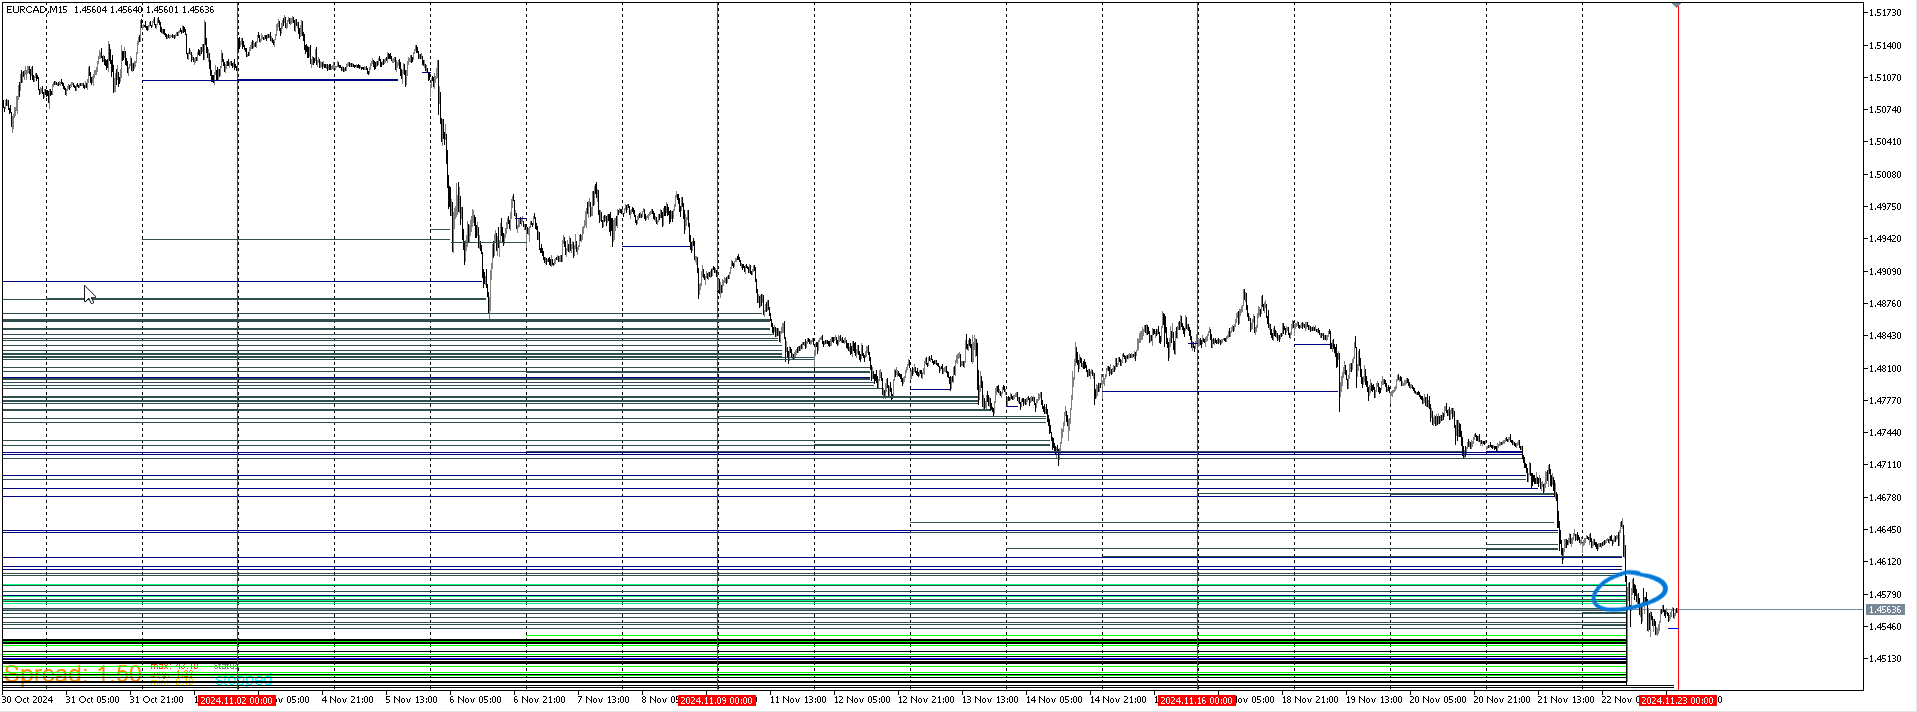
For some reason the most recent week graphic scale is always slightly larger than the previous ones. So price is always slightly higher once the new week is displayed. To counter this, I look for price to be well within or below for a more accurate reading. When price barely touches it, it's fair to assume that the adjusted print will be slightly off but not biggie. This helps to know that it's rare that price will continue down. Doesn't mean that it can't happen. It's just more likely to consolidate and provide some upward movement if it does intend to go lower. There is also a somewhat shallow dig below the green. It doesn't have to go deep every time but fact is the trends worth getting in on start below here. Don't want to be a buyer before price gets below there.
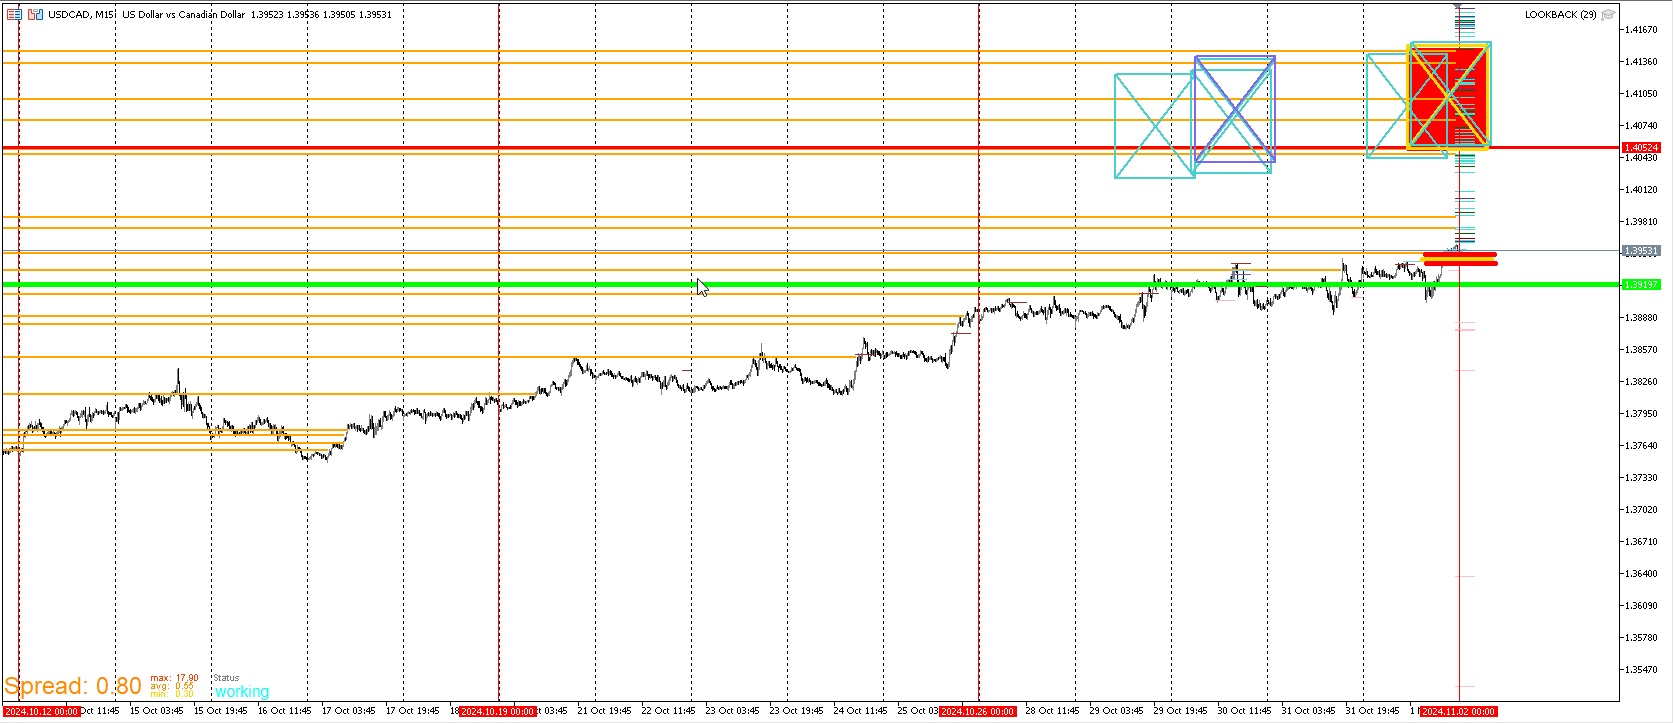
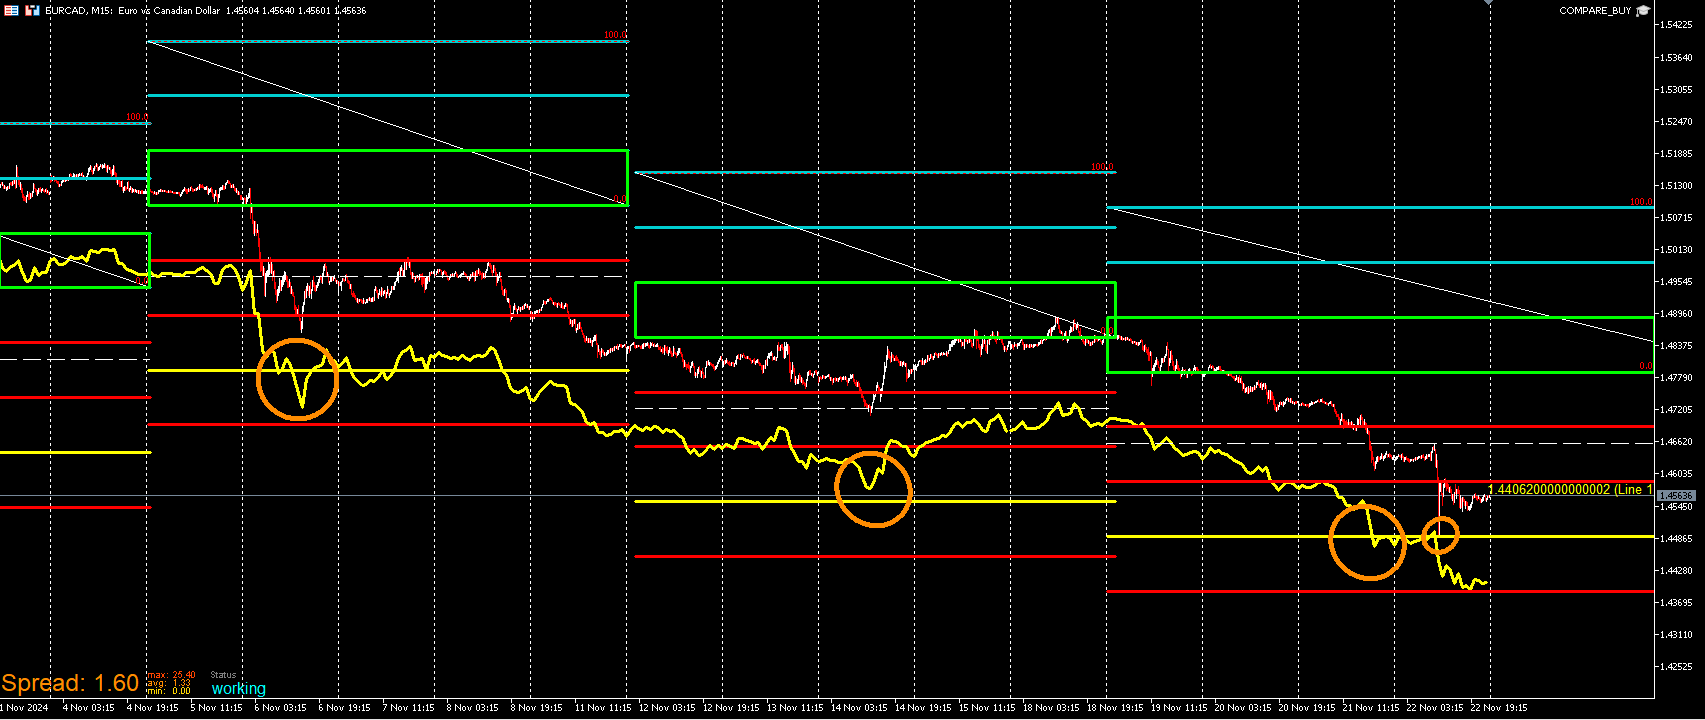
Here is a recent EA that's completed. It's purposes are analytical and entry. There are two versions of this. Long entry red lines on bottom blue at top and short which is vice versa. For the long template, there is a yellow tracer that is a fixed number of pips below each candle.When that tracer nears or go below the yellow trendline, that's where I will look to enter.This isn't something that happen often. but it does with every pair a handful of times throughout every year. It's not often that actual price reaches the yellow trendline and even more rare that price touches the tracer. Here price is touching both therefore a high likelihood for a reversal.
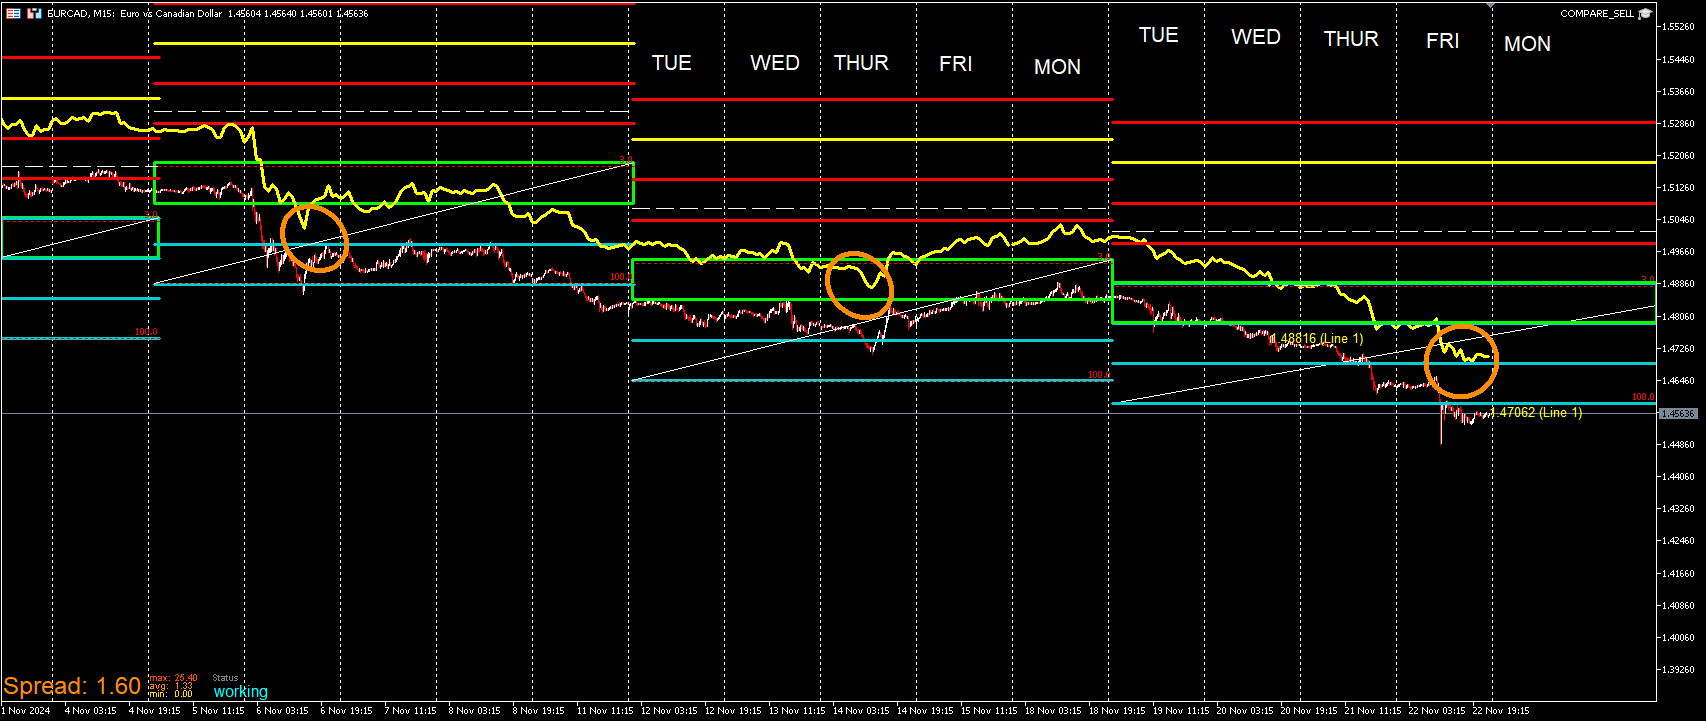
Inversely here is the sell version.It's the same concept but flipped to the upside. I can still use information on here for longs. I look for the high tracer to be within or below the green box. When the yellow high tracer get be these zones more particularly within the blue trendlines, there is more likely to be a retracement back up. It's not likely that the tracer will continue to crash down through especially if price has already been in a downtrend. Equally when selling, I look at the buy template low tracer to see if it's nearing the green box and above. These templates start on Tuesday and end on Monday.
-
EUR/USD
This one is a good ways below the green. I've never seen price breach completely below into the white. If there is more downside, I would assume it to be very little.
It's not as deep into the red as I'd like but it is pretty deep below the green and been down there below a good amount of time. A slow grind near the previous two ribbons is also a good sign.


For the high tracer, I'd like to see it go down further and think it likely will. As of now, it's a little high for my liking.

-
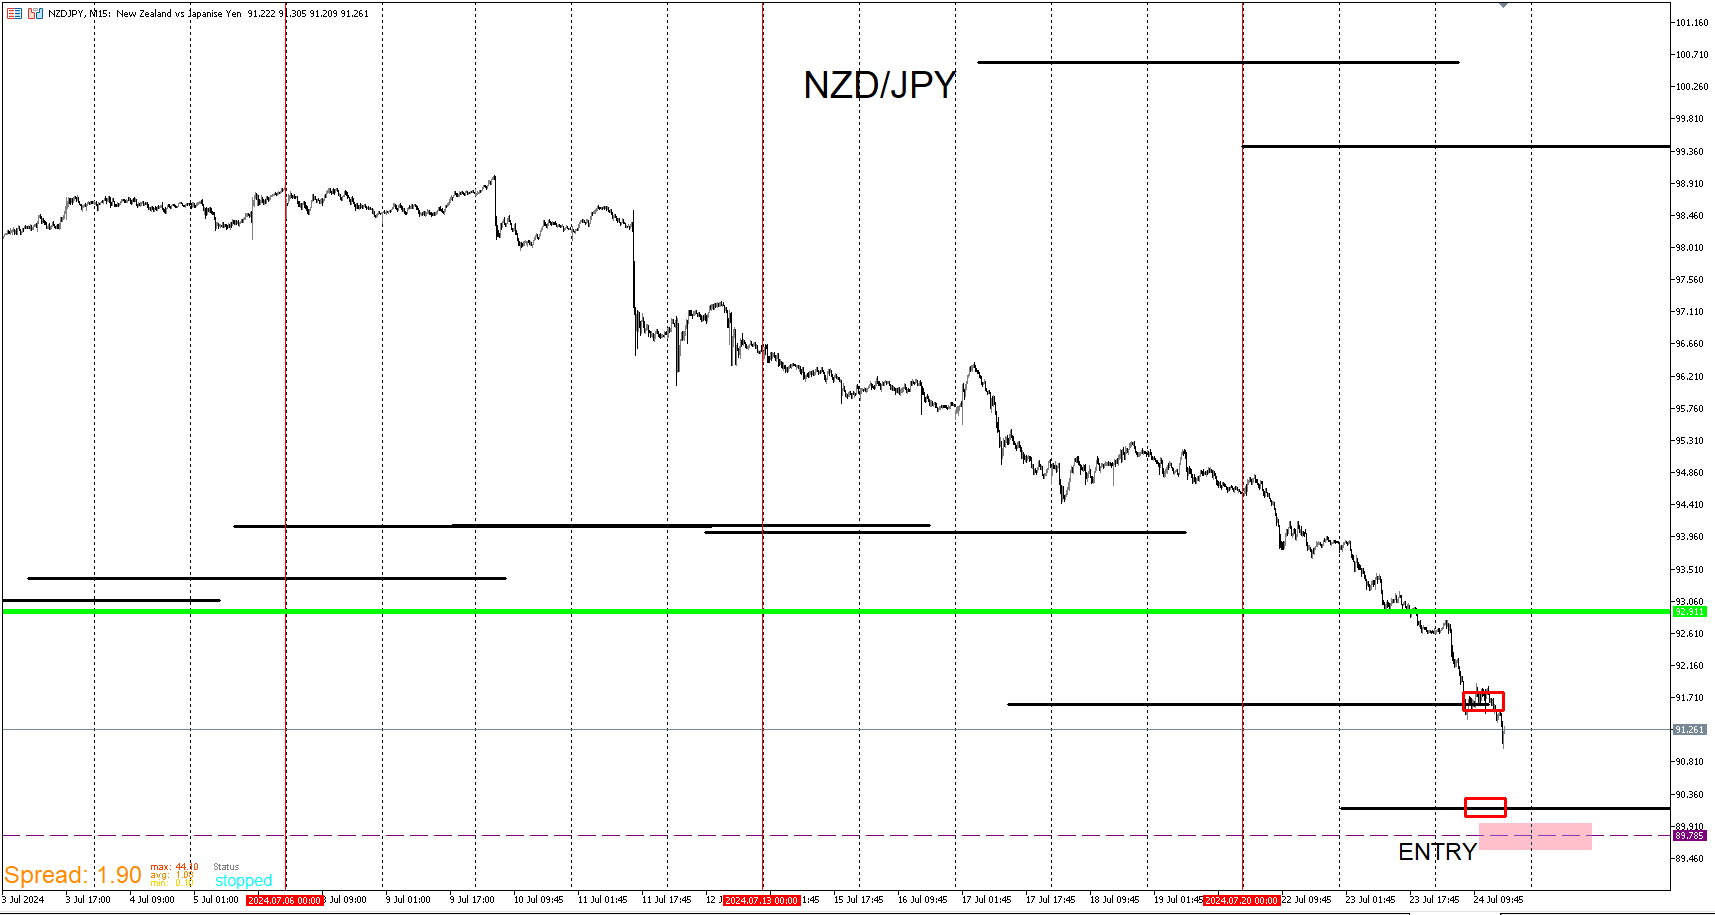
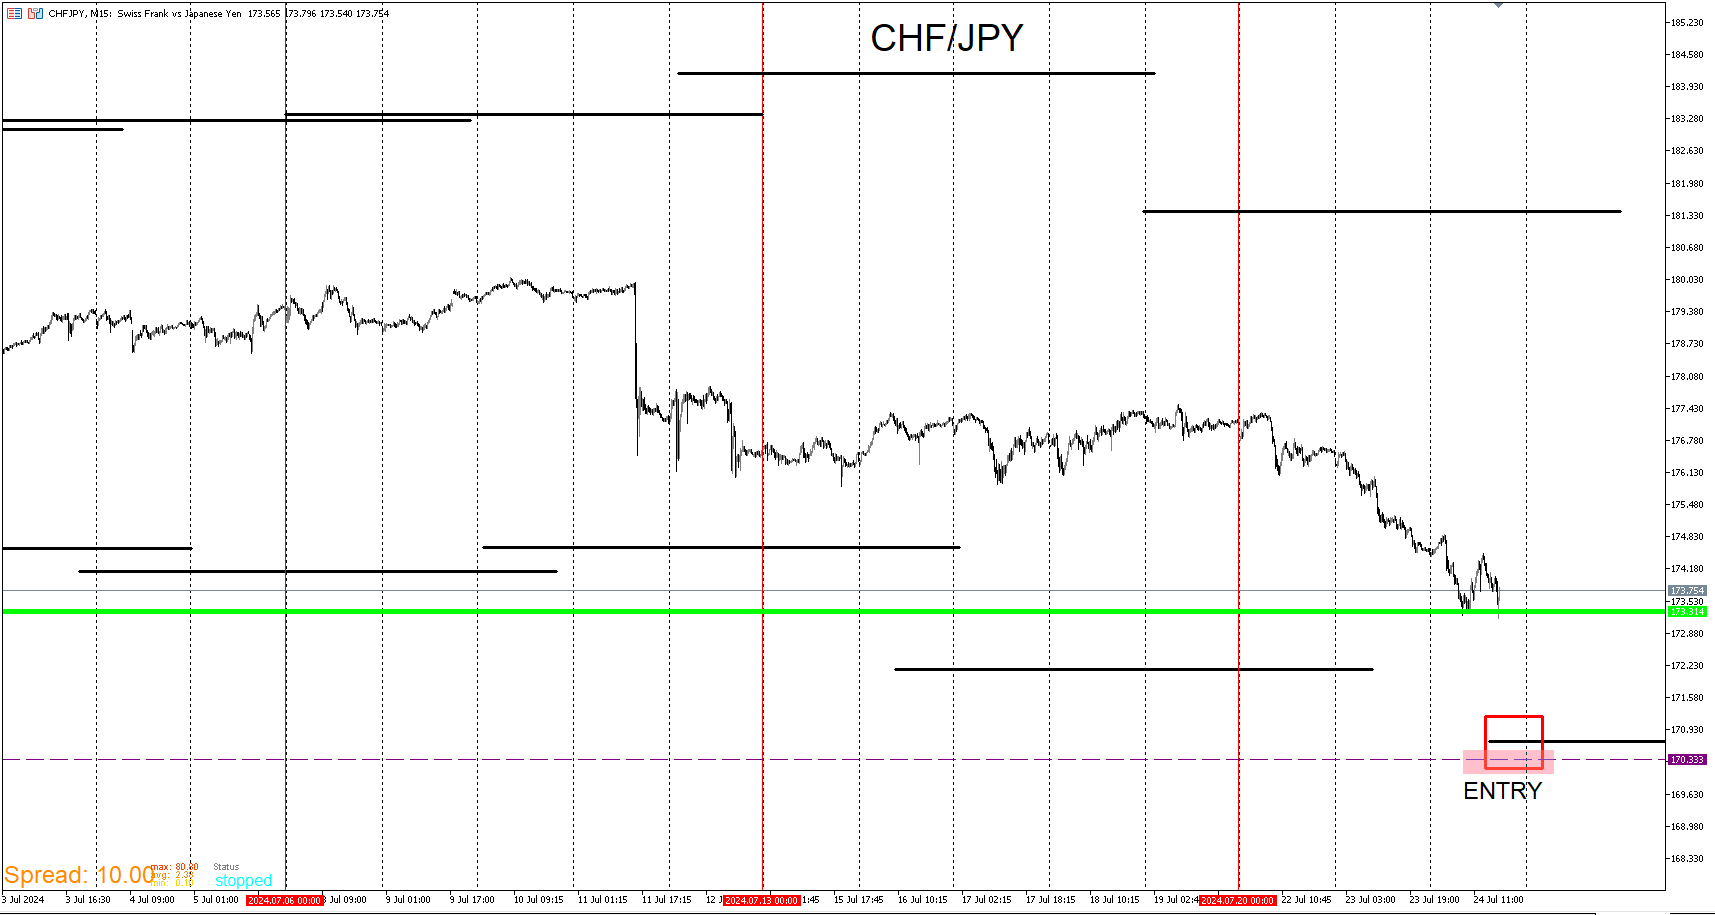
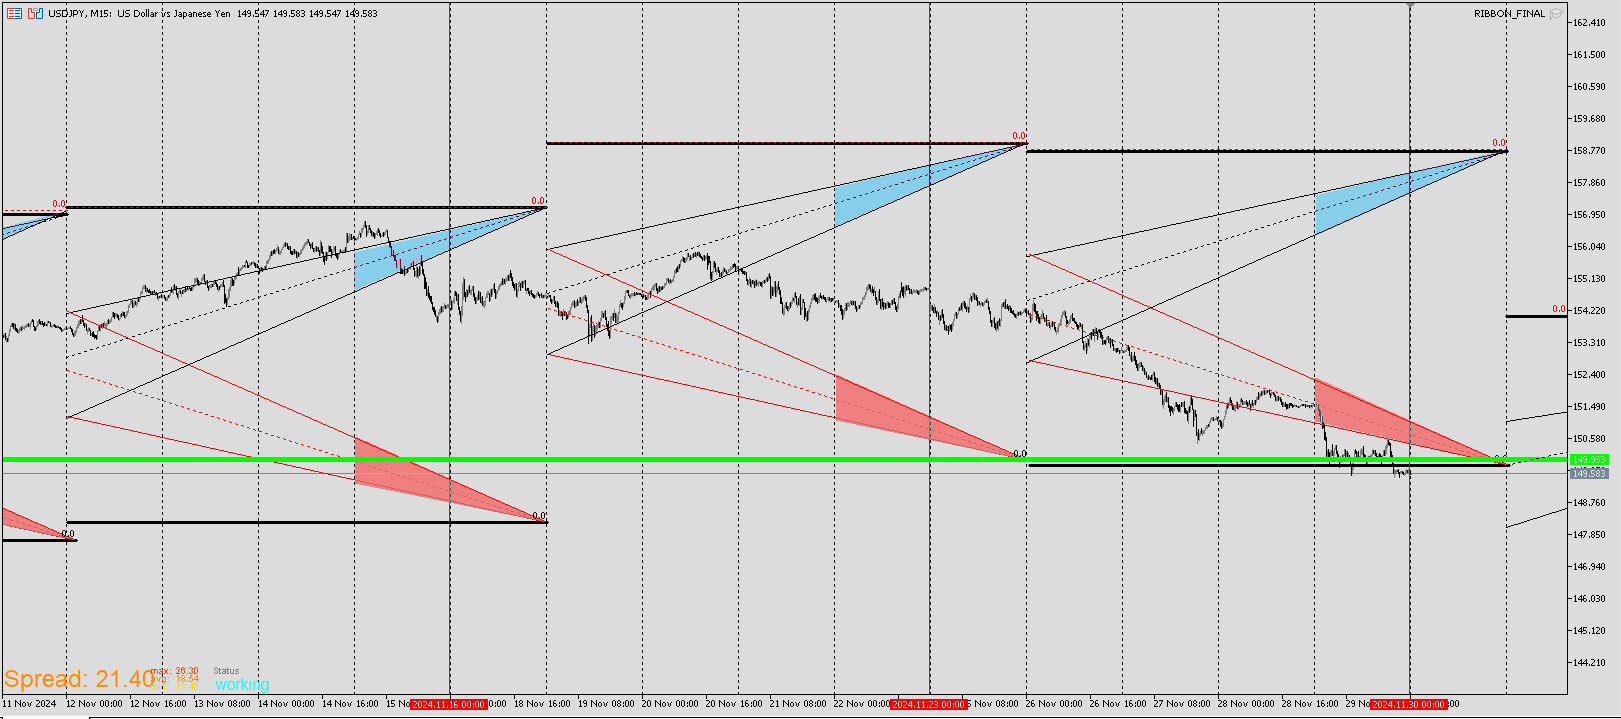
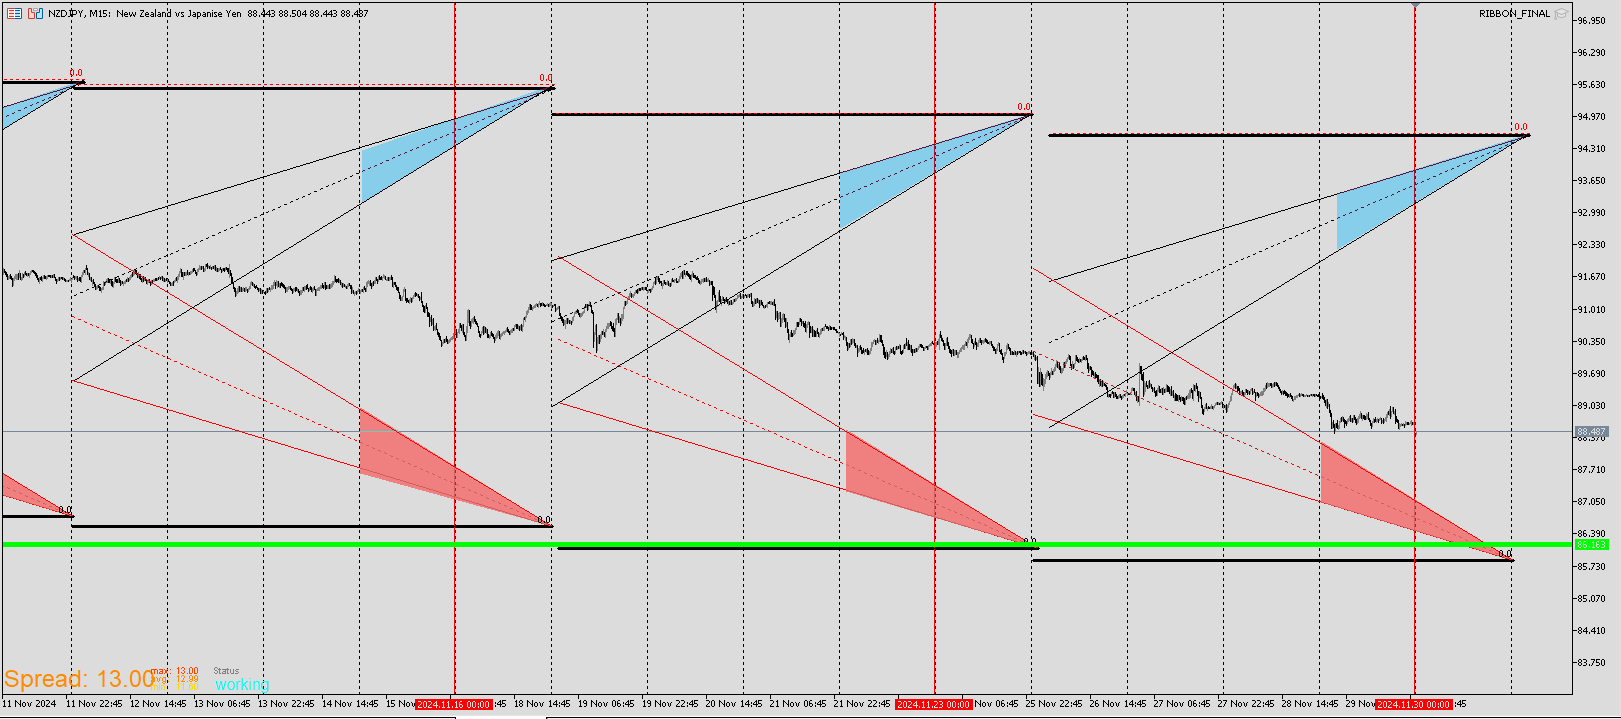
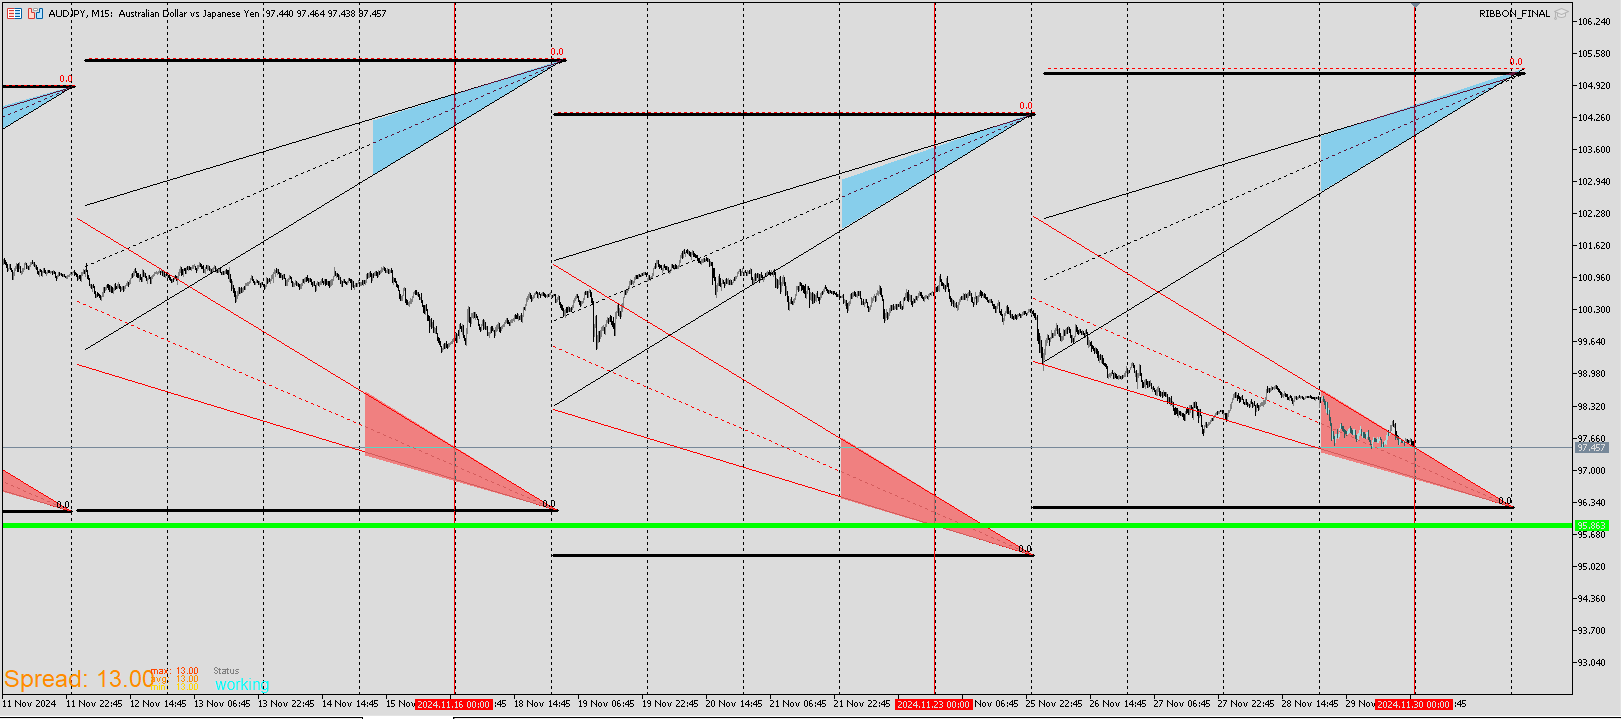
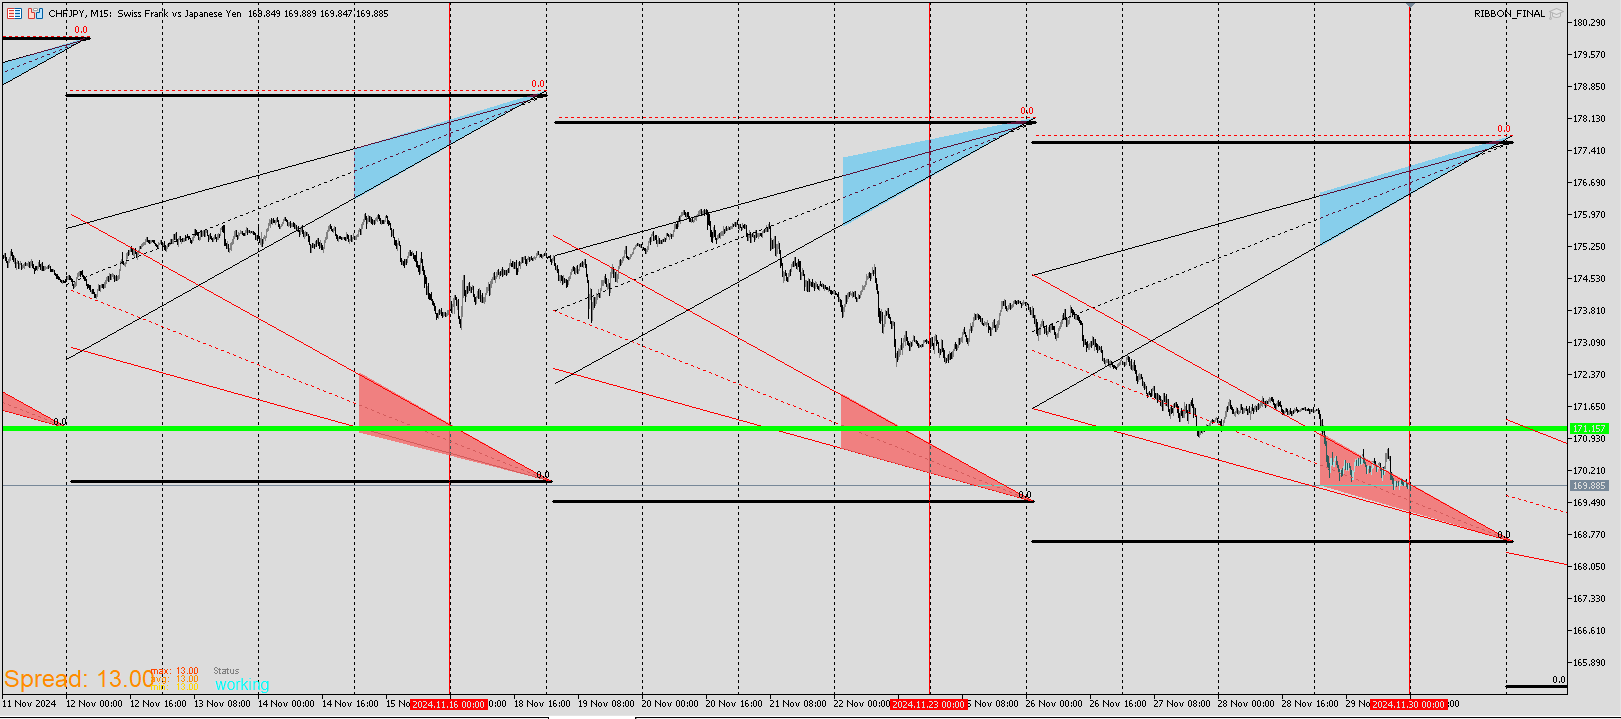
I'm paying attention to the Yen pairs because they are nearing areas where I'd like to be a buy. I'm also cautious considering with what's going on fundamentally. Price could continue unwinding but historically a tightening at these zones usually provide upside even if price intends going lower. I'd prefer to see a flush down really soon to enter. I'll enter long on a couple of these pairs with a really small position.
USD/JPY
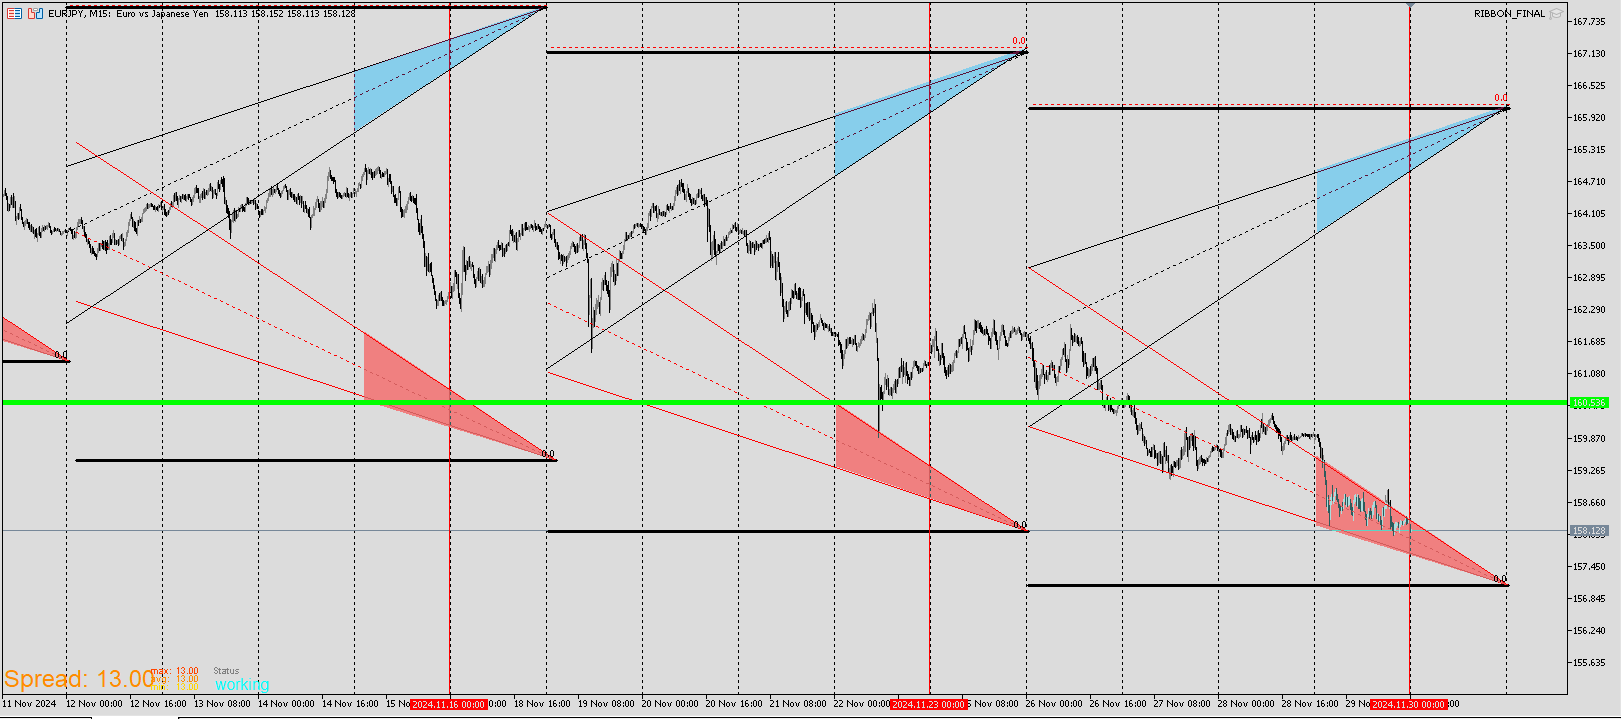
EUR/JPY
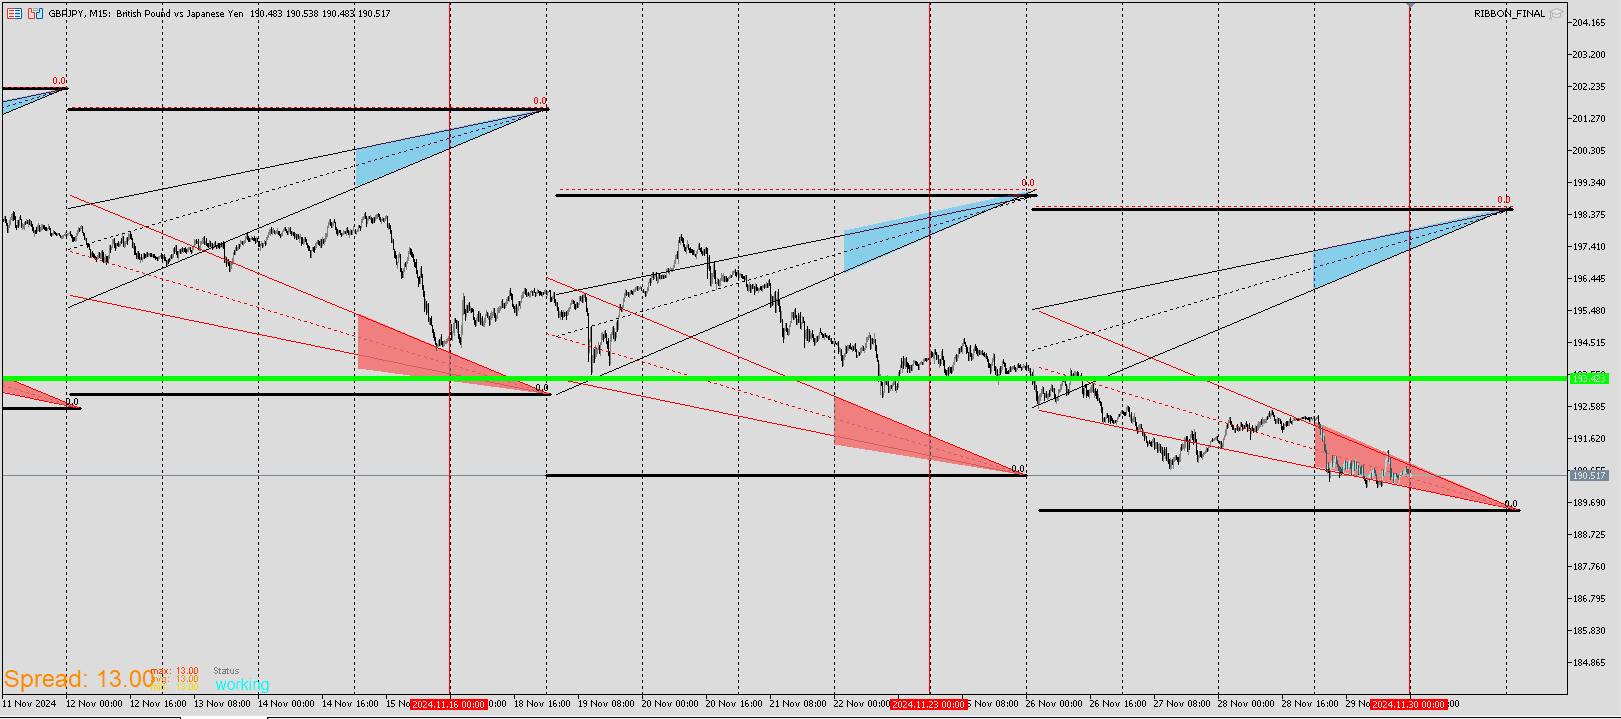
GBP/JPY
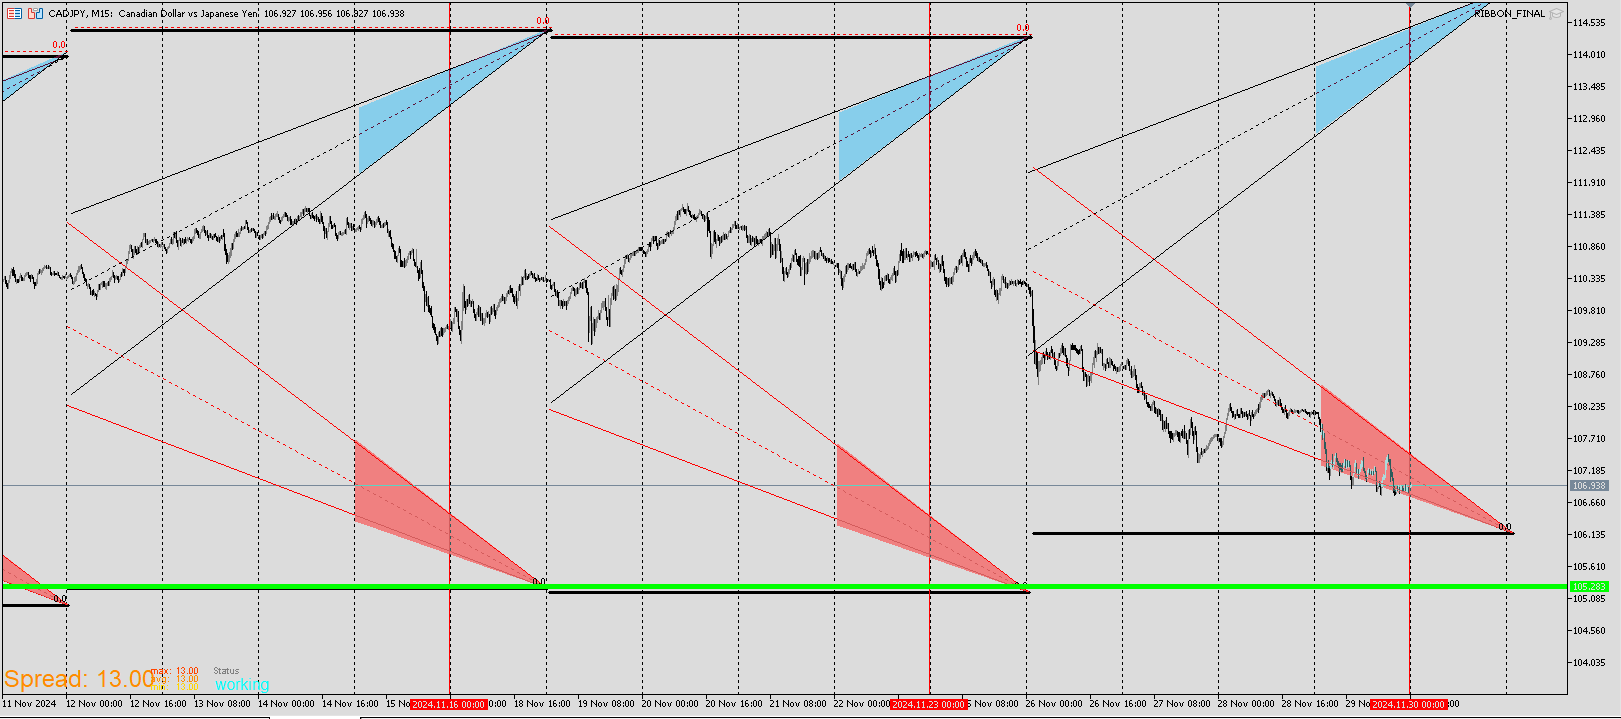
CAD/JPY
NZD/JPY
AUD/JPY
CHF/JPY
-


-
Greetings. This post is for an EA promotion that I just placed on the marketplace. It's one of the most common one that we all should be familiar with. Simple and straightforward. The Green line long signal. I will post up the sell version soon. Both are free. Feel free to test it out and remember to consider the rules/suggestions that I personally find it to be the most successful. Feedback is most welcomed.
Thanks.
https://www.mql5.com/en/market/product/127708?source=Site+Market+MT5+Utility+New+Rating006
-
Here is the Sell version.
https://www.mql5.com/en/market/product/127717?source=Site+Market+Product+From+Author -
Lastly here is the Ribbon EA. I am still working on the version for indices and is almost wrapped up but there are a couple things to iron out. This is paid but I think it's pretty reasonable given the potential value it may bring.
https://www.mql5.com/en/market/product/127724?source=Site+Market+My+Products+Page
Thanks for following along and I will keep updating.