My EA update
-
Que gran trabajo..... muchas gracias por tu esfueerzo.
-
@DragonZueloTrends said in My EA update:
Que gran trabajo..... muchas gracias por tu esfueerzo.
Gracias. Hay mucho más por venir.
-
Now I will demonstrate Template2. This template was actually used along with my other templates. It's the first step that gives me the signal of a move coming later.
Later could mean a few days,few weeks,or a few months. Anytime price gets to this level I get ready and start paying attention to how the other Templates are setting up.
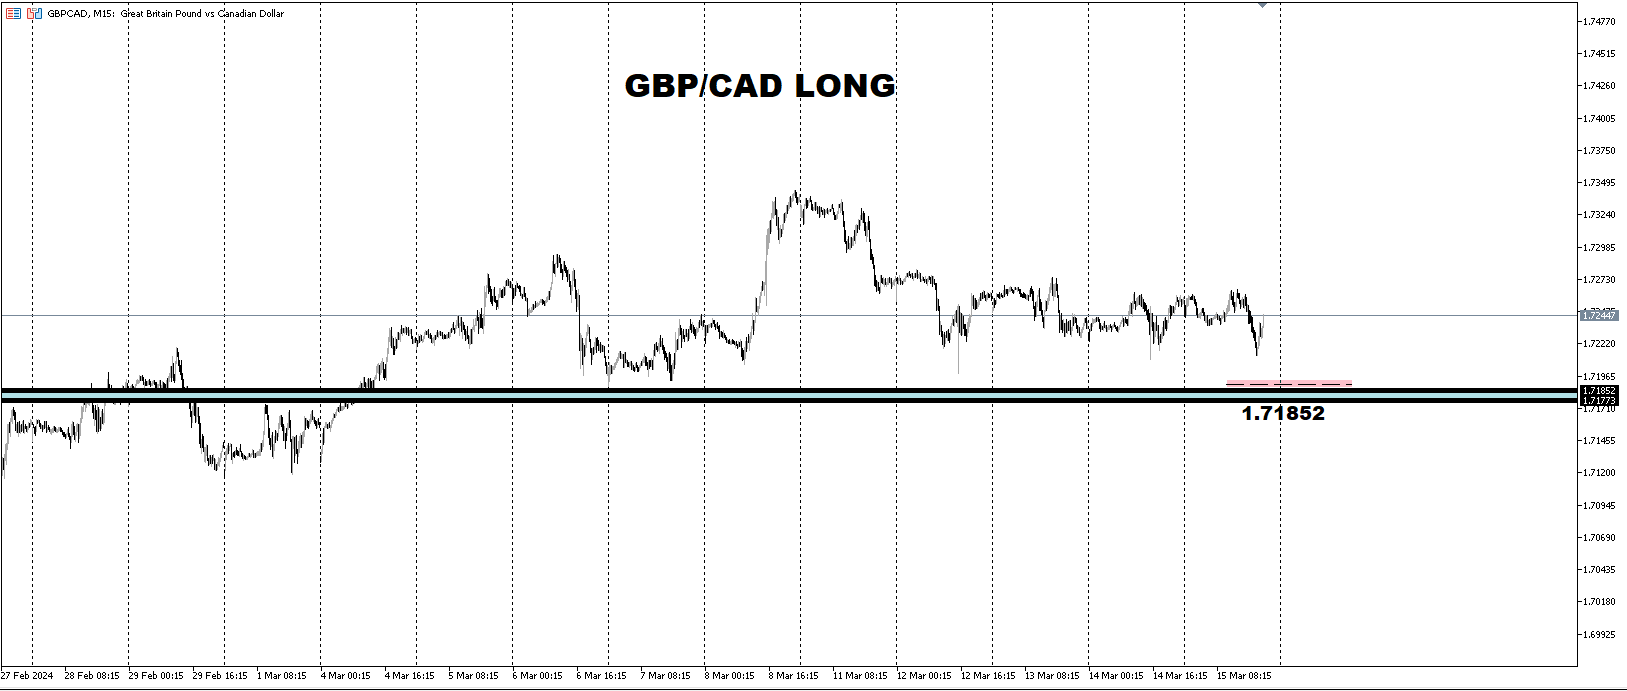
This line which is represented as green dashed lines is a break that I look for. I look for price to spike down through it, the more aggressive the spike, the better. It could be used as an entry but I wouldn't use it as an entry on it's own. My other rules would have to be met to enter on this break. What I actually look for is price to trend up from there.That trend can last for weeks and if longer, it usually consolidates for a while before coming back down. Any buyers at that level and late buyers who jumped on the trend, I want to get in deep below them.It takes patience but it's worth it when I see it setting up.If I were to enter the trade on the break and dump down below the line, I wouldn't hold it as long as I did on the other swings I posted in here.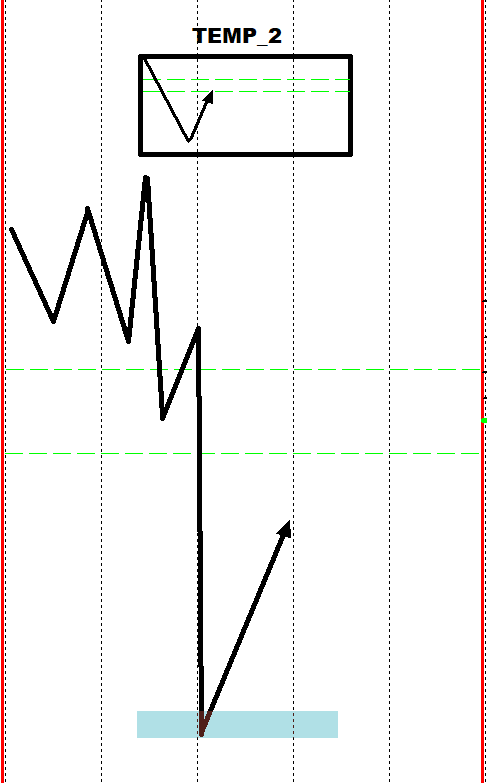
-
Here is an example. It is a bit of an oversimplification. This usually plays out on a large timeframe but there's only so much room on the chart to draw it.

I will share a video of the EA in the next post to show how the line comes to be.
-
It's been a while since my last post because there was nothing really interesting going on. It's starting to look like things are about to shake up. It usually takes 3-4 months for setups to start become obvious. Here is an update of USD/JPY. Sadly I put in a sell limit order at my entry prediction and price came just short of it a few pips so it didn't get filled. But that's okay. The push down from that zone is the type of measured move that I anticipated. I'm actually prepared to look for a buy. Not now and I will need to see favorable long conditions be met that would indicate price going back up.
-
There is a similar setup to the first entry on 12/7/23. Price is nearing walls as well as some 500 levels. There is no guarantee price will get there but I have to be ready. If there is a deep spike like last time, there is where I'm entering. This is where I see the sellers from the top being rewarded and I will gladly buy from them if price spike below these walls.
EUR/USD
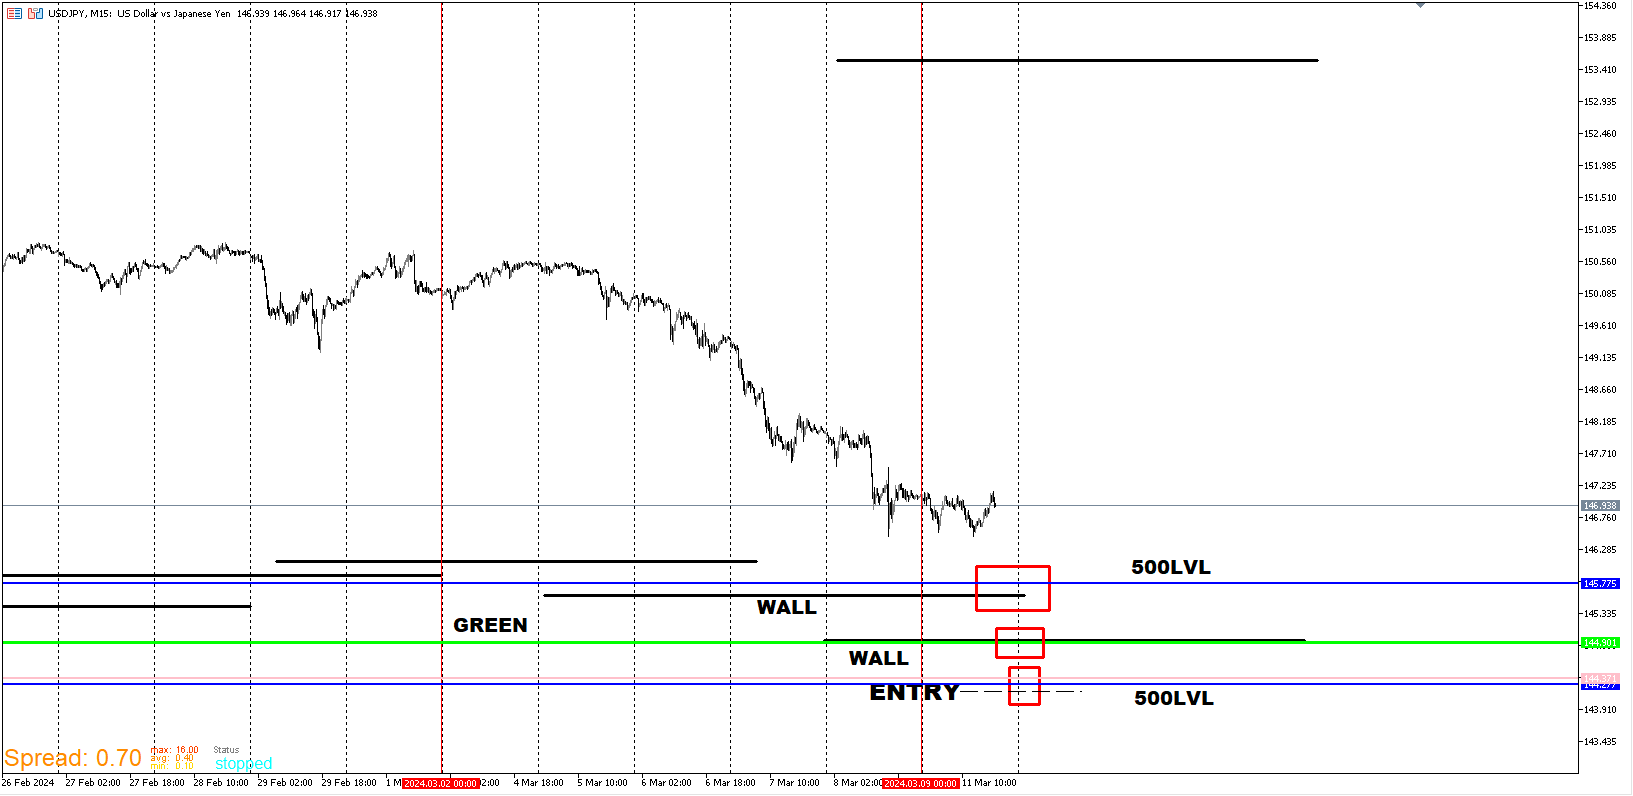
EUR/JPY
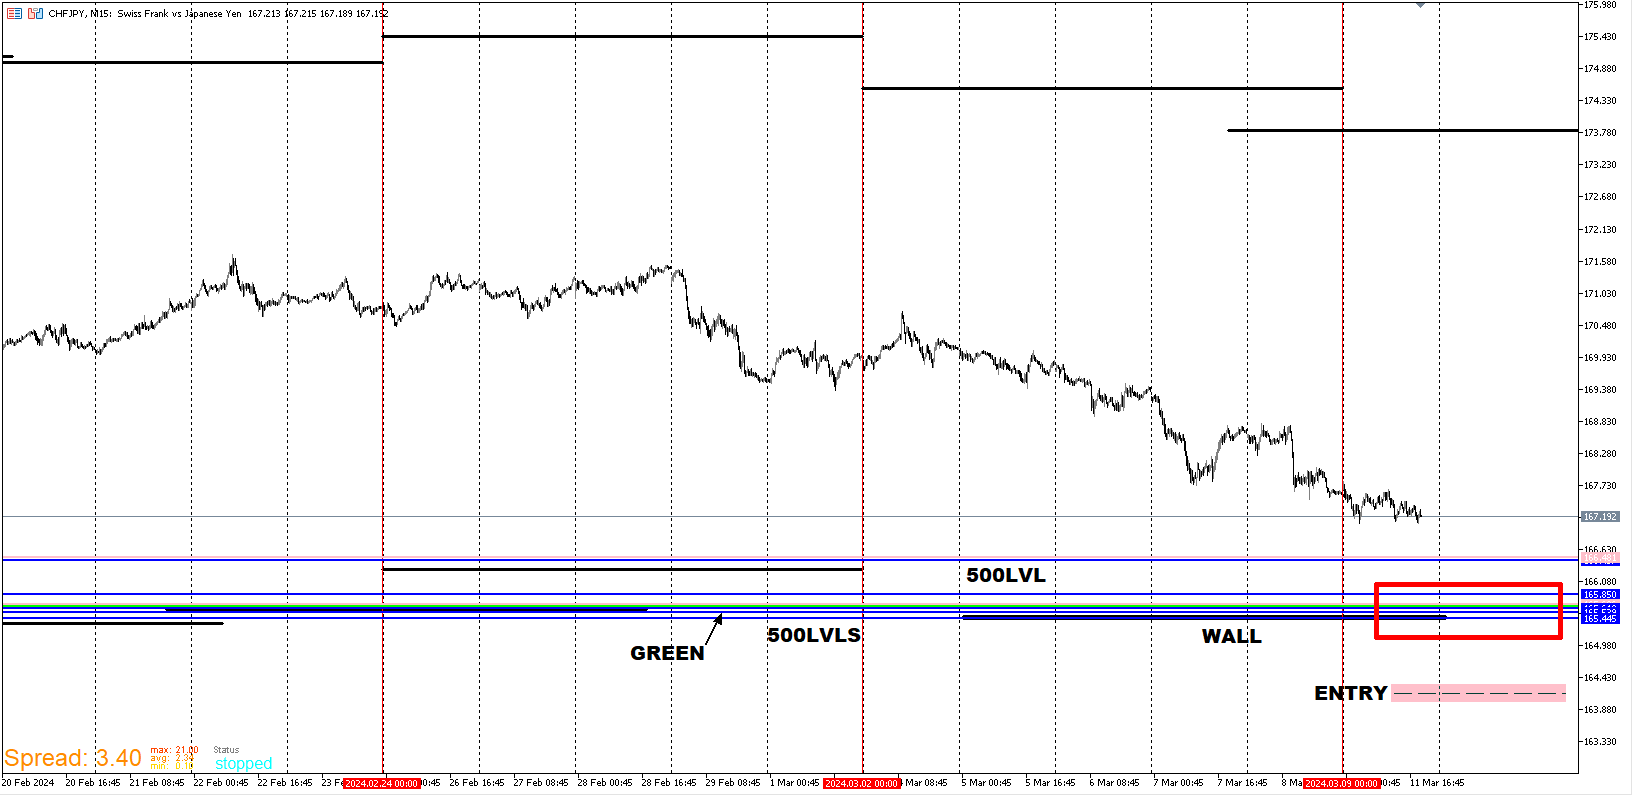
CHF/JPY
Clustered major levels on Wall makes for stronger reversal probability.(If price gets there.)
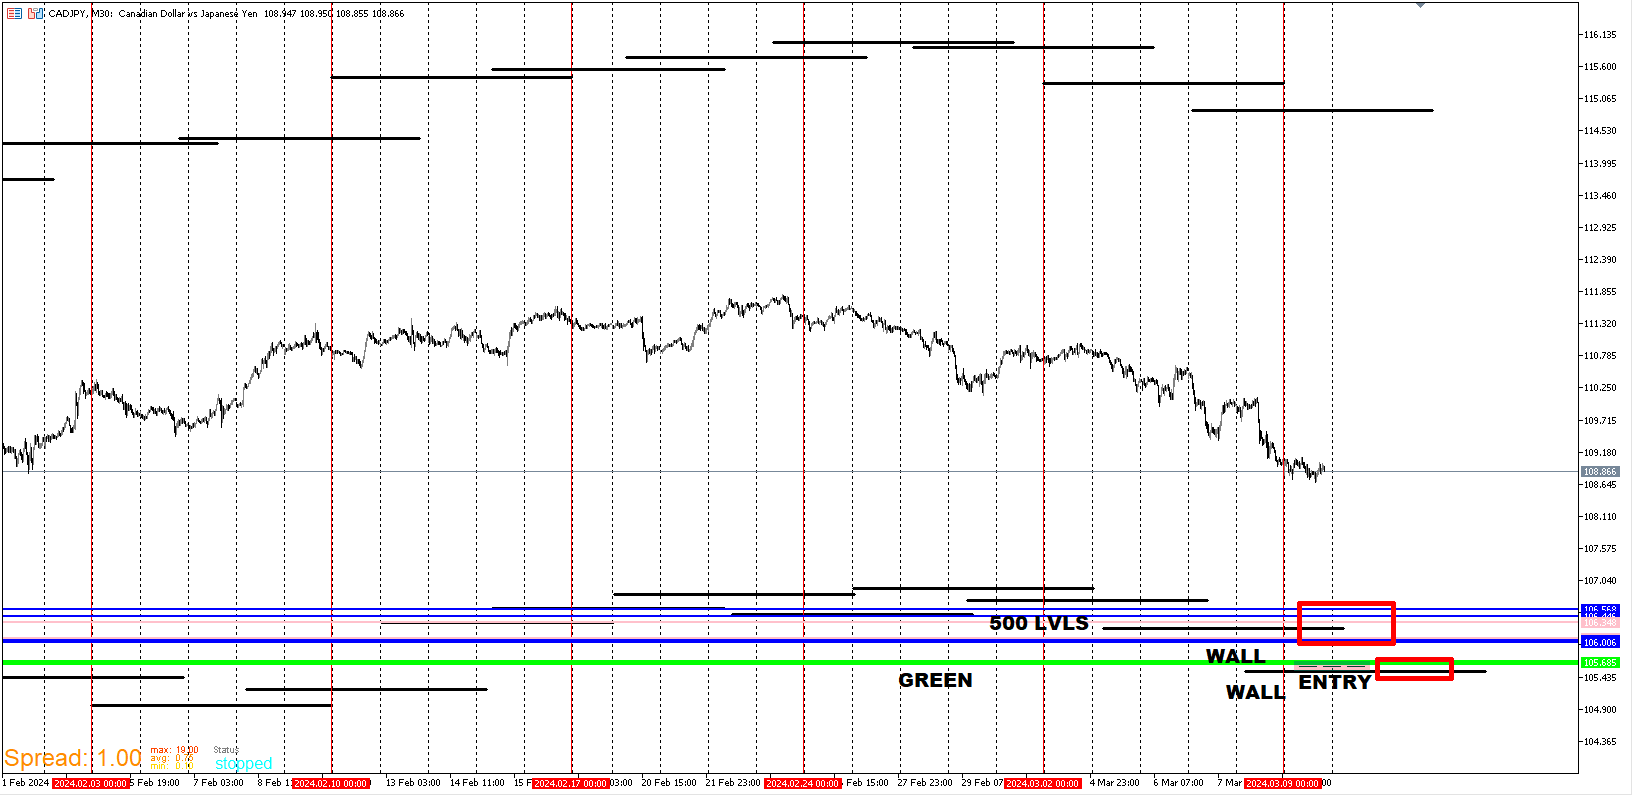
CAD/JPY
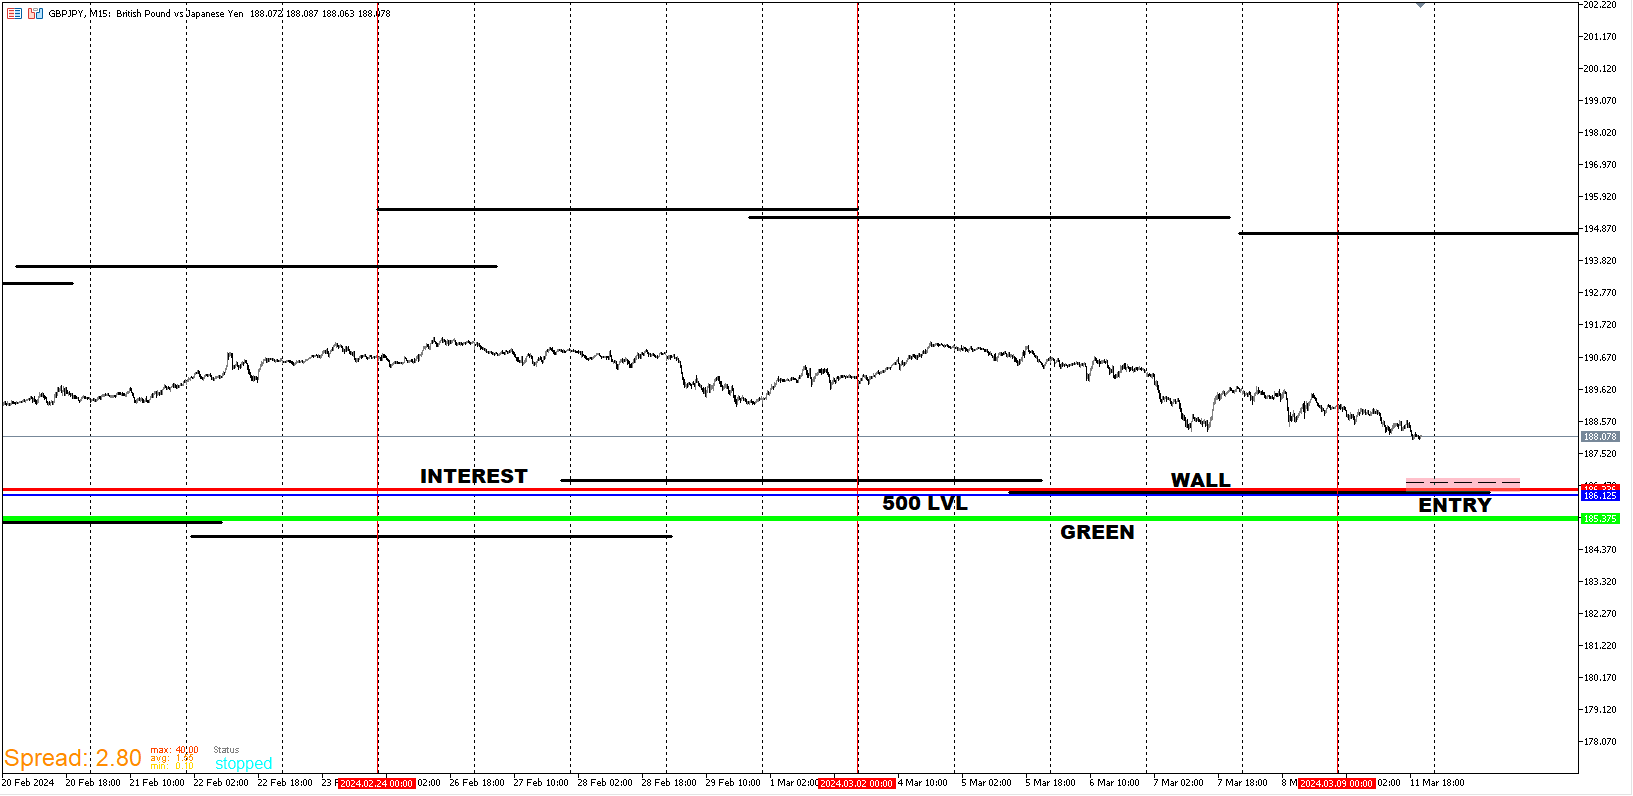
GBP/JPY
If price aggressively move down soon, I think there is a solid chance it will bounce off the wall.
-
That's it for today. I'm not saying that price will hit those levels soon or if it will at all. I'm just prepared in case it does. If it does, it could be quick or a slow grind for a few days. Every bottom isn't an aggressive spike. It could be a slow roll over as well but I have an Idea of what to look for if that's the case. If it doesn't get there and pushes up instead for a great distance, It's totally fine. F.Y.I. I'm not posting these as signals that I think people should take. This is strictly to show how I blend EA's that I worked really hard on and how I use them to aid me when pulling the trigger. I still put a ton of time in on the charts outside of my EA's. I also still get nervous because I'm using real money and even though results have been good so far, I will be wrong at times. I look for these setups and they take weeks/months to manifest. So I have to get ready and explain my thought process even though price may never get where my attention is focused.
-
Good job. Keep sharing it, please!
-
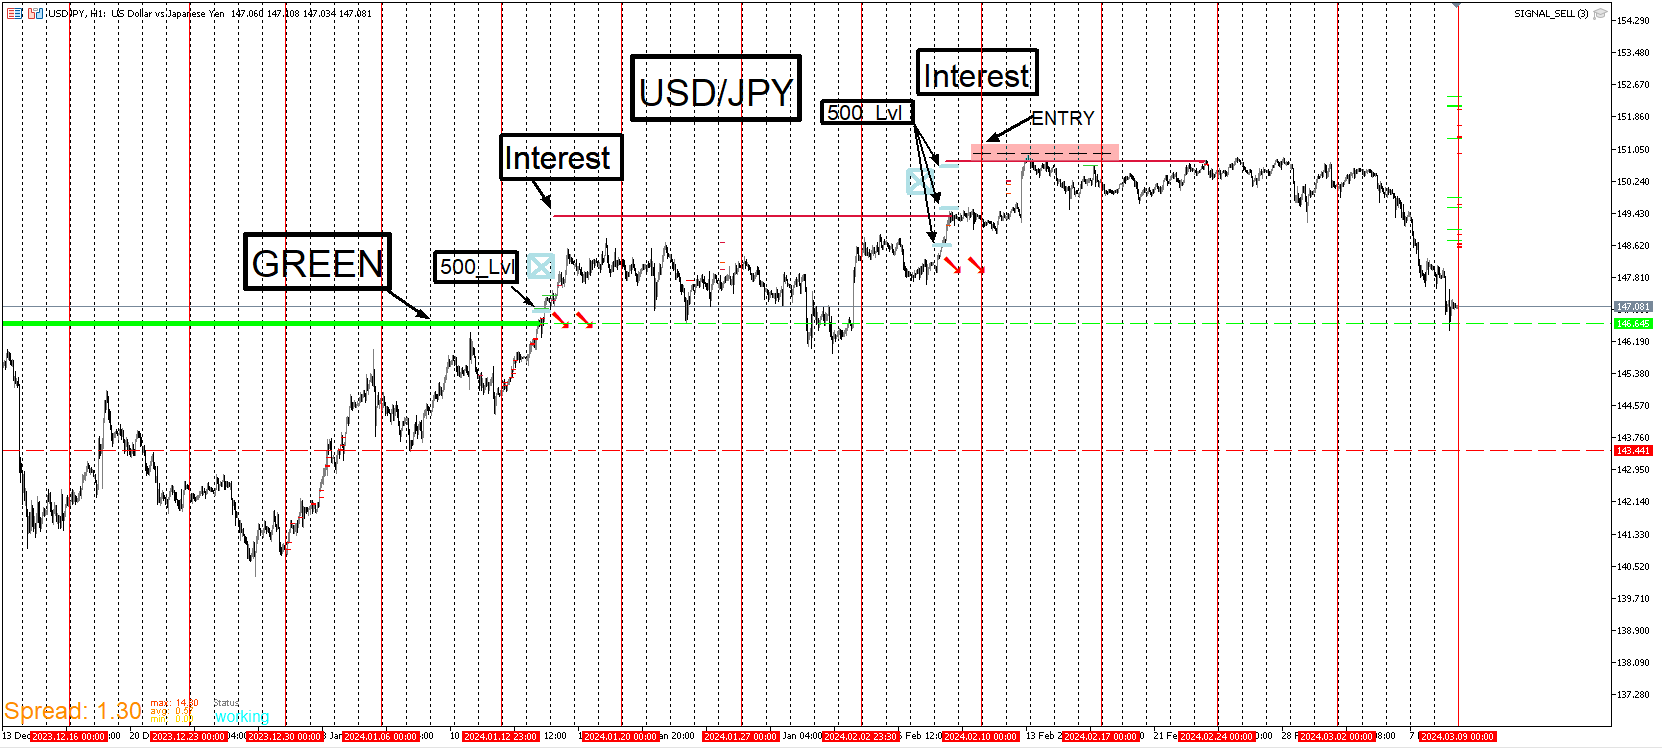
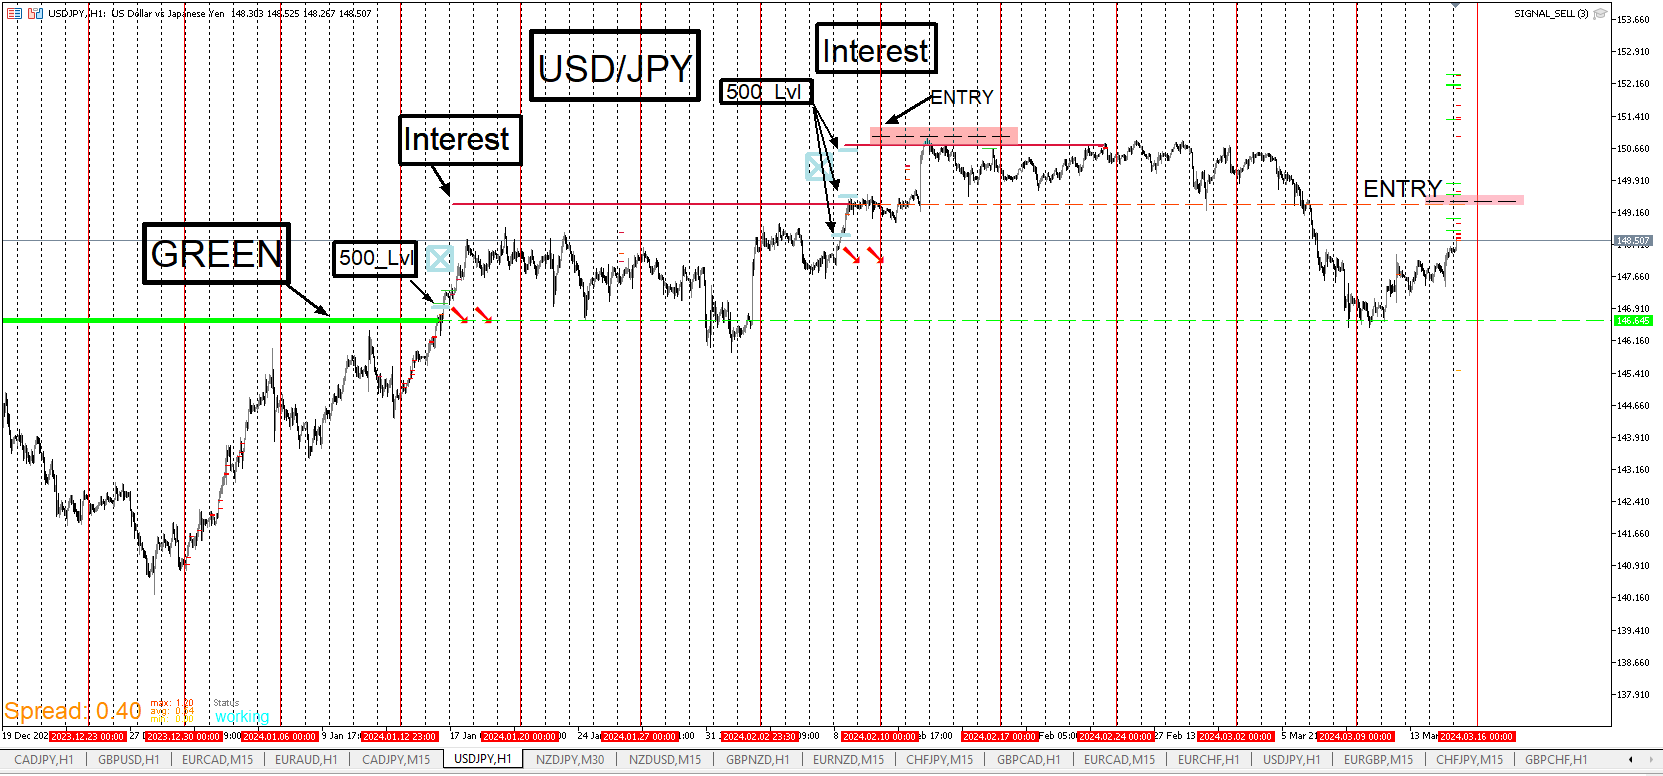
Here's an update for USD/JPY. Same template. Since price is moving up, I believe that a sell opportunity is setting up. I didn't take the first interest signal a few weeks ago because at the time I had more reason to believe that it would push up further which it did. Now price is coming back up and if it gets to this level, this is when I believe it to react from. My theory with levels is that it's about timing and how much volume is accumulated above or below before it becomes valid. When I say volume, I mean the actual structure, not the indicator. The structure here is a clean break down through it with a couple days of downward movement. I like the push down first and price coming back up to setup for the sell. If price reaches this level that I avoided the first time, I see it as a far less risky trade this time compared to the first time which I gladly avoided.
USD/JPY
-
I have been watching GBP/CAD for a while. It's been in opposite correlation with USD/JPY. If USD/JPY turns where I am anticipating, I will go long on GBP/CAD from a level that I can see it potentially pushing from. The chart isn't marked up like usual but it does look like a solid opportunity so I will take it.
GBP/USD
-
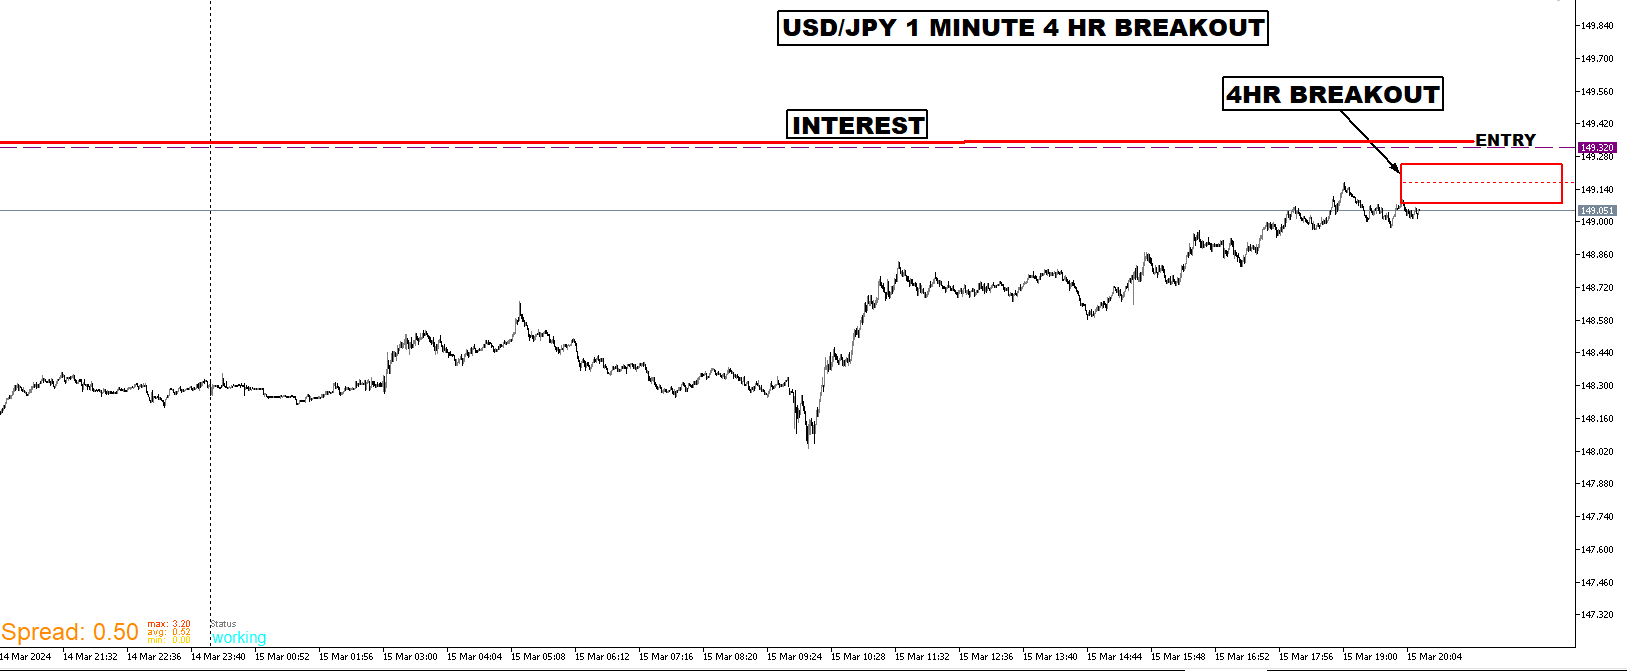
Here is a way that I refine my entry as tight as I can. I enter in on the one minute chart. I have a template that mark the high and low of each previous 4 hour candle. When price near my signal levels, I like to see price break out the previous 4 hour candles. It's moreso false breakouts because there are plenty of 4 hour breaks deep below and these breakouts don't be profitable. This is where I want to participate in the exchange. I think price will still push up but I need to see some consolidations and some 4 hour breaks. Price could drop before that happens but that's fine. I won't chase it and I have a way to identify solid retracement areas if I do miss it.
-
brutal!
gracias por esta informacion tan buena -
The setup didn't hold up and that's fine. The Yen pairs is still looking to push up. It's just happening sooner than I expected. I was expecting a much deeper pullback before price pushed back up. I'll post updates for what I'm looking for. I try to work on everything on my days off work so that I can focus more. I'll get out the way of this momentum and see if it hit levels that give better probability.
-
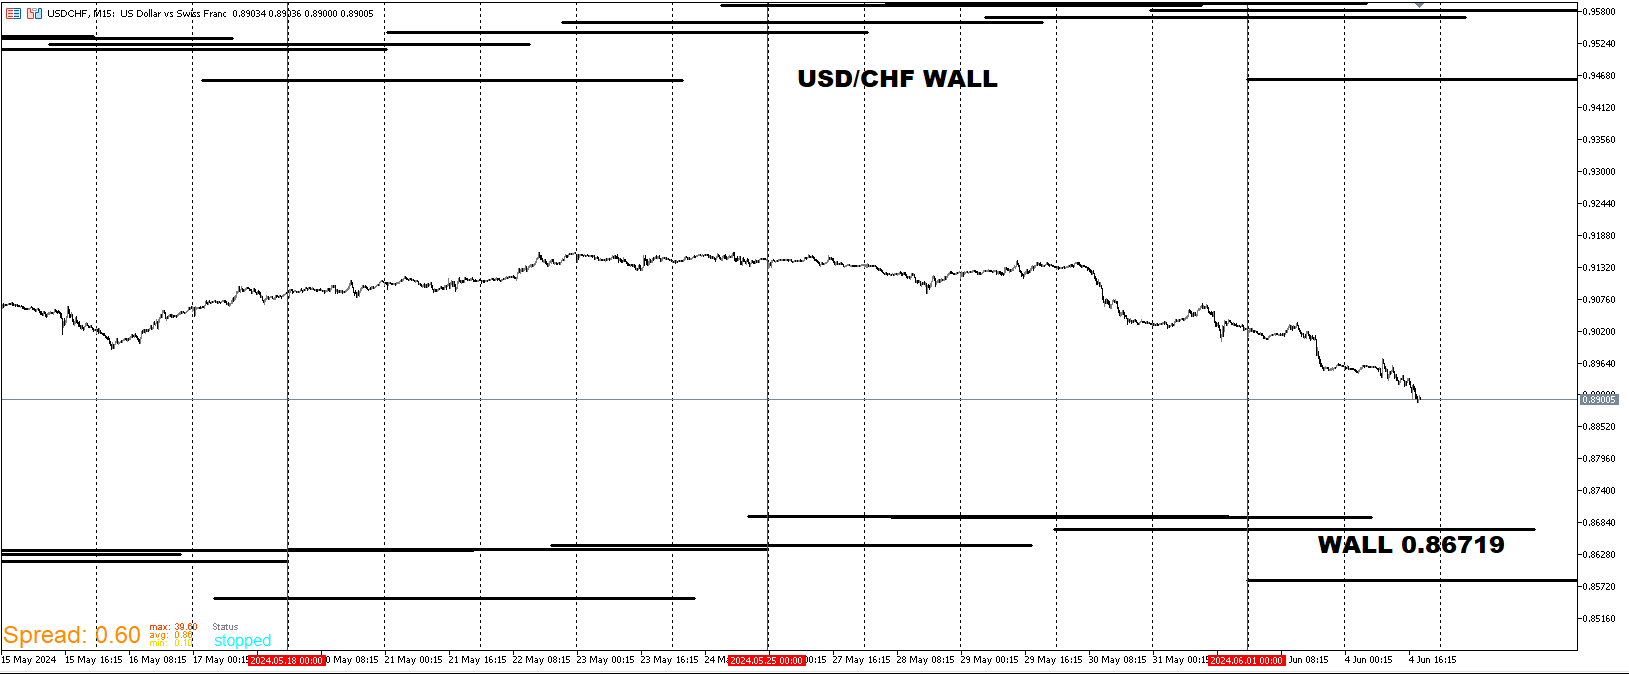
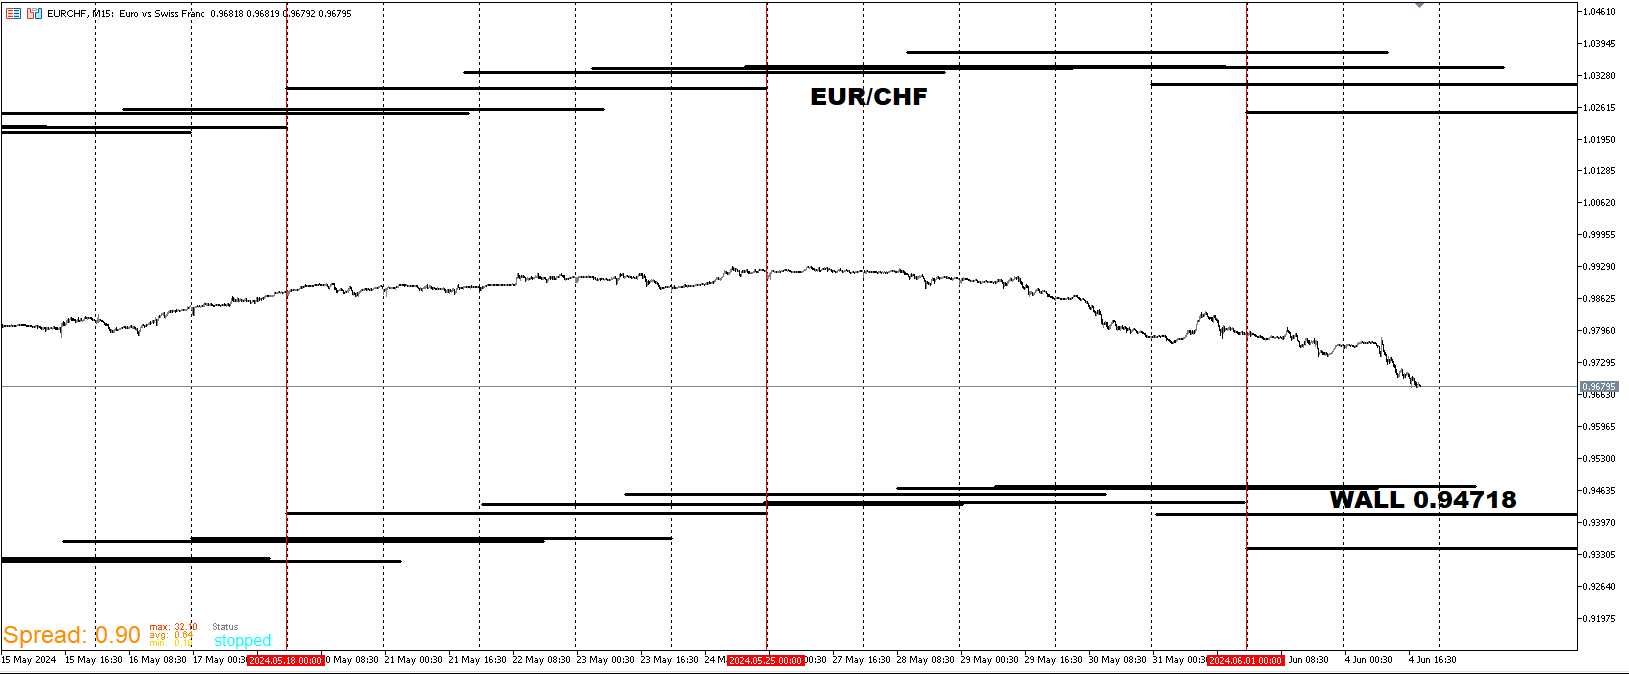
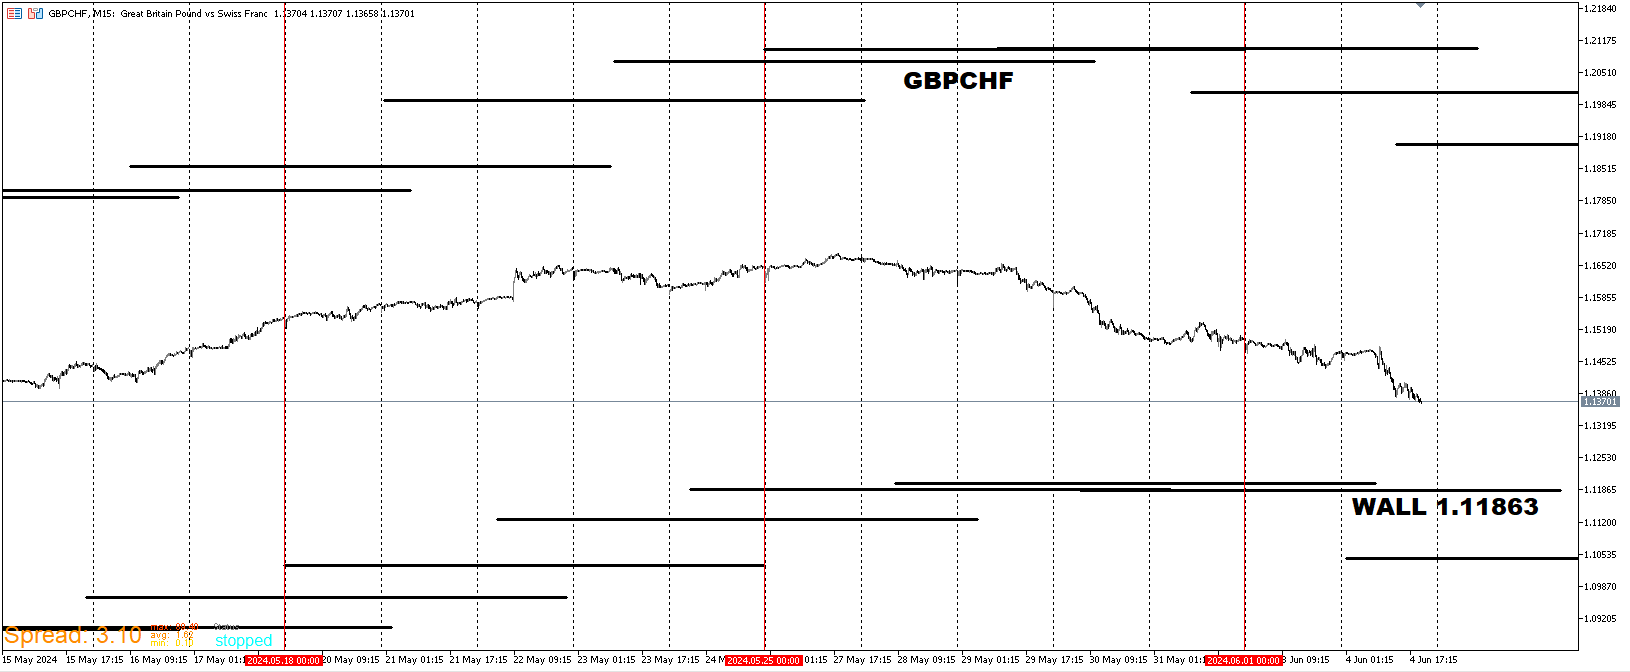
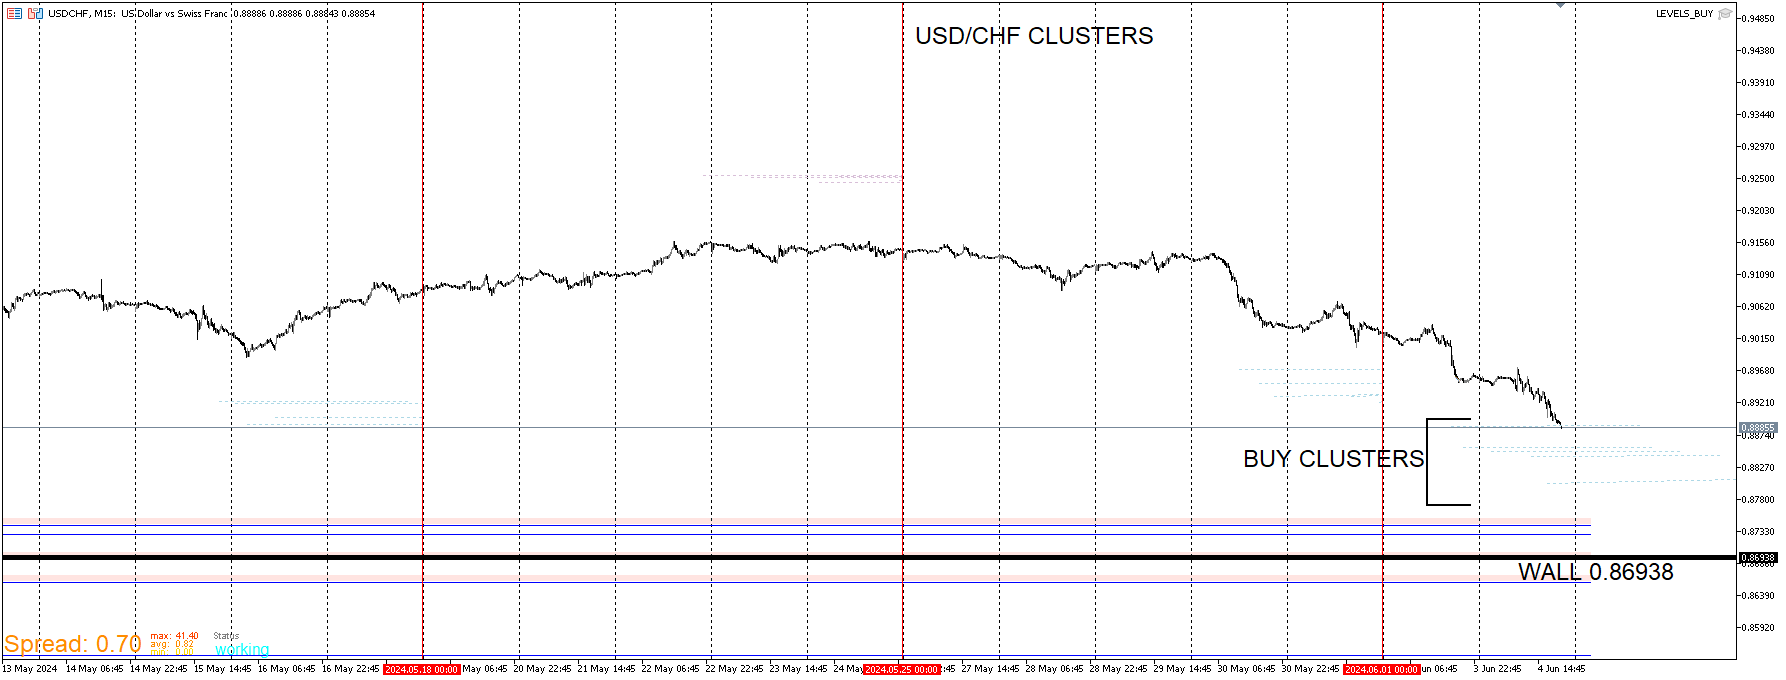
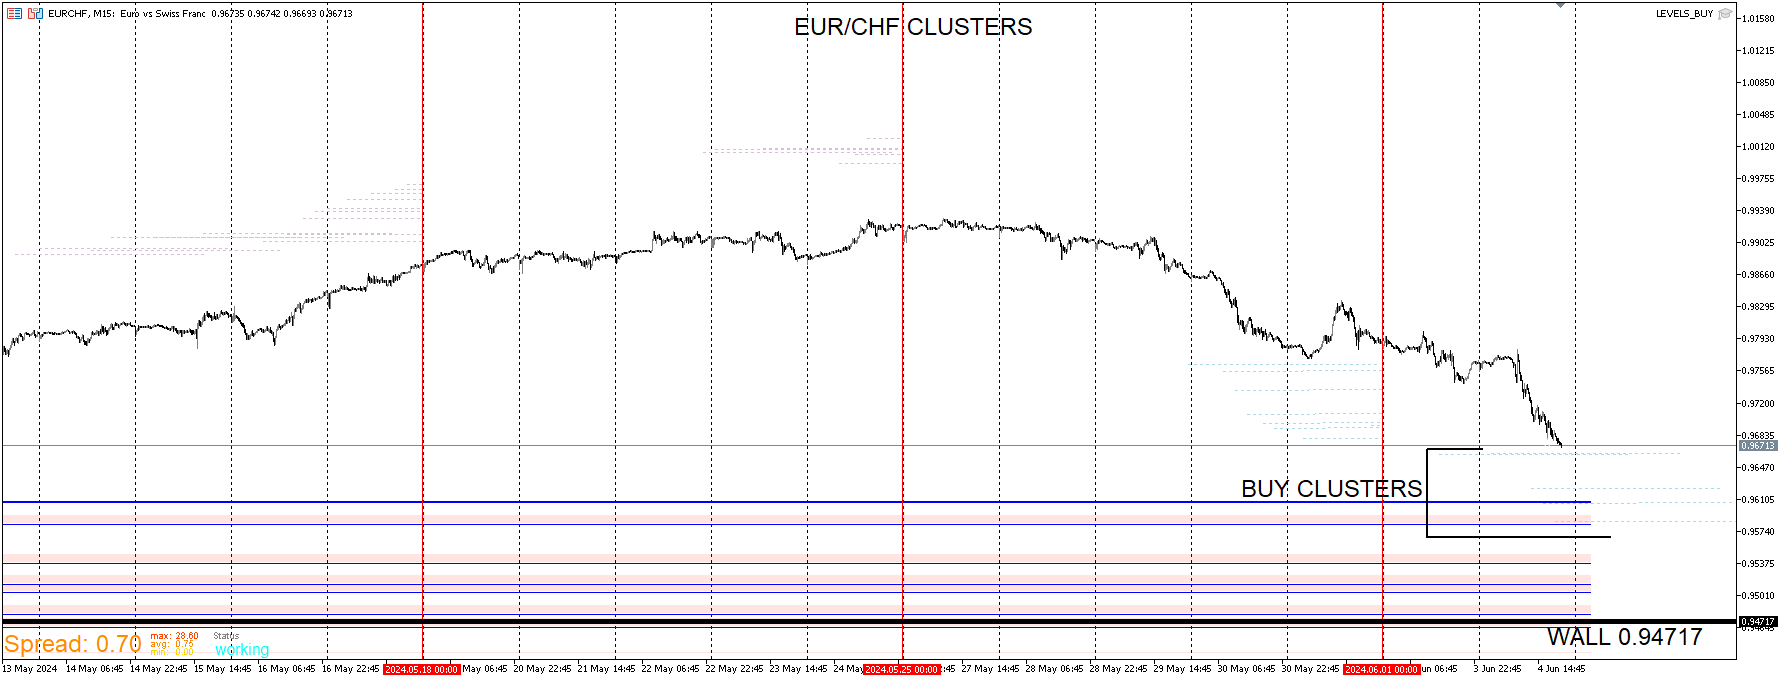
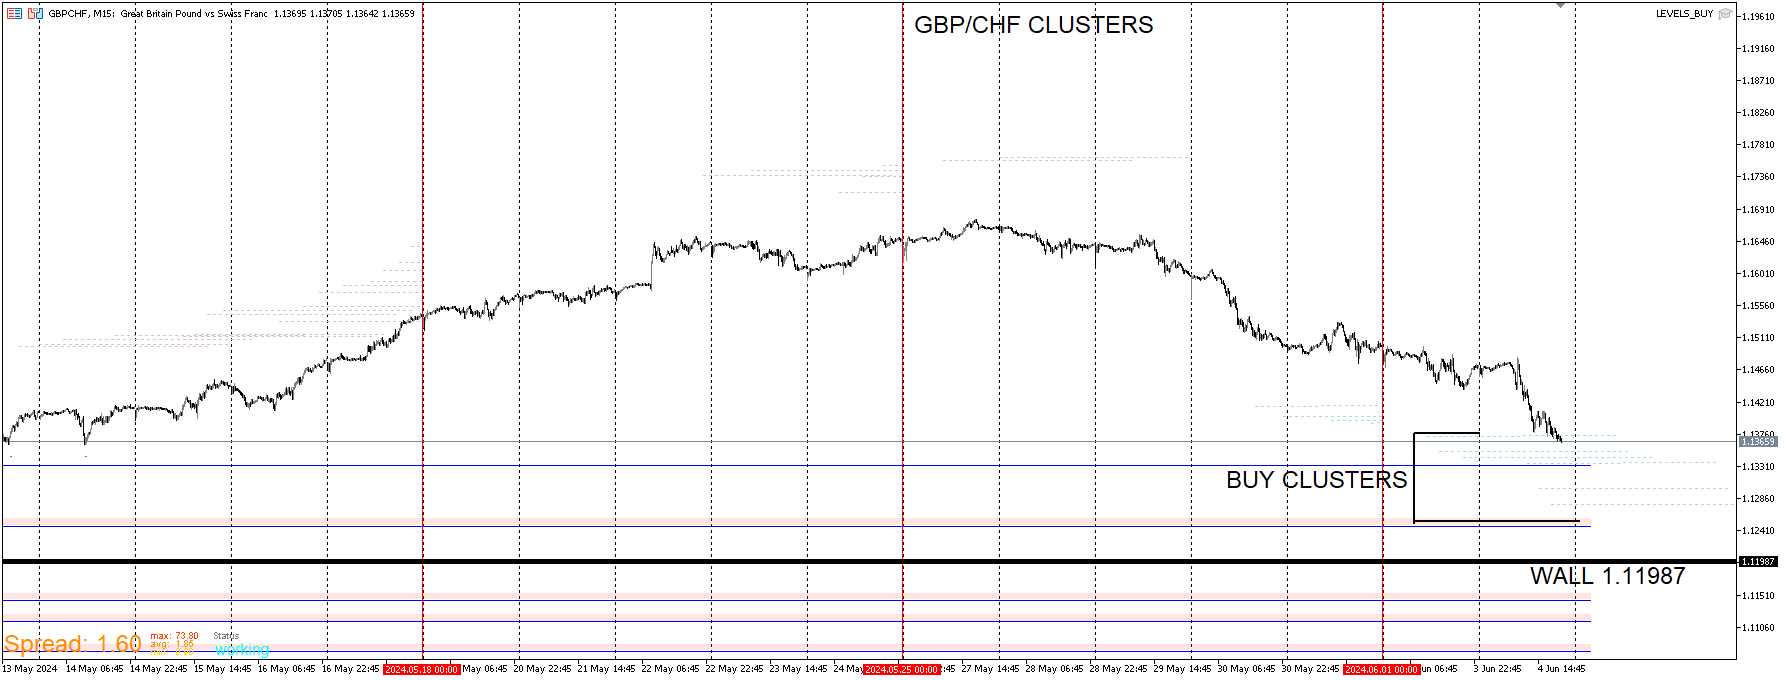
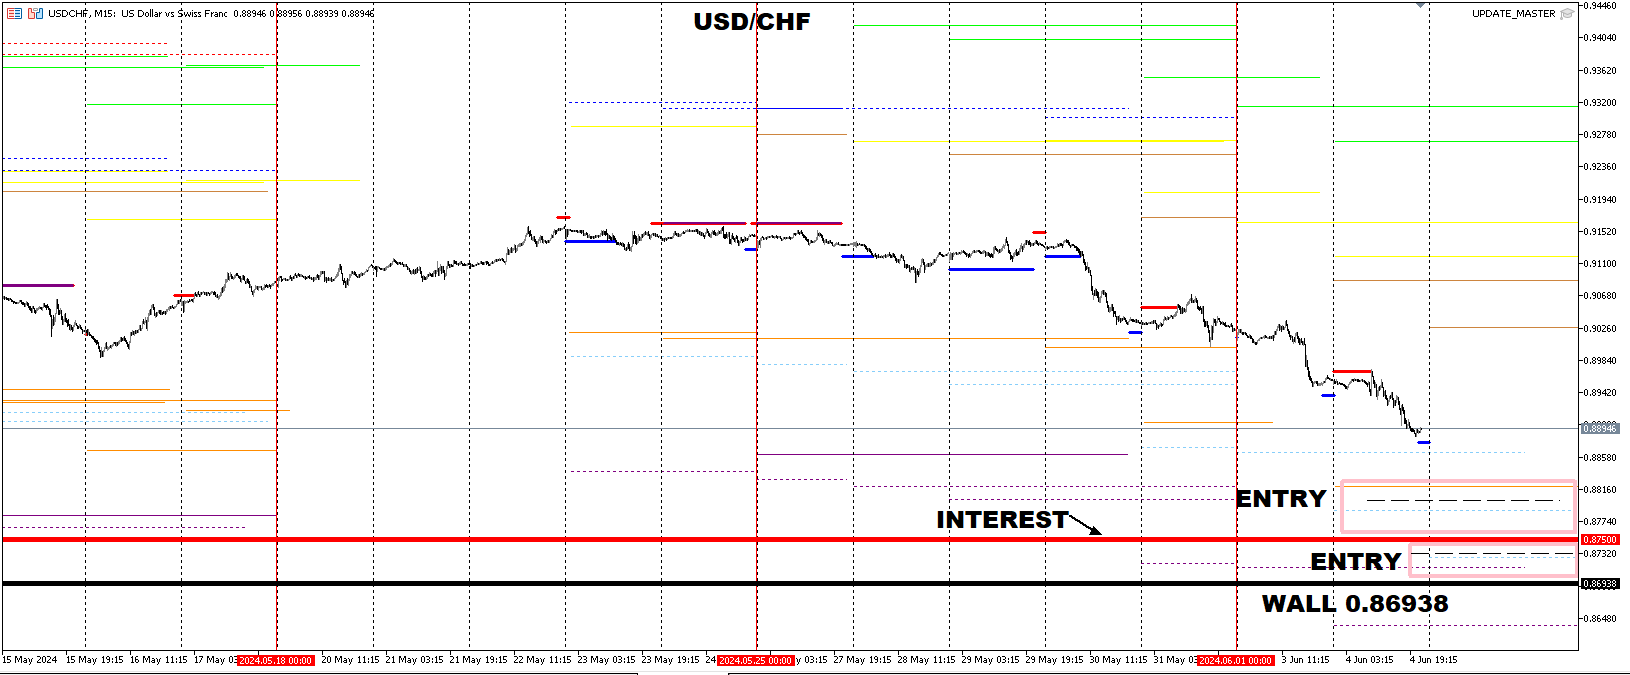
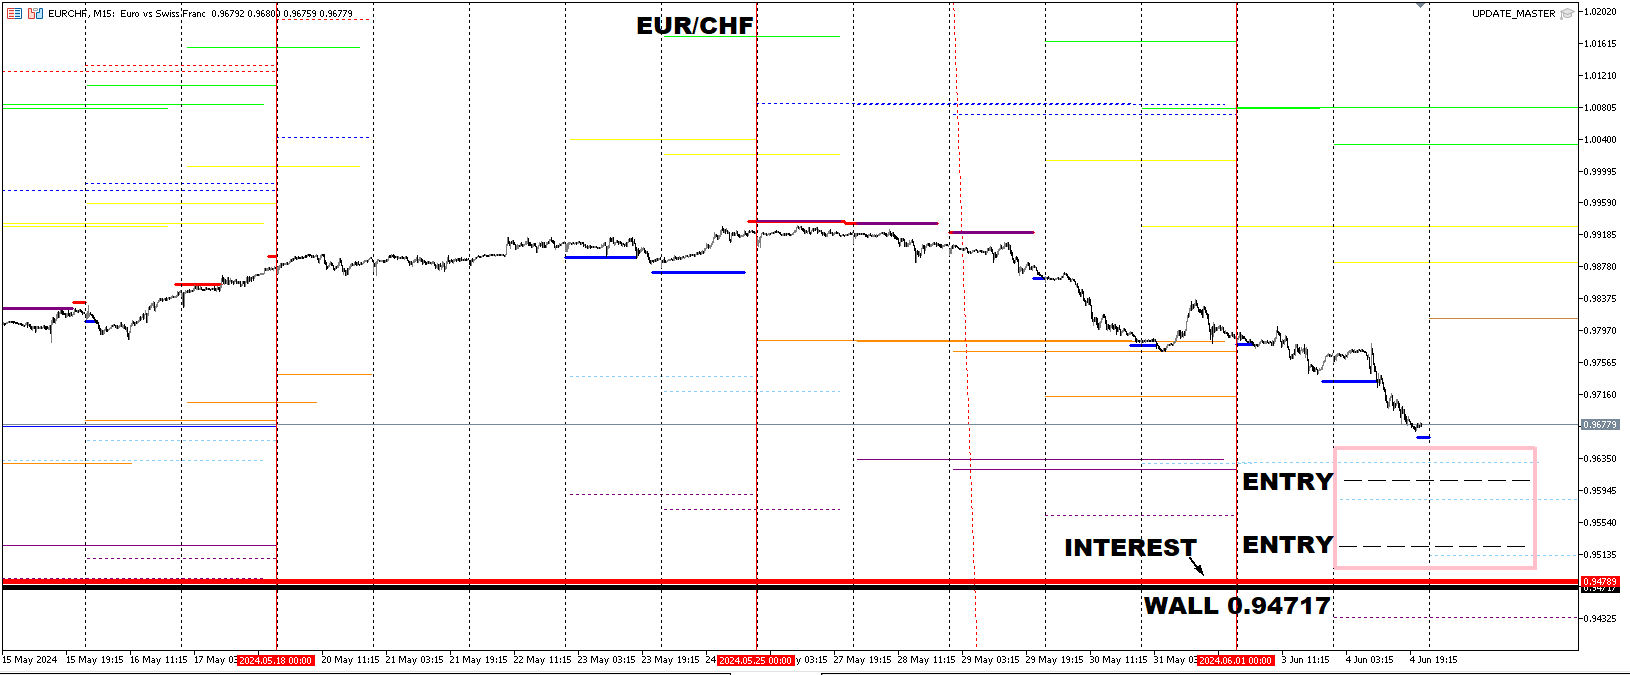
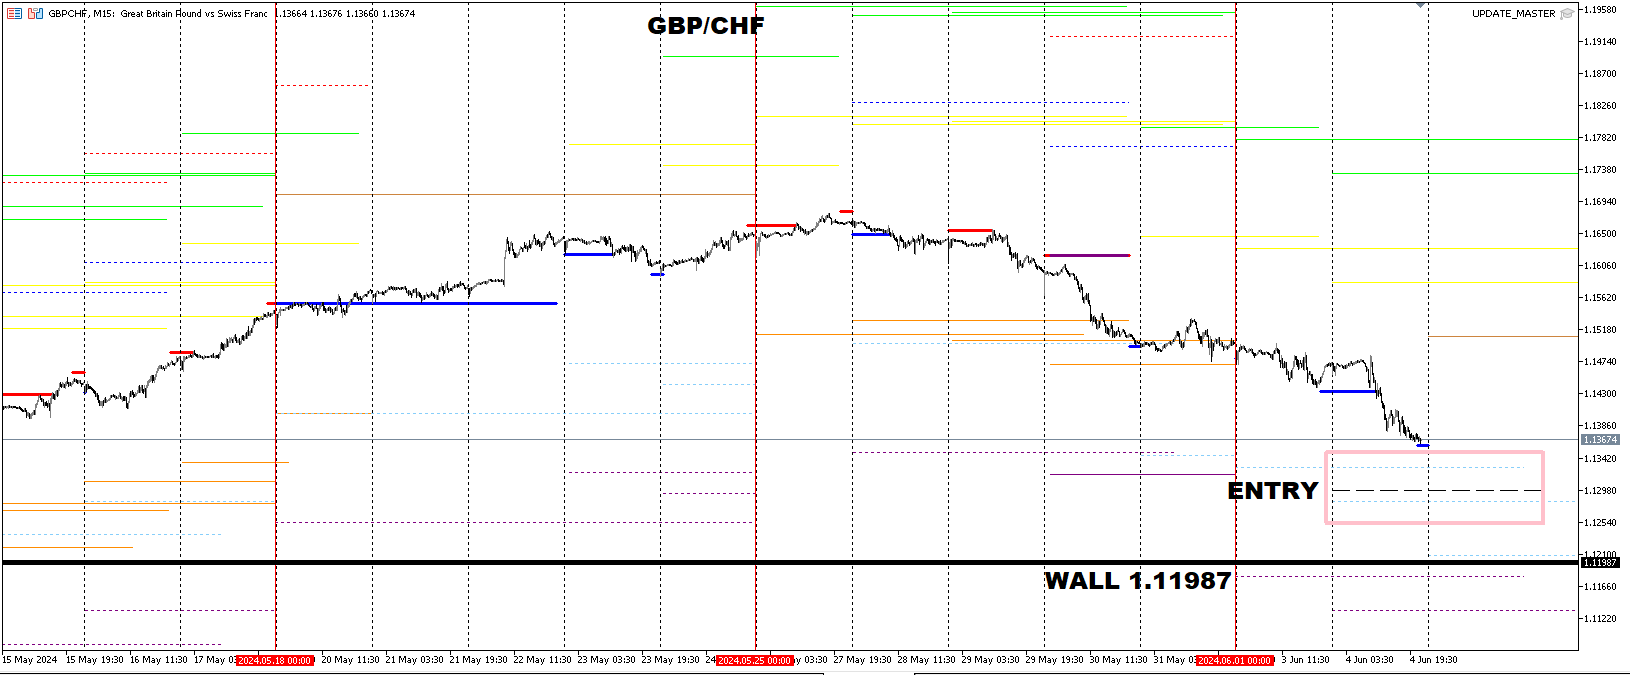
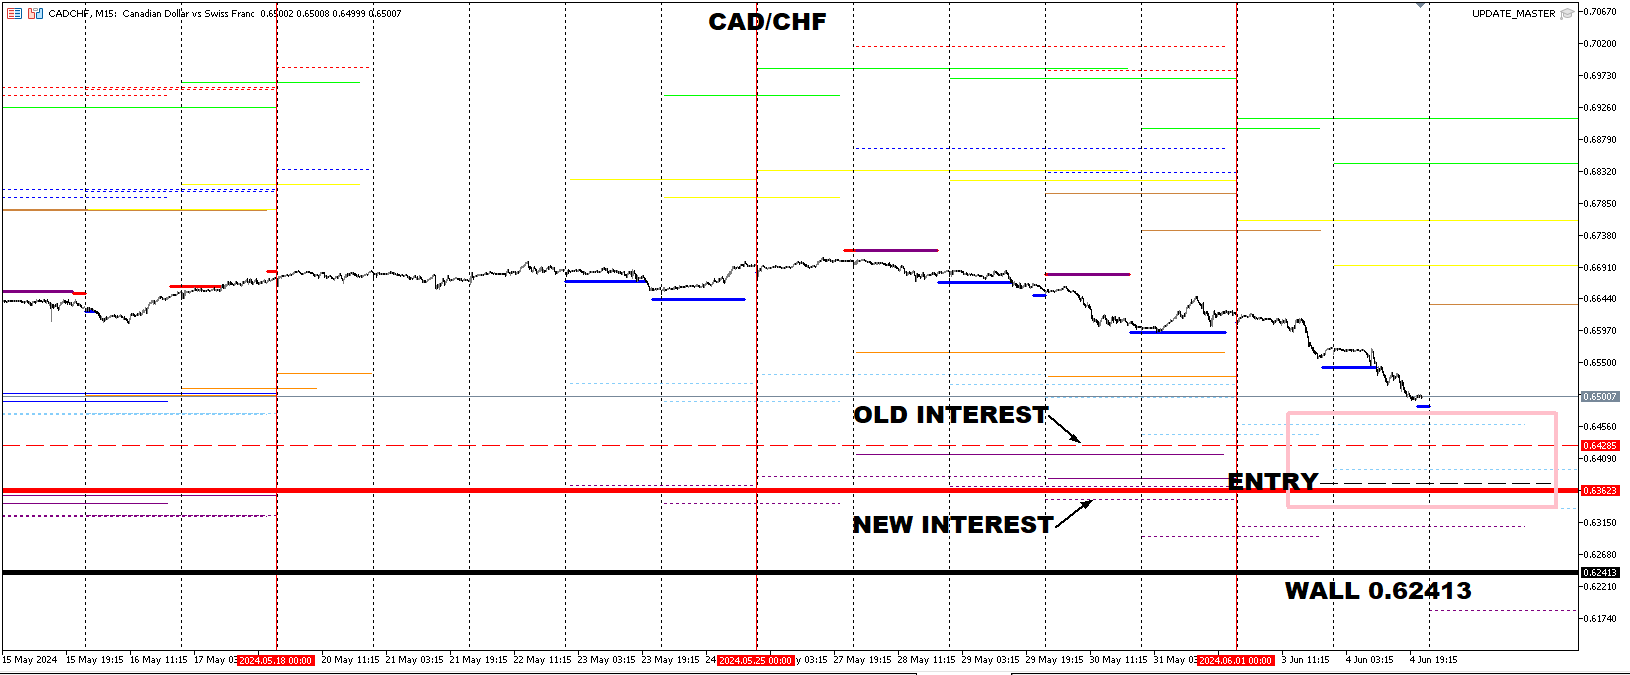
I'm back with a few updates on some upcoming entries I'm about to take. It's been a while since I last posted because I haven't been seeing what I look for. I did miss a couple of opportunities but I've been mainly focusing on building a couple more EA's that I'm ready to showcase. But first I will display the wall templates for some of the CHF pairs. It's only 3 but these three are the main ones needed because they drive the rest. Price is approaching the wall on each one but I don't expect price to get there because though price can get in the area of the wall, It's rare that price breaks it. I will blend them with other templates to get what I believe to be good entries. I see this as a continuation setup with a subtle rollover.
-
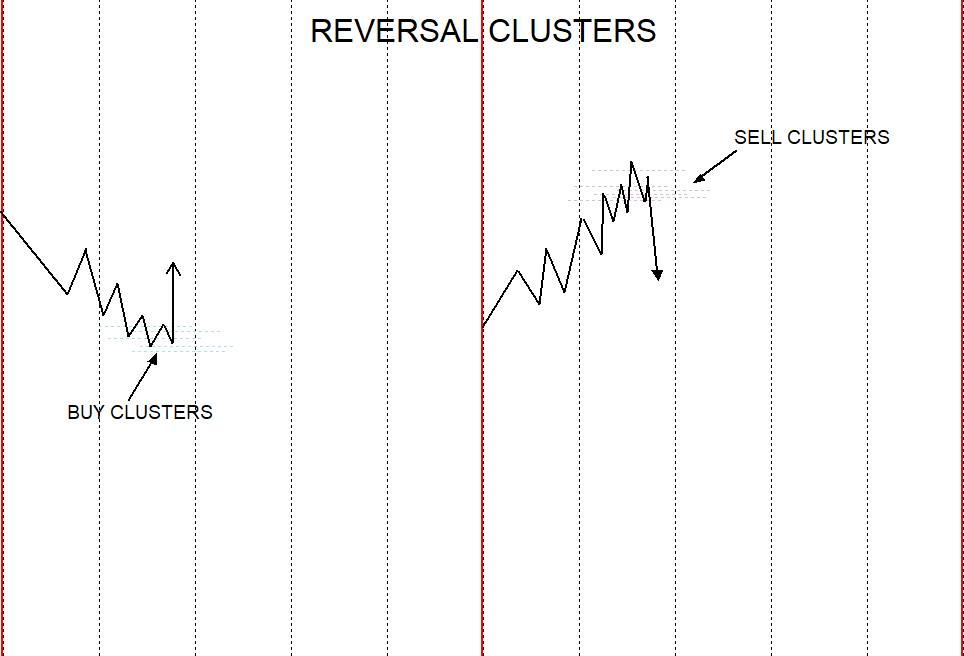
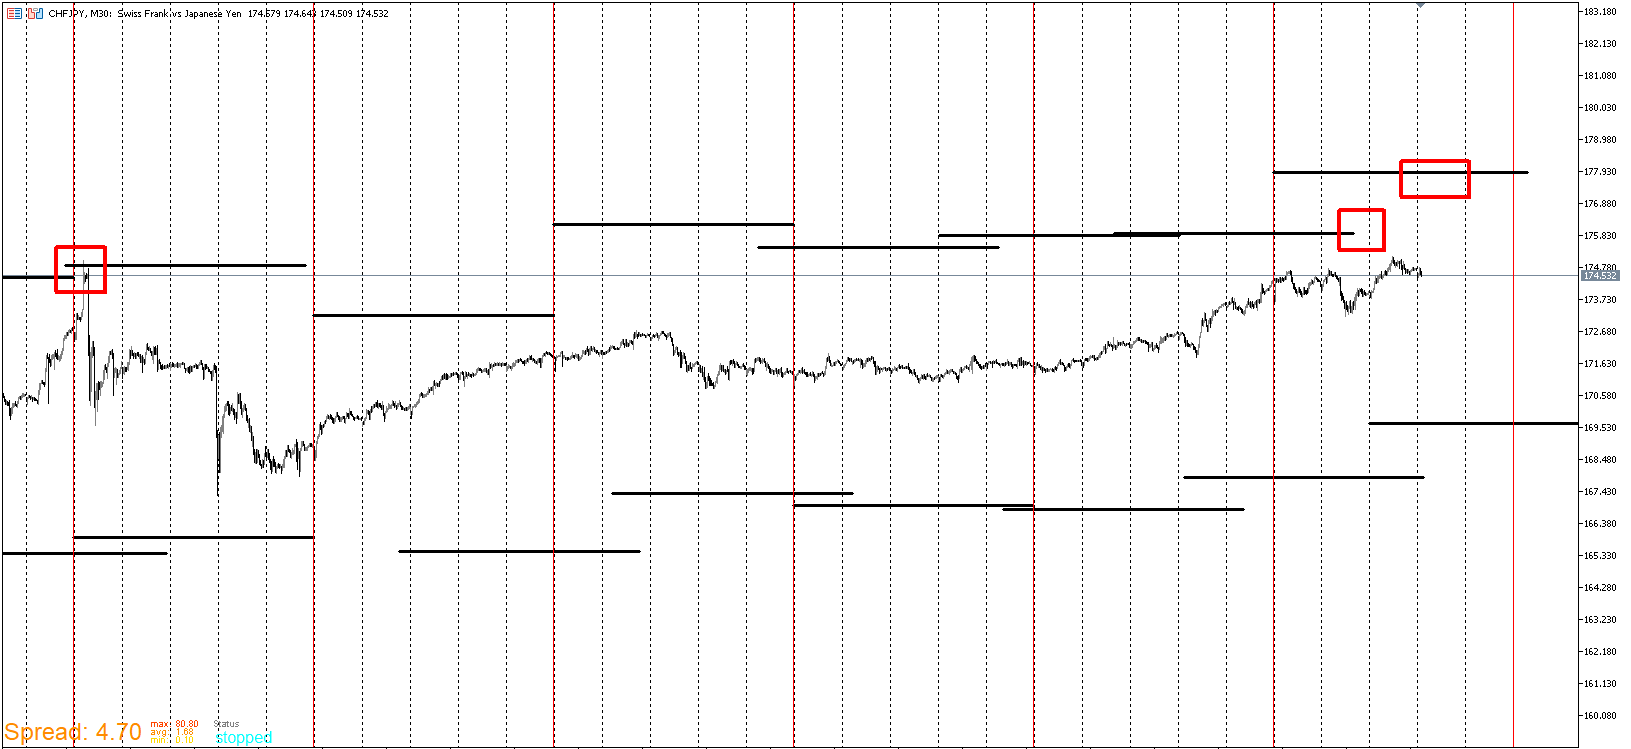
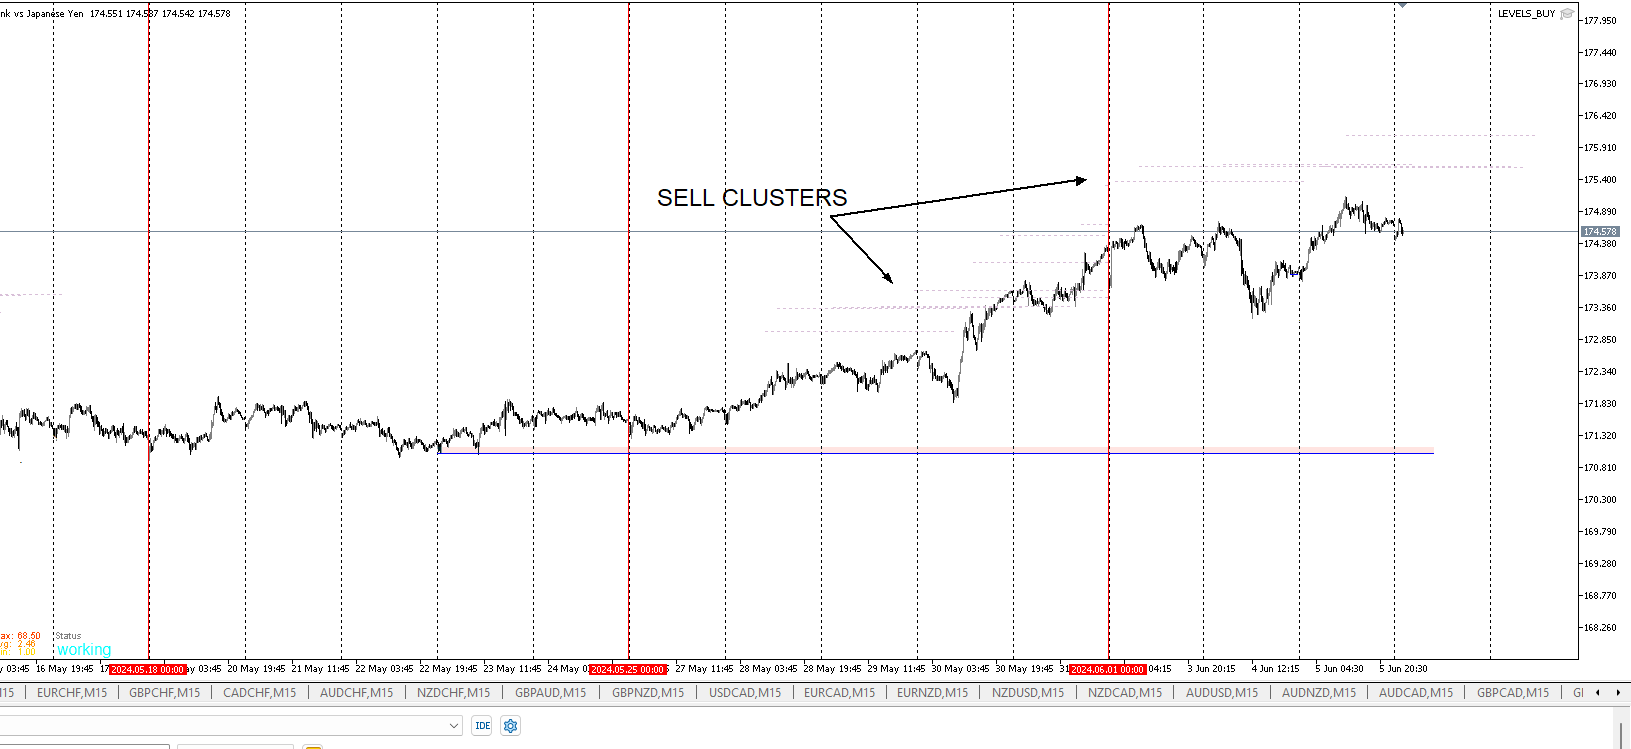
Here's one of the new indicators that I refer to as the Cluster Temp. When price enters these zones I look to enter but only if other templates are confirming. It's rare that price enters these zones and sometimes it turns just short of it. I'm only interested when price digs into them. Usually when price does reverse, It does so aggressively. A small number of candles can undo the a day or two worth the price movement it took to get there. Depending on how likely I see a reversal, these zones are where I want to enter. Buys are the powdered blue, Sells are the thistle color.
-
The pink boxes and blue lines are indicators that I will explain later.
-
I touched on Template 4 in my earlier posts. I'm using it as a continuation setup also. The blue dotted levels as well as the purple dotted are assumed to be strong levels to enter around. Sometimes price continues through, but it's rare. I still think it's more likely that price will resist the wall. There's a chance it may come close, but I'm not seeing it break and continue. Also I'll note that when price aggressively pushes down toward the beginning of the blue or purple dotted lines, that makes a reversal more probable especially if it crosses before the start of it. There are also interest levels both old and new. Price may not hit them but rather come close.
-
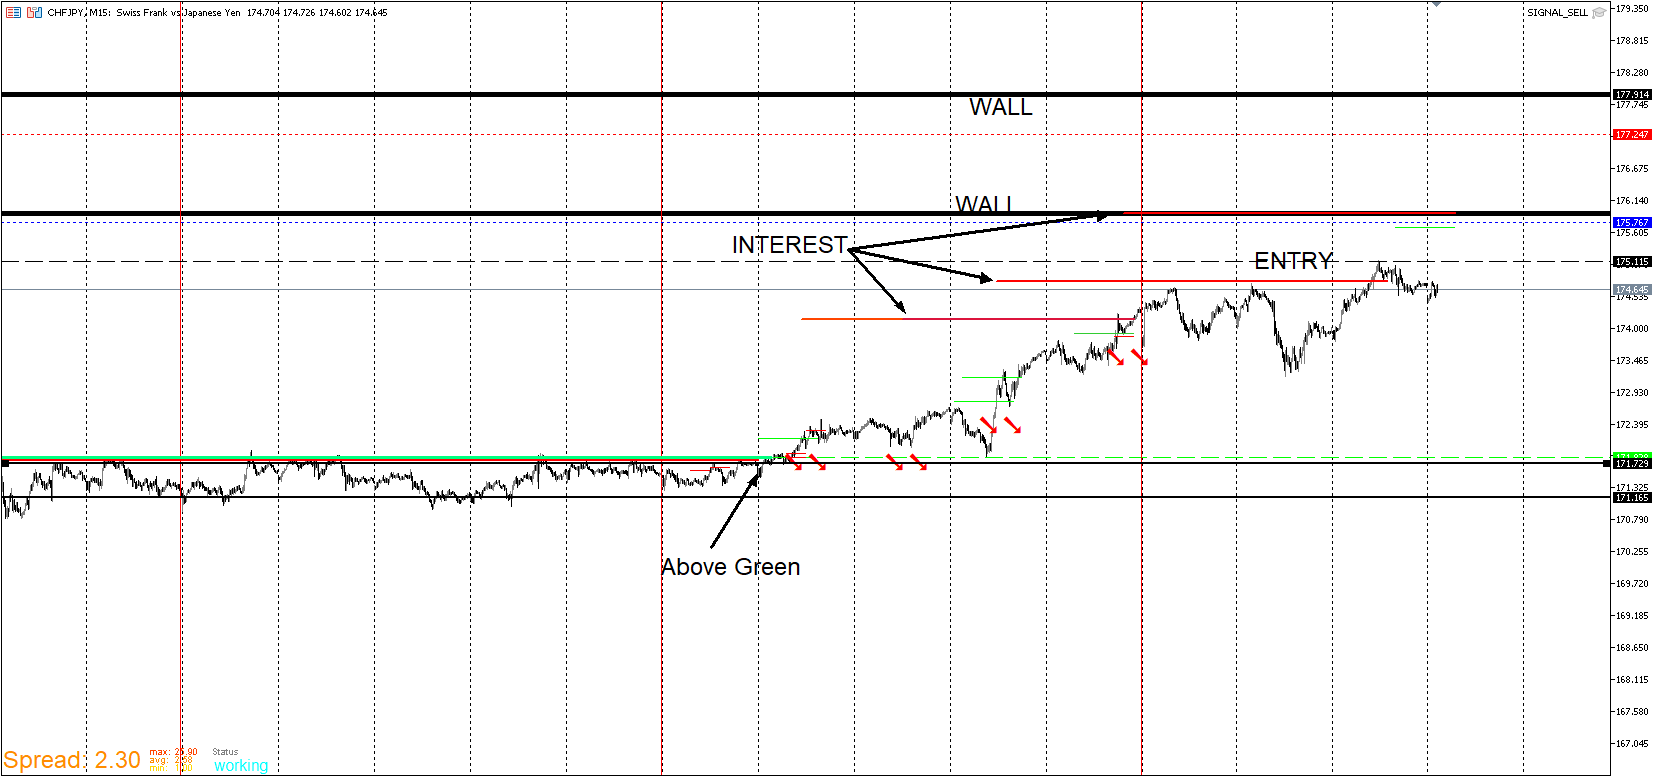
I didn't enter on any of the JPY pairs a few weeks ago. I did just enter a CHF/JPY sell. If it continues to push up, I have better entry zones assuming that it squeezes up the next two day. I prefer to see a longer up trend after that high was put in on 4/29. I entered recently in case it don't push up further soon.
Here is the temp 4 version.
In an uptrend if I'm expecting a reversal, the blue and red dotted lines are where I predict the high to be put in place. If price gets here rapidly in a day or so, I will sell from these zones.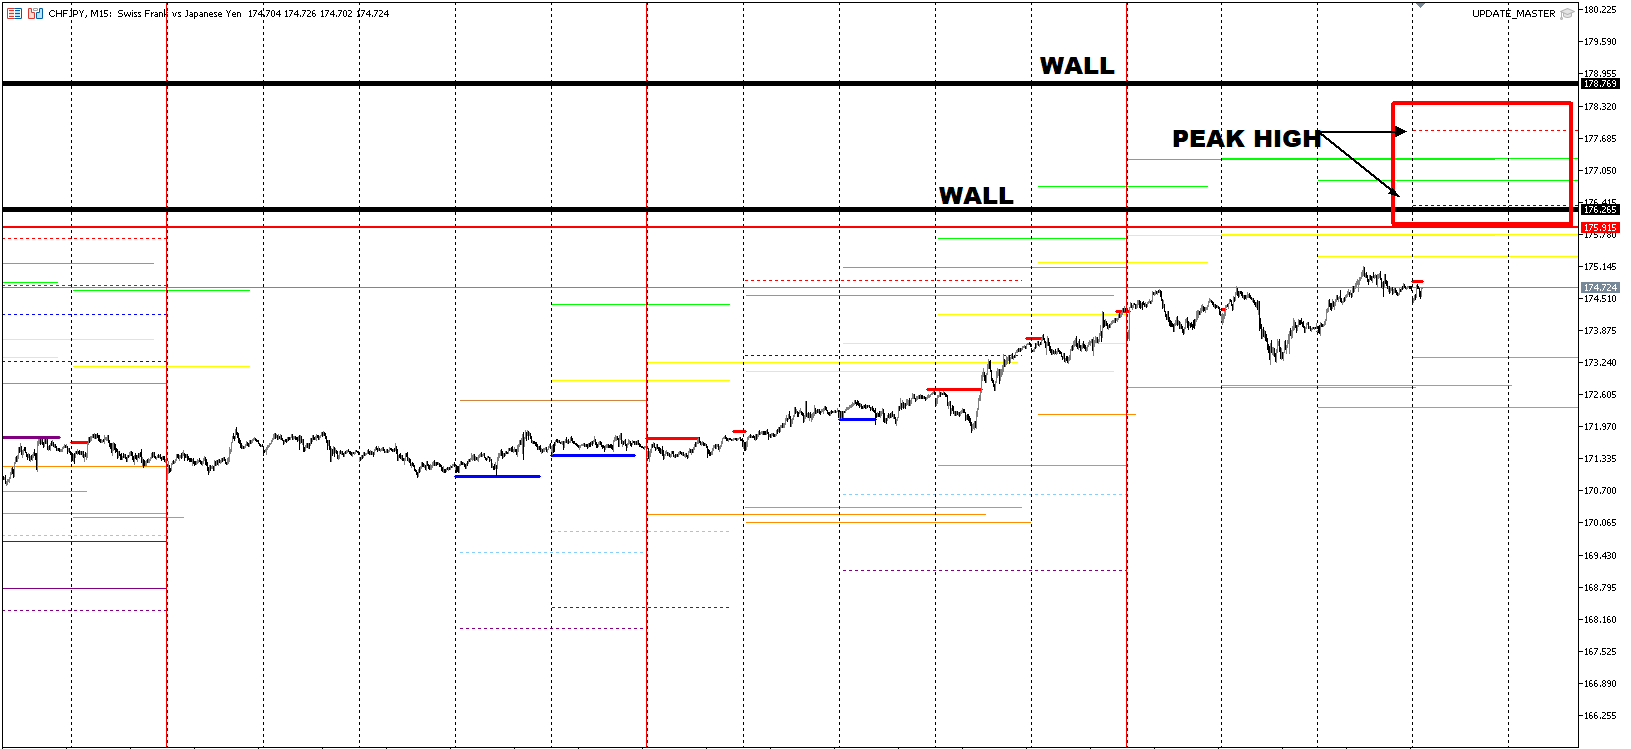
-
Existe enlace de este proyecto de EA?
-
@DragonZueloTrends Unfortunately no links. I put a lot of time and trial and error creating them.They are all completed projects and this thread exist to display the predictive capabilities of them all combined and used correctly. I'd be happy to lease everything as a package. But first there needs to be documentation of forward testing of at least a year before that's possible.