My EA update
-
Correcto comprendo, gracias ppor el dato
-
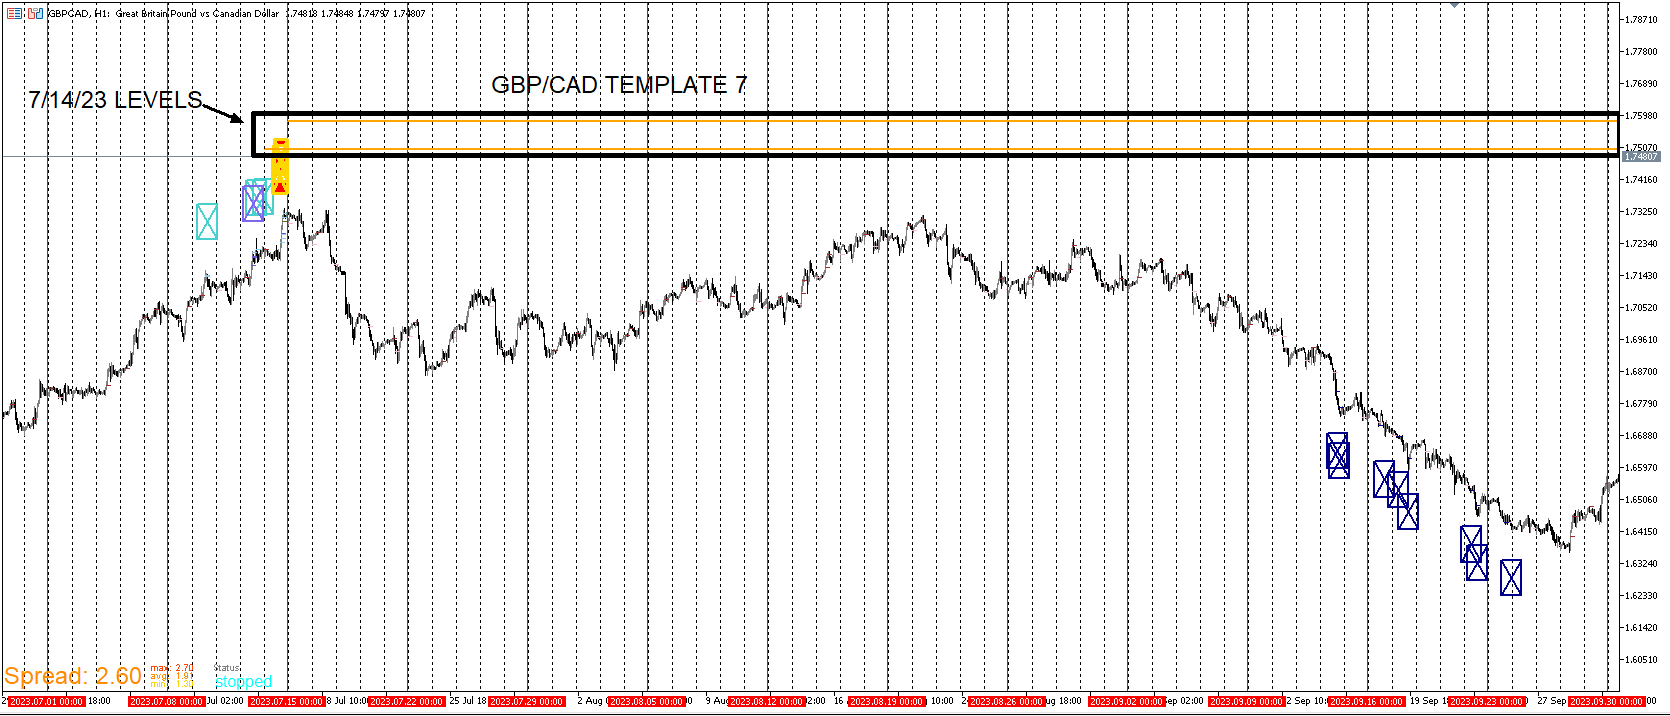
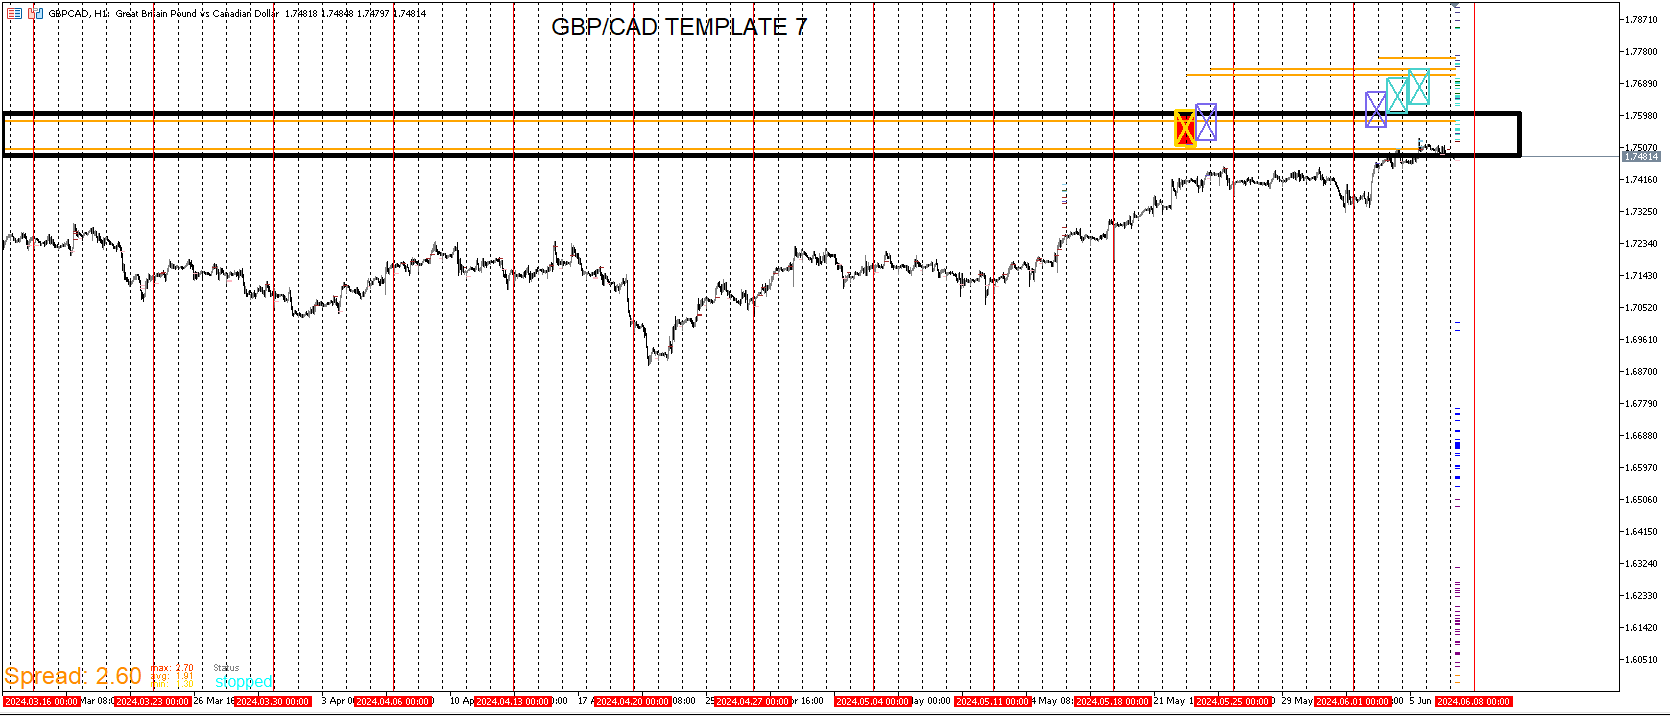
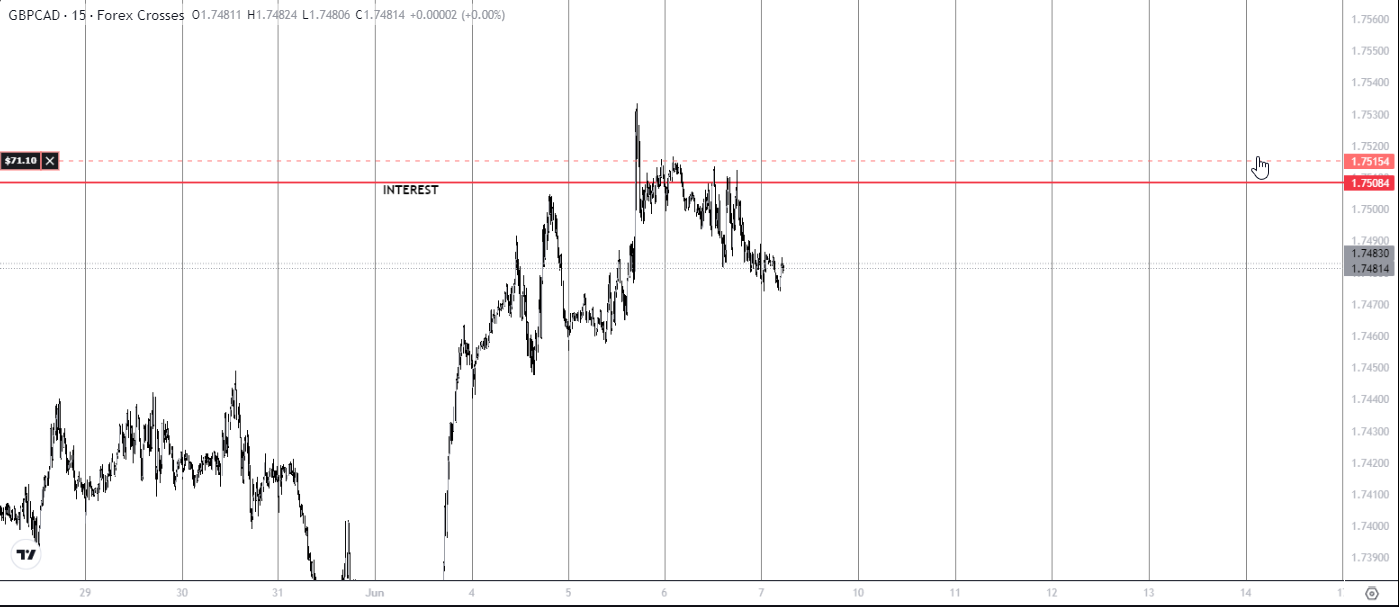
I have recently taken a GBP/CAD sell utilizing the interest template and Template 7.
-
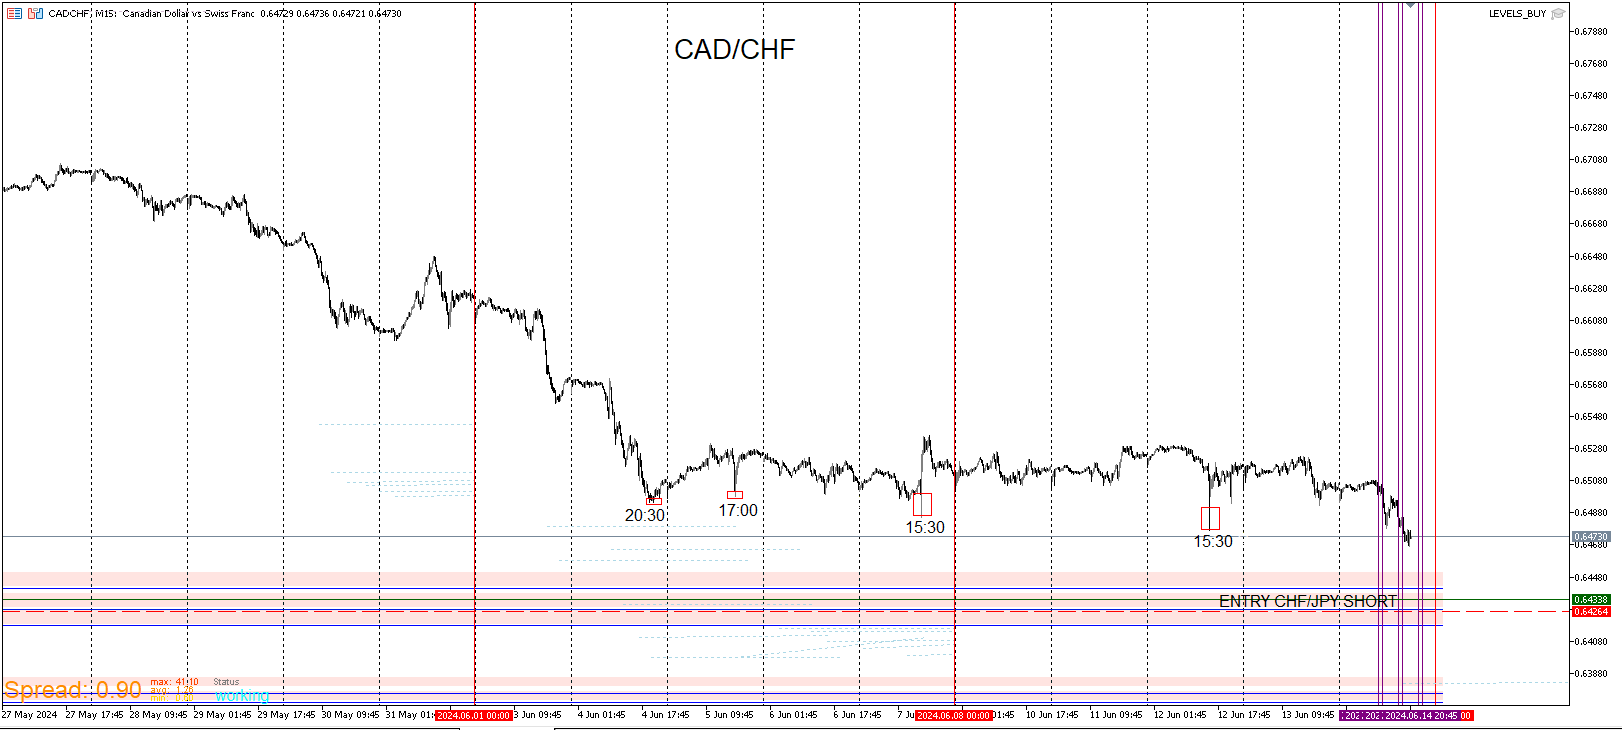
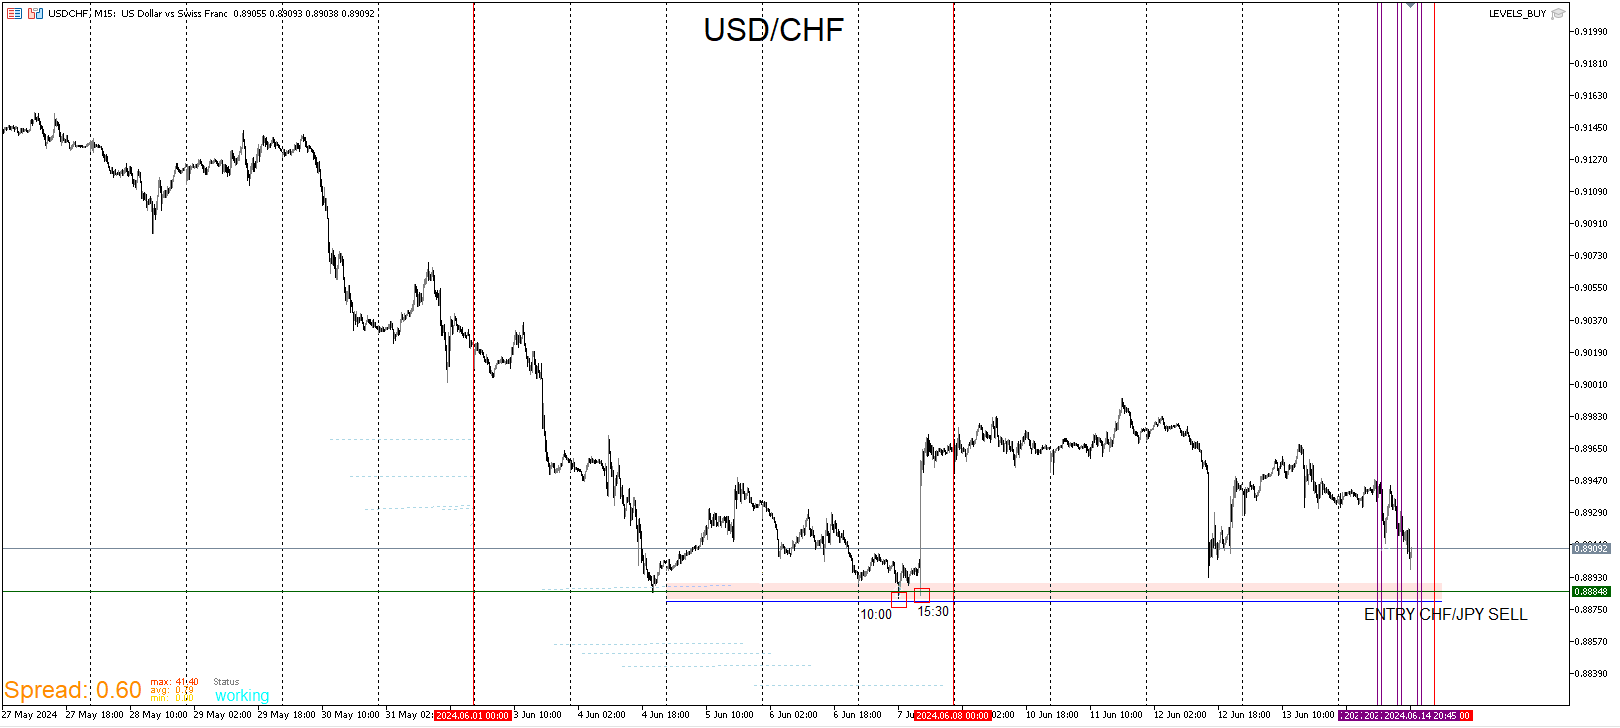
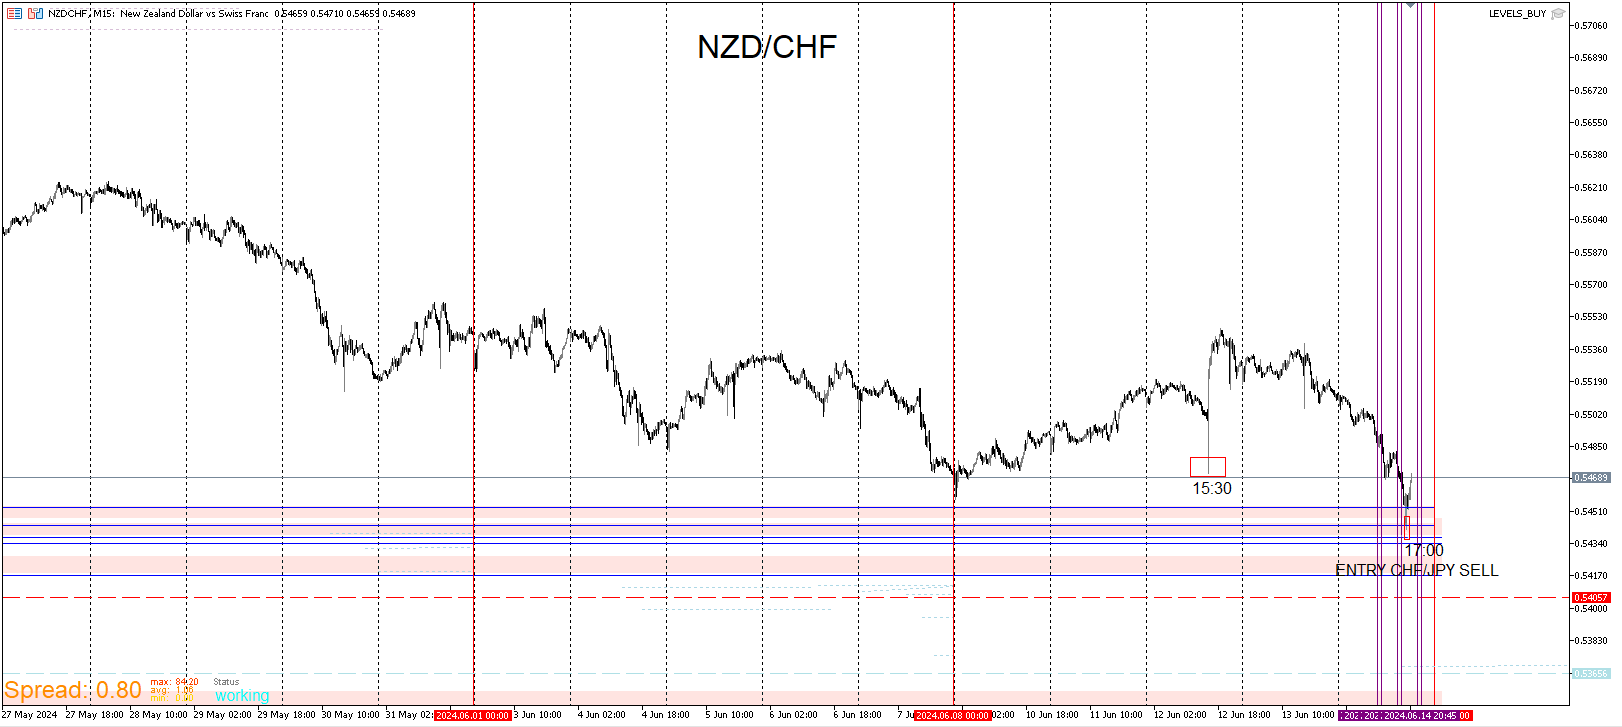
I am long the CHF pairs now and will go into detail to why I entered. Except for AUD,CHF and NZD/CHF I believe that those two pairs will still push down more
AUD/CHF ENTRY: 0.58654
NZD/CHF ENTRY: 0.54399 -
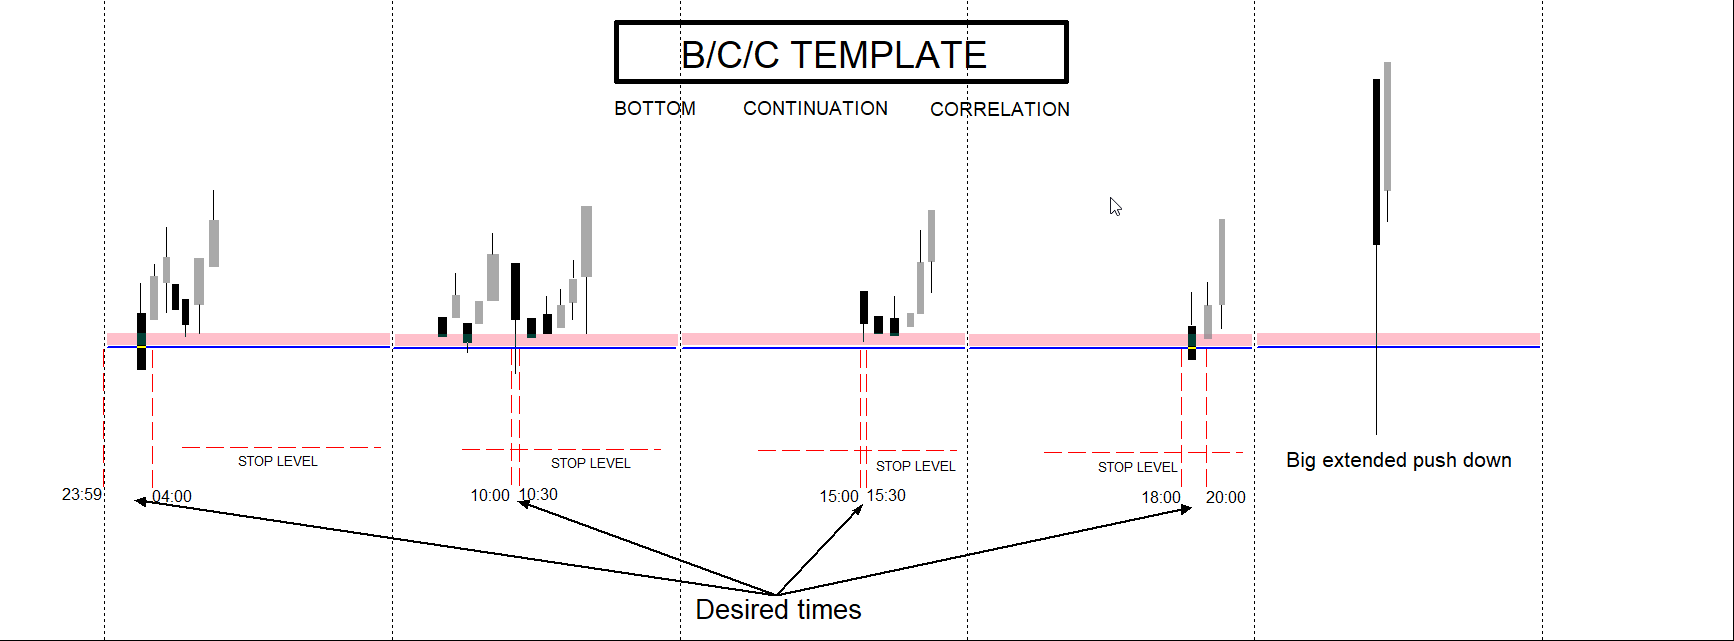
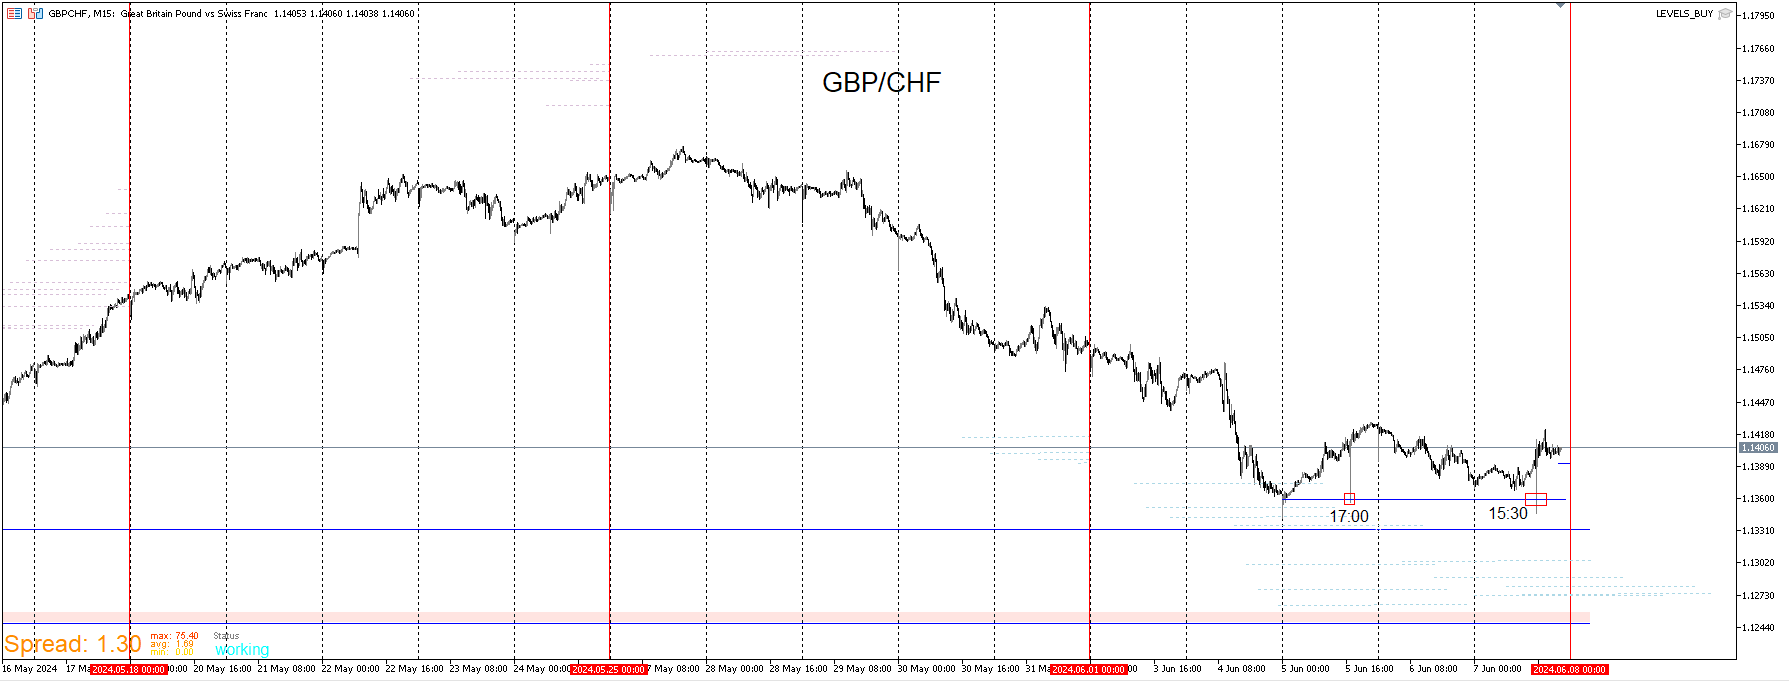
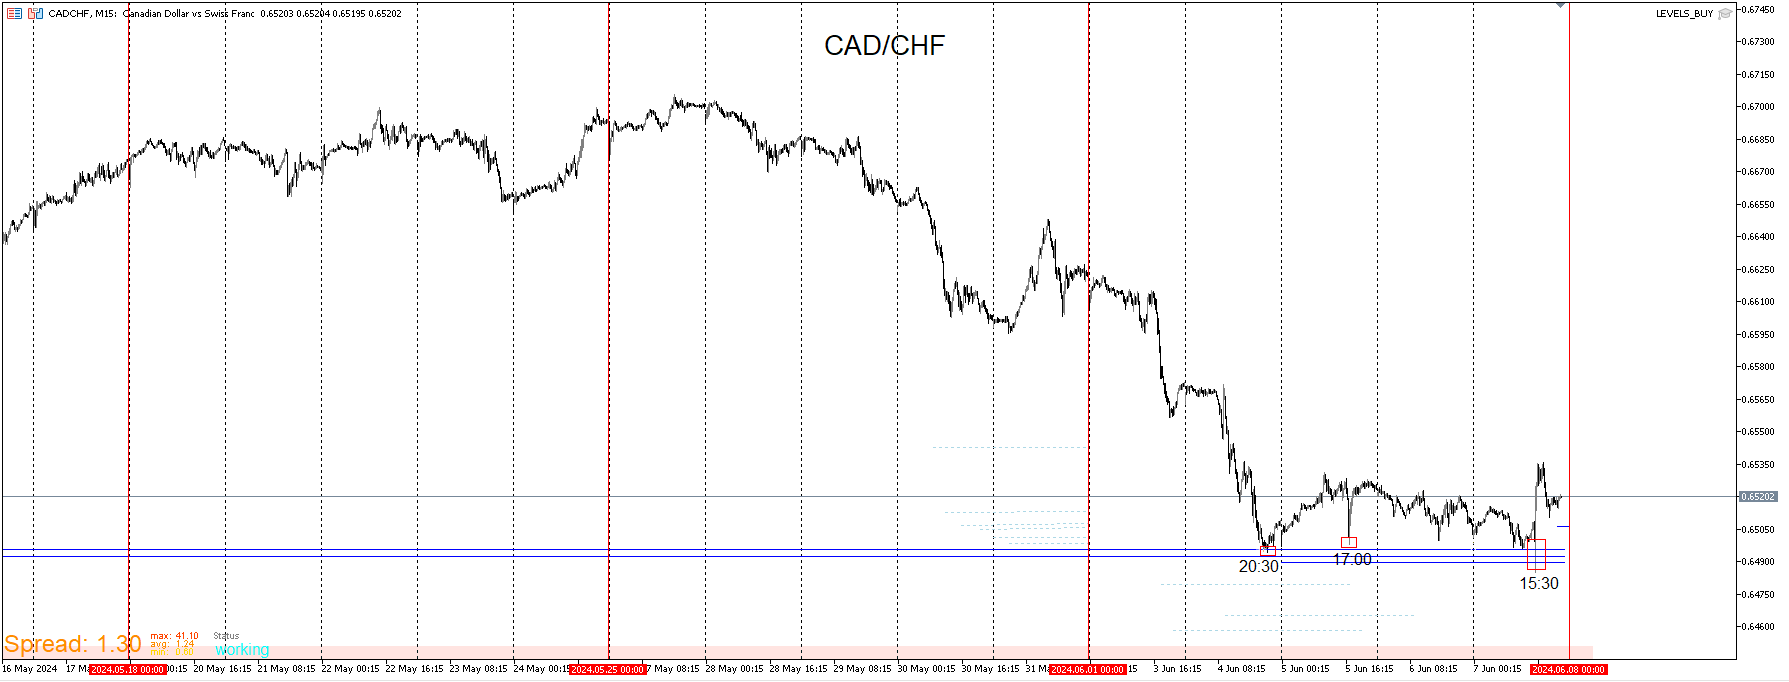
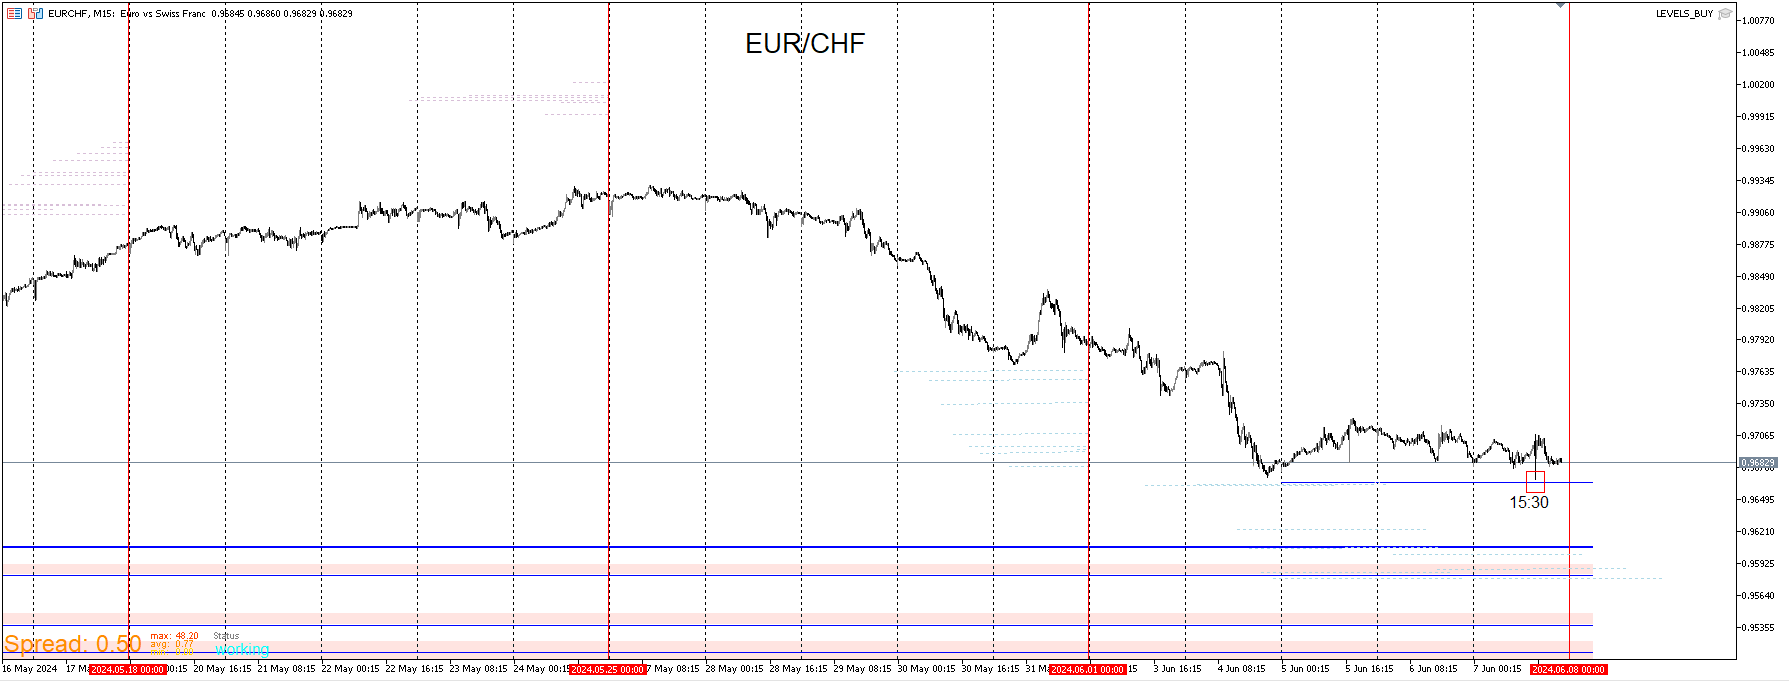
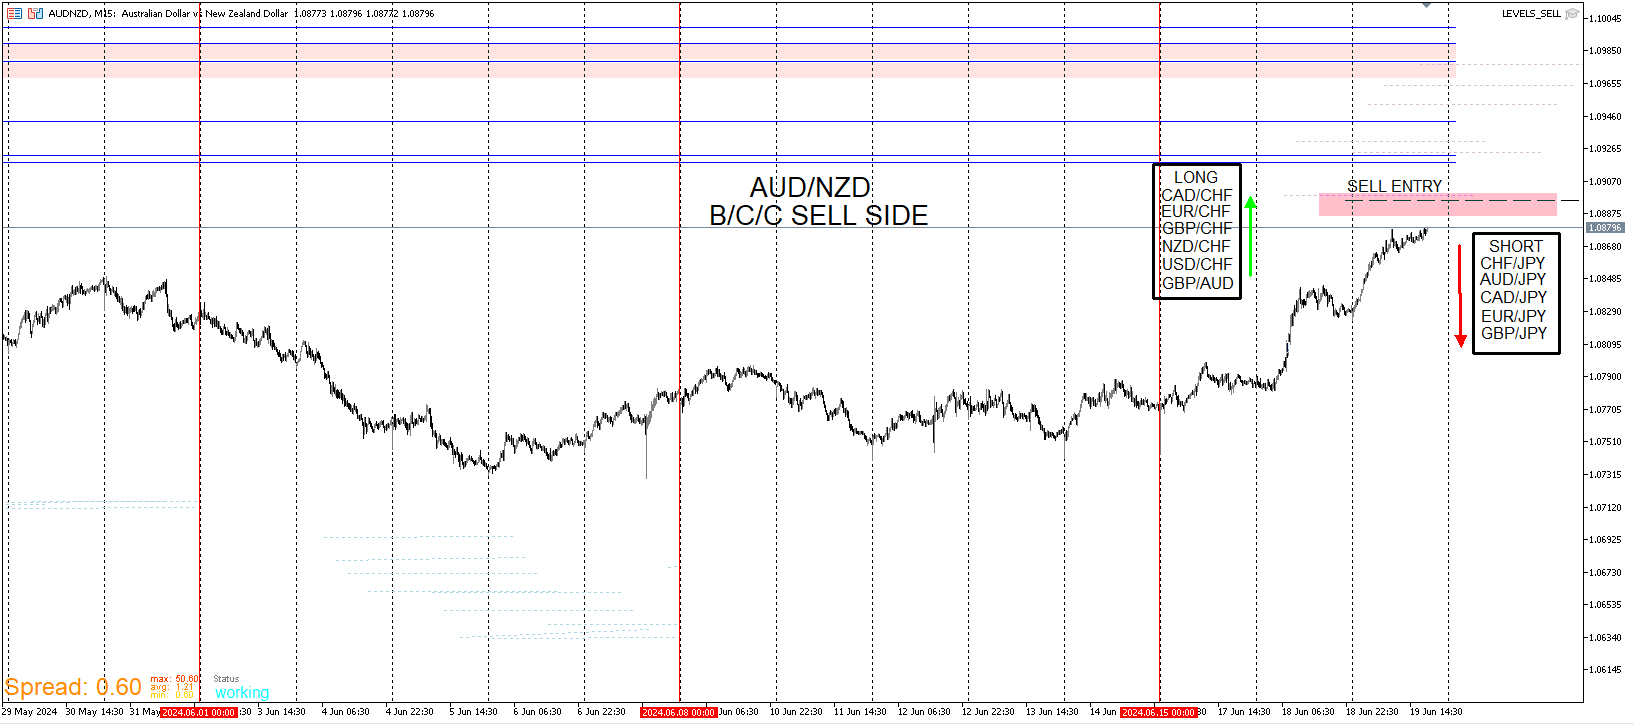
The latest template I've been working on is the B/C/C Template. It's used to detect potential bottoms, as continuation entries after I believe the bottom was put in a while back, and correlation which I'm still studying and will go into detail later. The idea of these levels which is the blue line and the pink box over it. When price breach these objects, they are supposed to delete which it does most of the time. Rarely I'll enter on these levels but what's most important is when they stay intact. And when they do stay intact and price pushes up, what time did the cross happen. The desired times are displayed in the image. For example from 10:00 to 10:30 are desired times. So it can happen at 10:00 or 10:30 and anything in between that. That doesn't mean that it doesn't happen on other times, It does but rarely and price usually comes back down. I need to test this more but so far these times offers better probability. These examples aren't exact at every time. Like other patterns in price movements, there are variations and nothing is the exact same but behaviors can be similar.
1st question: Is price approaching the level? Yes
2nd question: are other pairs of the the same currency approaching their respective levels? Yes
3rd question: Did majority of the pairs breach the level but the levels remain intact? Yes
4th question: Did the crosses happen during the desired times? Yes
5th question: Is my Bias Long based on other templates even though some conditions may not have been met in those other templates? Yes
6th question: Do I have a short bias on a pair that has total opposite correlation? YesWith Yes being the answer to all of those, I will place the trades. Whether it works out or not, these are the types of setups I will take like a robot.
-
BCC TEMPLATE CHF PAIRS
-
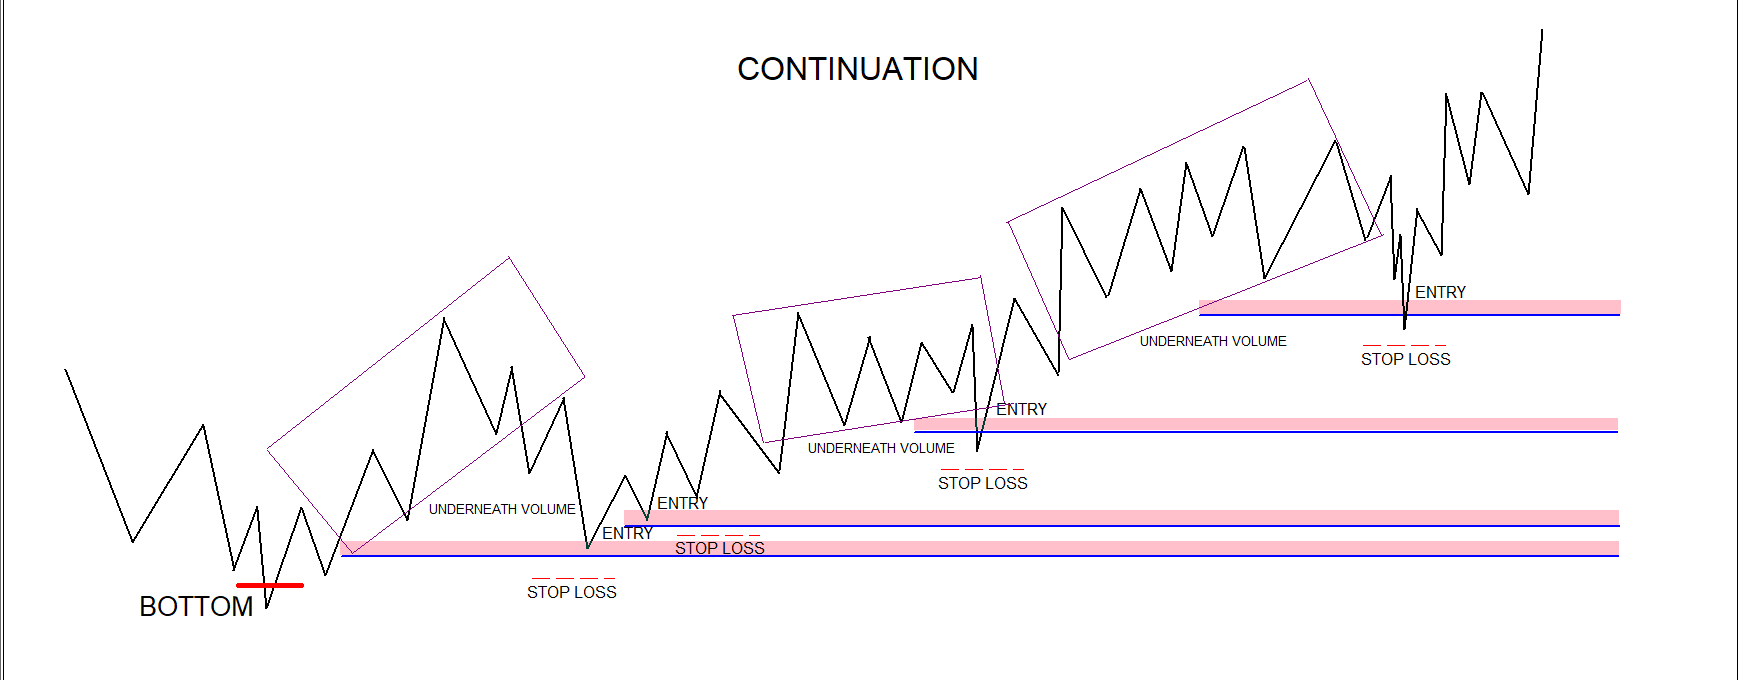
Here is a continuation example. It's a basic explanation of what I look for assuming that a bottom was put in. Lets say if I missed the bottom. More times than not, price will come back down and get underneath the positions that gone long. This can take few weeks to set up so patience is necessary. Each entry should be underneath positions that has already gone long. The times still apply here and are one good way of filtering out which levels are likely to not hold up. Price sometimes come back to the level a second time over the course of a few days. I'm not a fan of buying as price gets higher, but when I do, this is how I go about it.
-
@JayPhillbrooks Hello, thank you for all the information you share. In this last image, are the reaction zones you use supply and demand zones?
-
@DragonZueloTrends No not at all. It looks that way but it's actually an opening range strategy that draw those zones out. I have a sell version as well. I've heard about supply and demand stuff but it's just not how I analyze.
-
@JayPhillbrooks Esta muy interesante para aplicar en Kill Zones, a primera vista da la impresion de que usarias bos y choch + las zonas de oferta y demanda para realizar esas entradas pero me da curiosidad de conocer cual es el metodo que tu usas, estare atento a tus actualizaciones amigo, gracias por compartir.
-
@DragonZueloTrends I can see why it gives that impression. And yes Break of Structure and Change of Characters are viable. The problem is that like any other strategy or analysis, every one of them shouldn't be take because by doing so isn't profitable in the long run. My method generates levels that gives solid likelihood. Even then there's still discretion and other things must line up. These levels can generate around/below BOS zones and CHOCH. They also don't. You can spot a BOS but how do you know when the best time to enter? Price can reverse 5 pips below or 500. None of my EA's look at market structure.
-
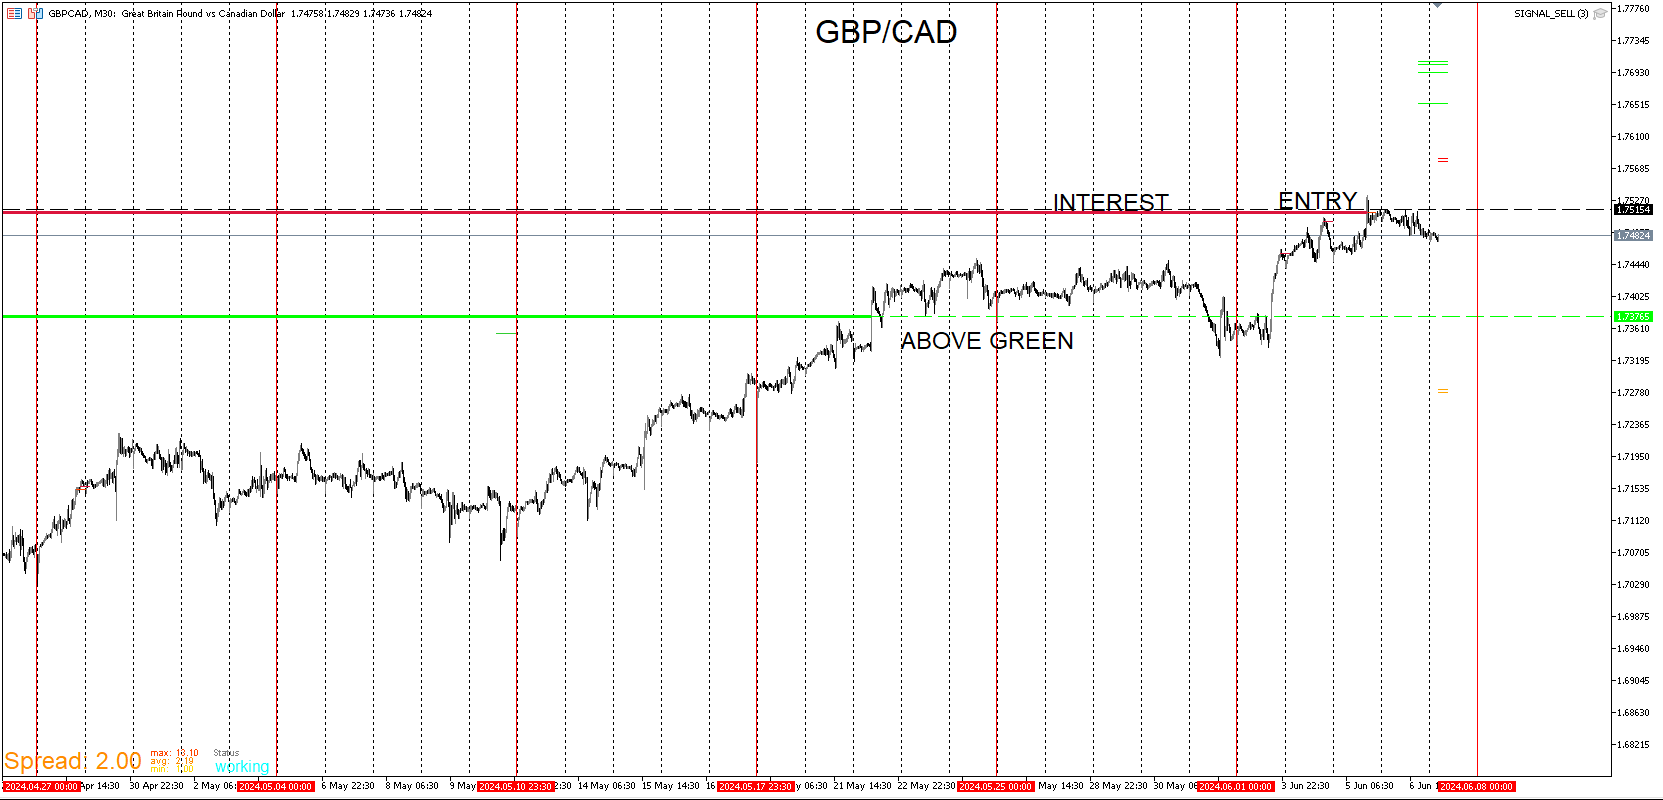
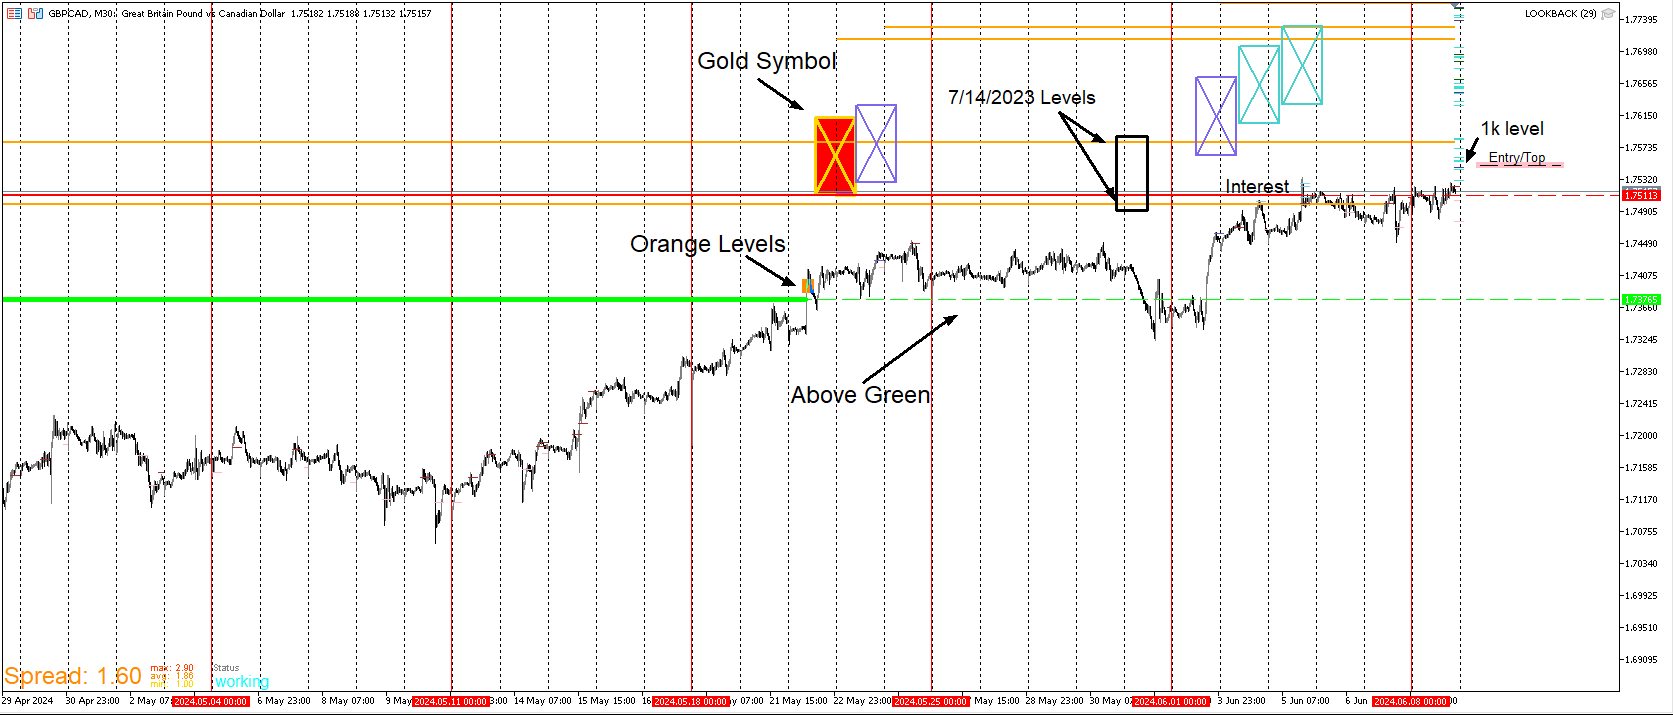
Here I will go further into my short bias for GBP/CAD. This is another example of blending templates together to get the most optimal entry. I make assumptions based on these levels that are generated by the EA's.
Green Line- In this sell bias, I don't look for price to reject from it to the tick. That's a rare case. I need to see price accumulate past it. I may not know when to enter but what I do know is that every reversal that make a big move, this is an indication of it coming. That can't be denied.
Orange Levels- Notice how they are right on top of the green line. This is one purpose of implementing the green line so that it would filter out entering on what I believe to be a strong level. The best entries are behind the orange levels. The Gold Symbol helps visualize when those orange levels are breached.
Interest- Interest combined with these other confirmations gives me more confidence. On top of that price is strattling along it as well as converging with levels from 7/14/2023 which usually show to be well defended on first contact after a long time.
I'm already short from these zones so I will just hold. There's always the possibility of price pushing up but this is how my eyes are trained to spot reversals and too many elements are lining up to not take the entry. Any pump up past last week's high I see as a selling opportunity.
-
Will go into detail later.
-
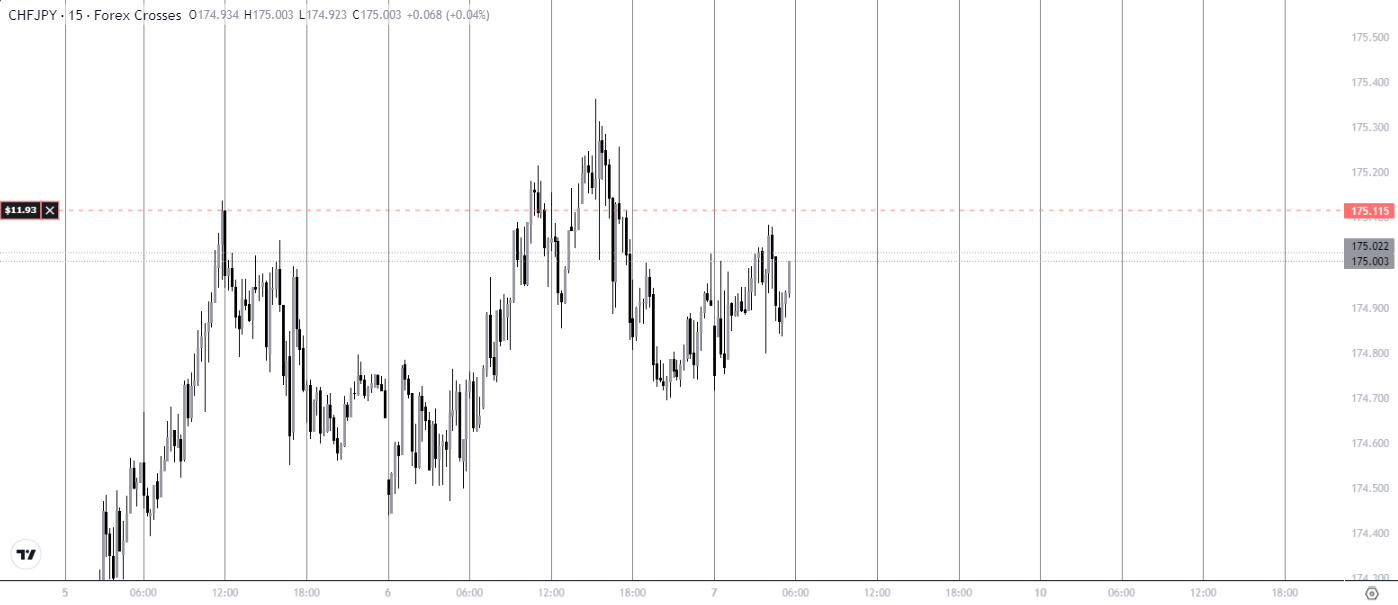
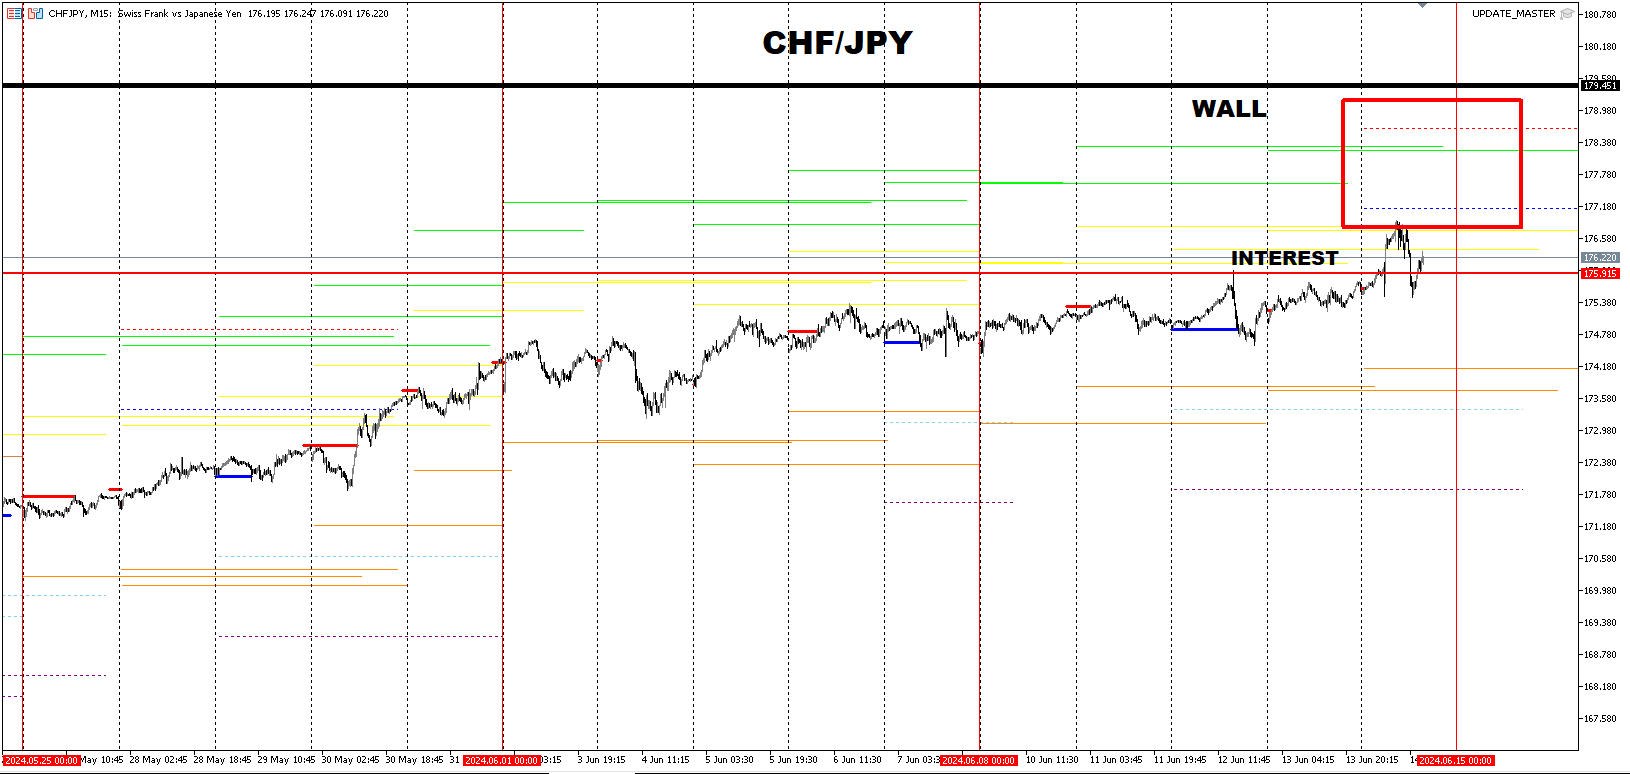
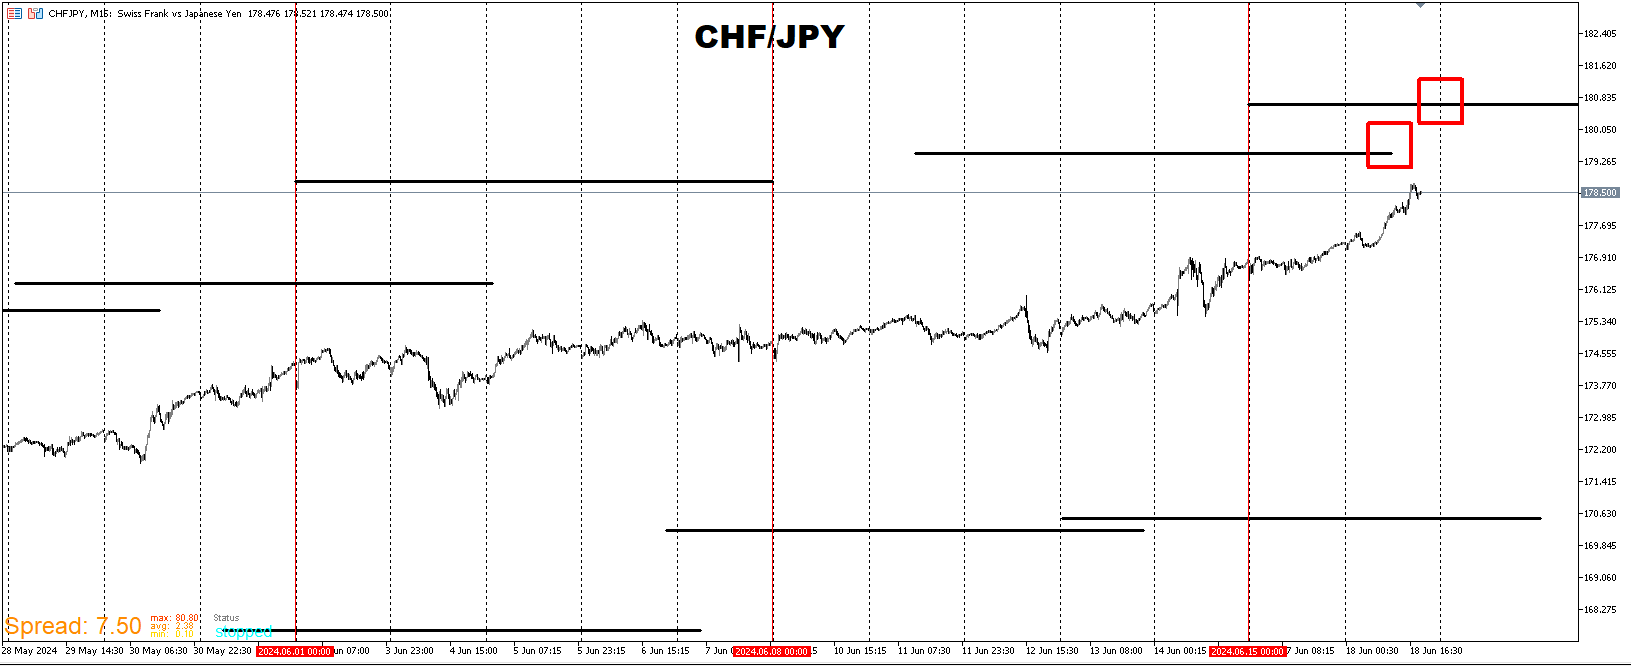
CHF/JPY seem to be squeezing up so I cut my positions for a small loss. I was looking for a subtle rollover and it's still possible but right now it's possible that price may spike up and if it does, I'm looking to re-enter at or past the walls. I like to see price push to 2 lines because it offers more likelihood for a reversal. If price pushes up to these levels really soon as in a session/day, I'm automatically selling from these levels.
-
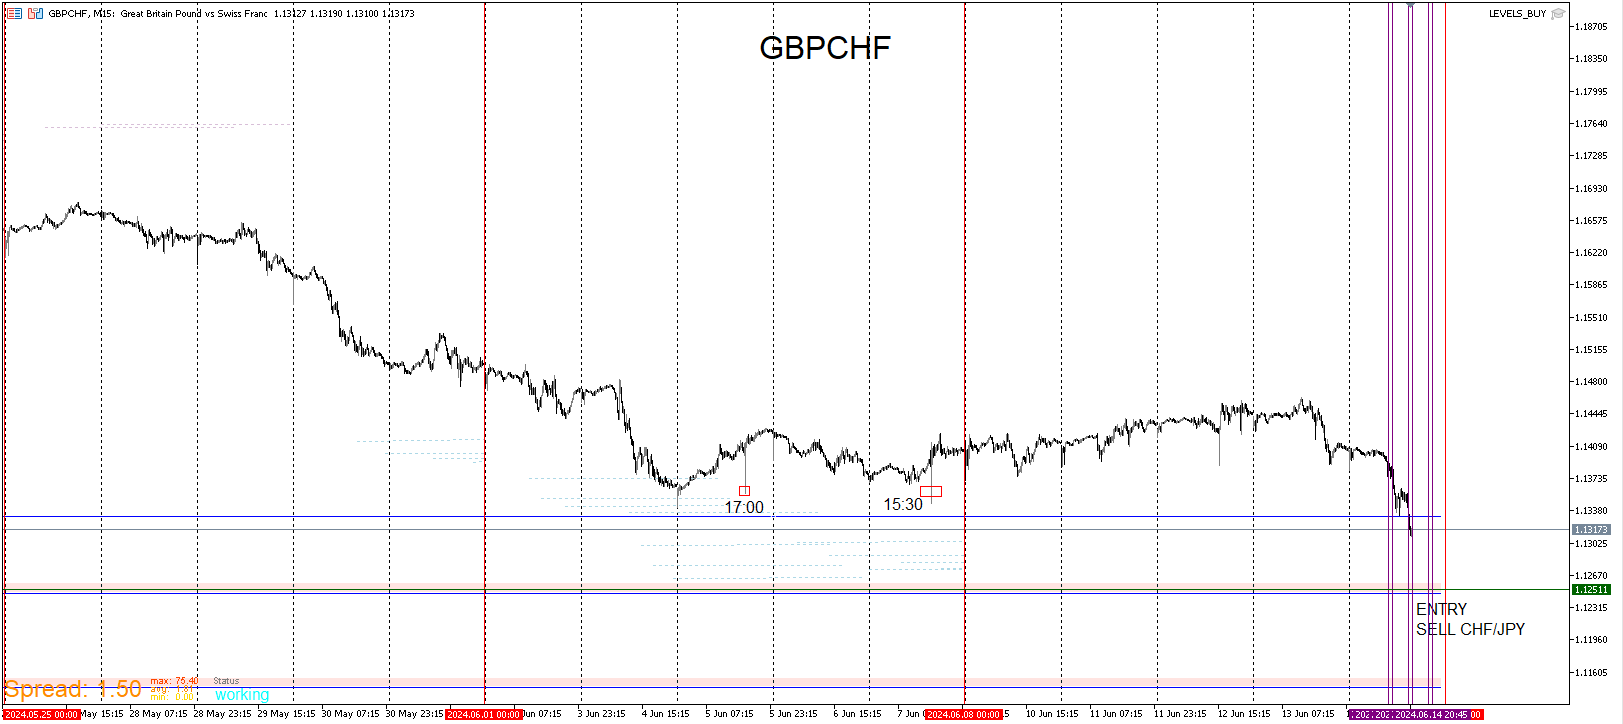
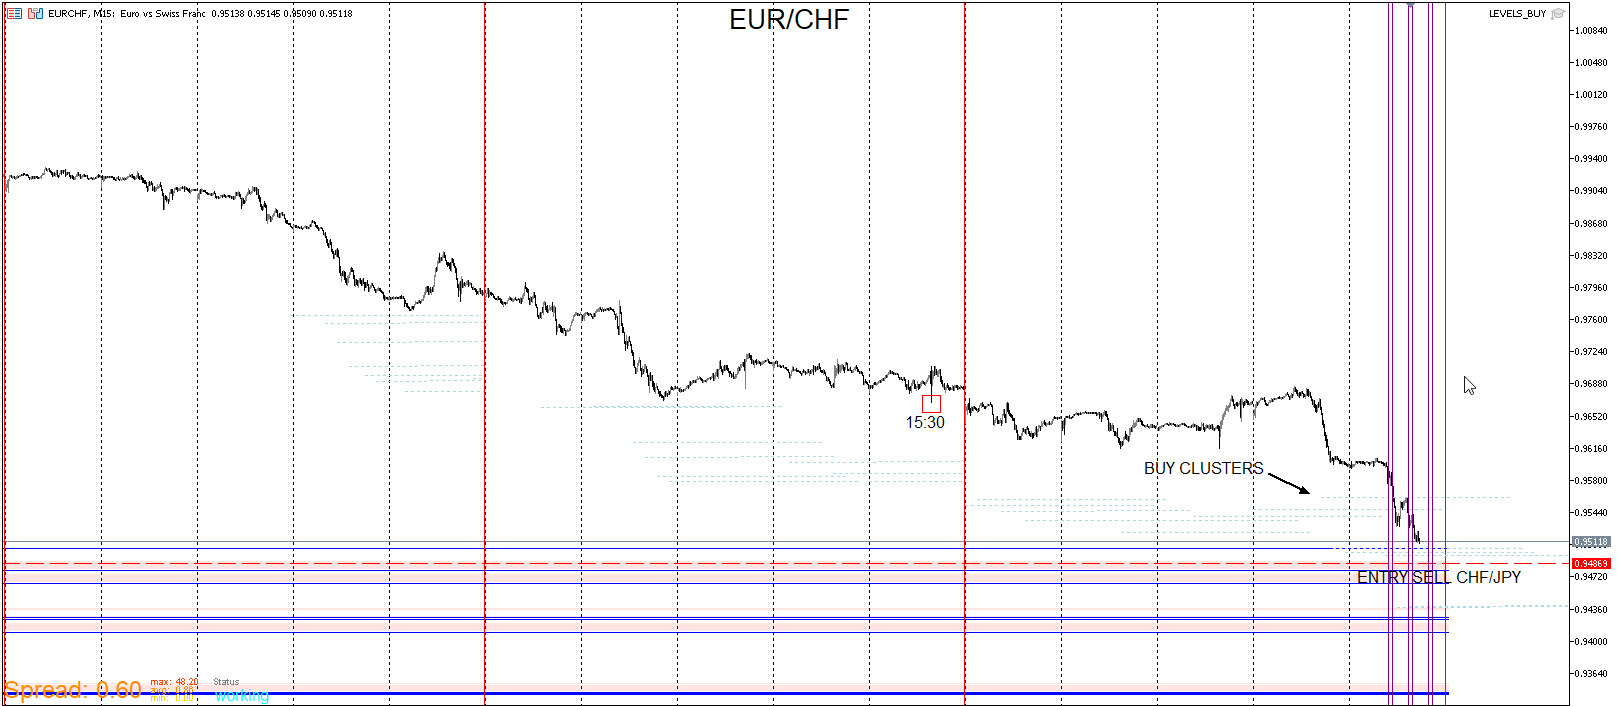
I believe that I'm spotting a potential sell for AUD/NZD using the BCC Template sell version. If price reach my defined entry level, This is where I will sell CHF/JPY and possibly the other yes pairs. Conversely I'll go long the CHF pairs which my bias for them were long anyway even though I was too early a few days ago. This is a live experimental entry based on patterns I observed while utilizing the BCC template. As far as my position size, I'm not going full volume. I'm starting with very small filler positions and adding as I get more confirmations. That way when I am wrong or too early, I'm not going into deep drawdown.
-
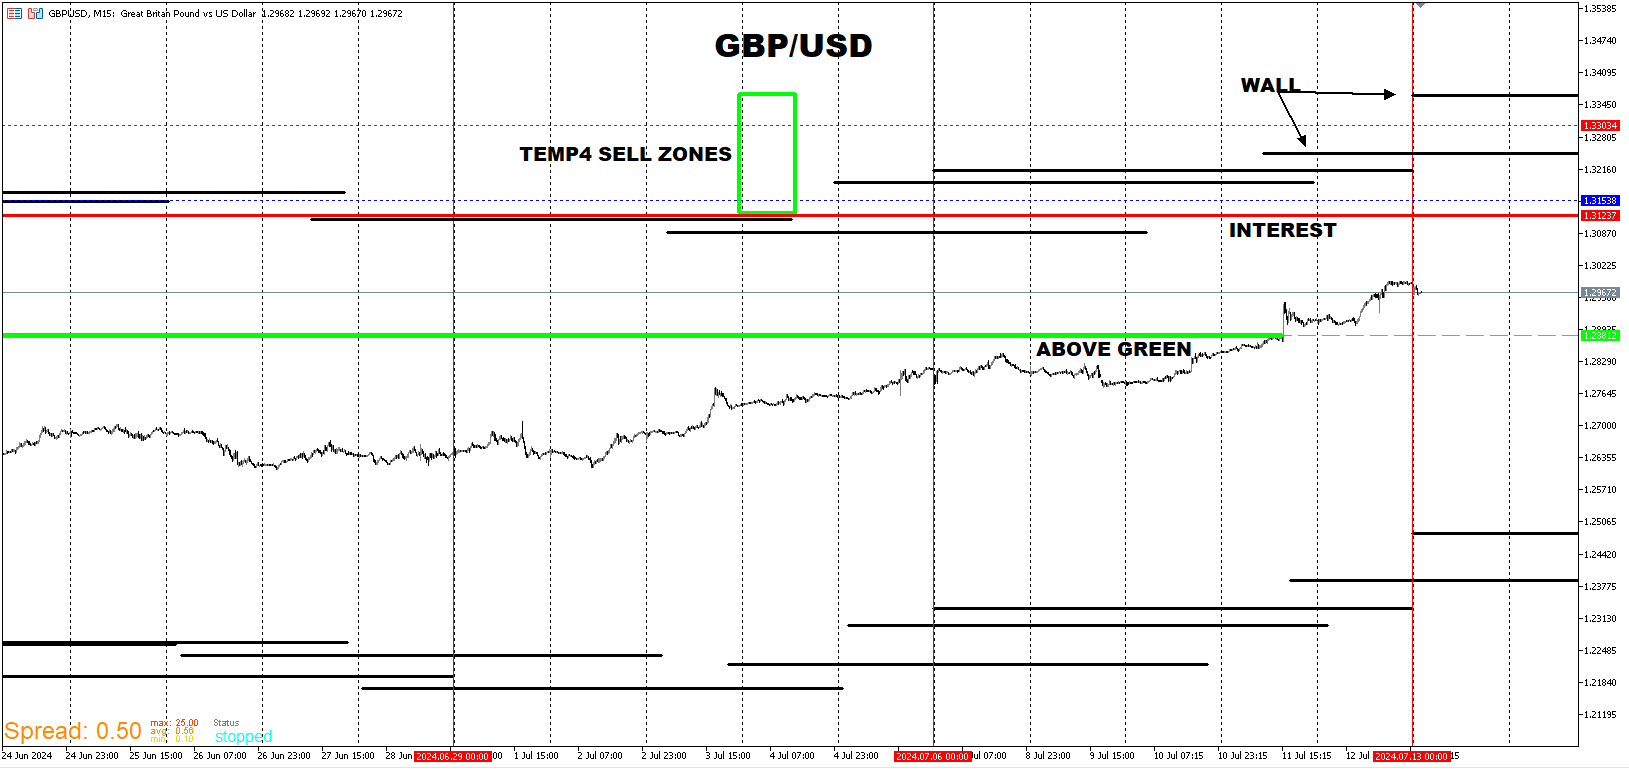
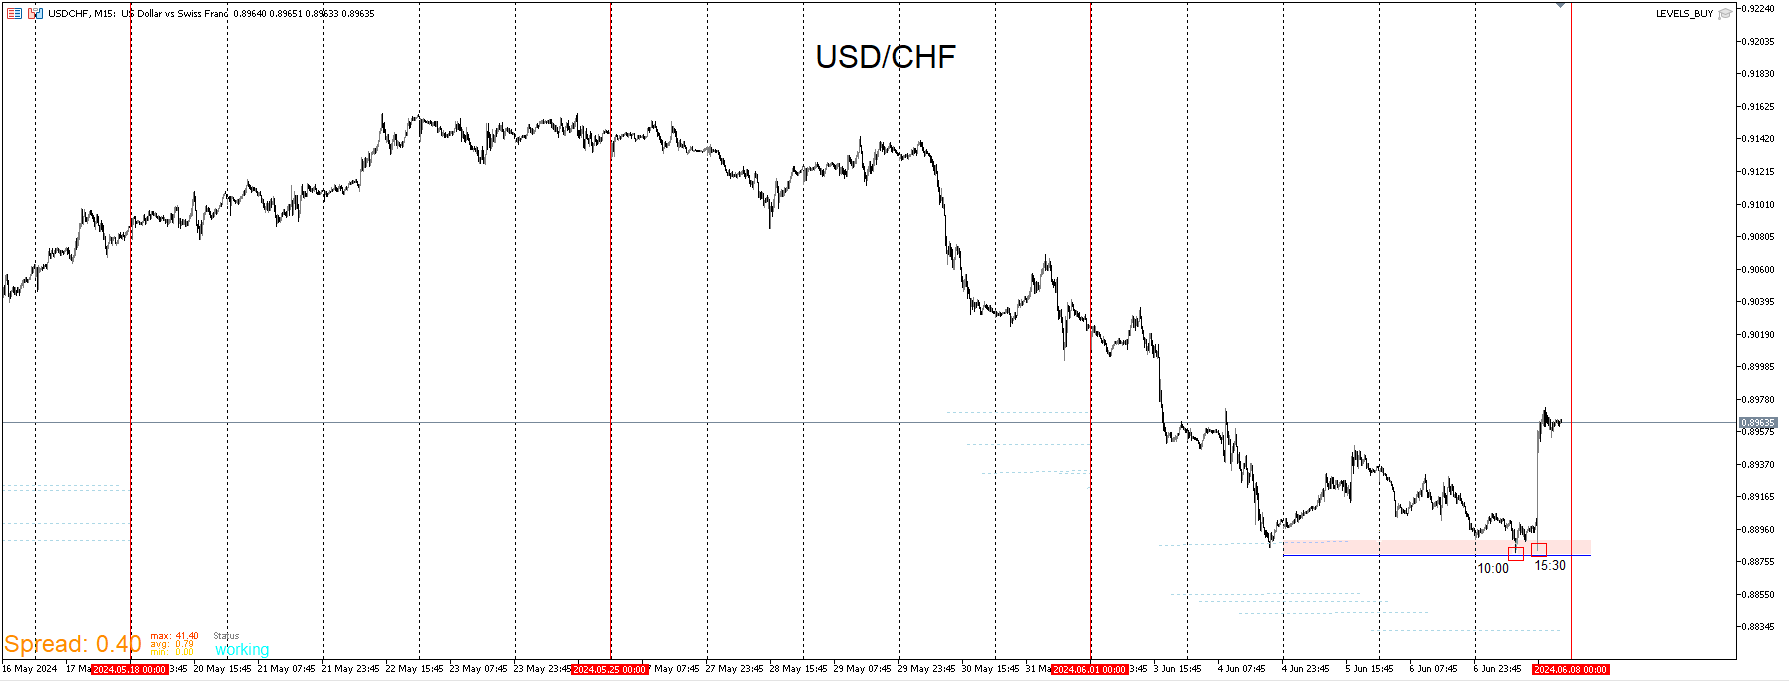
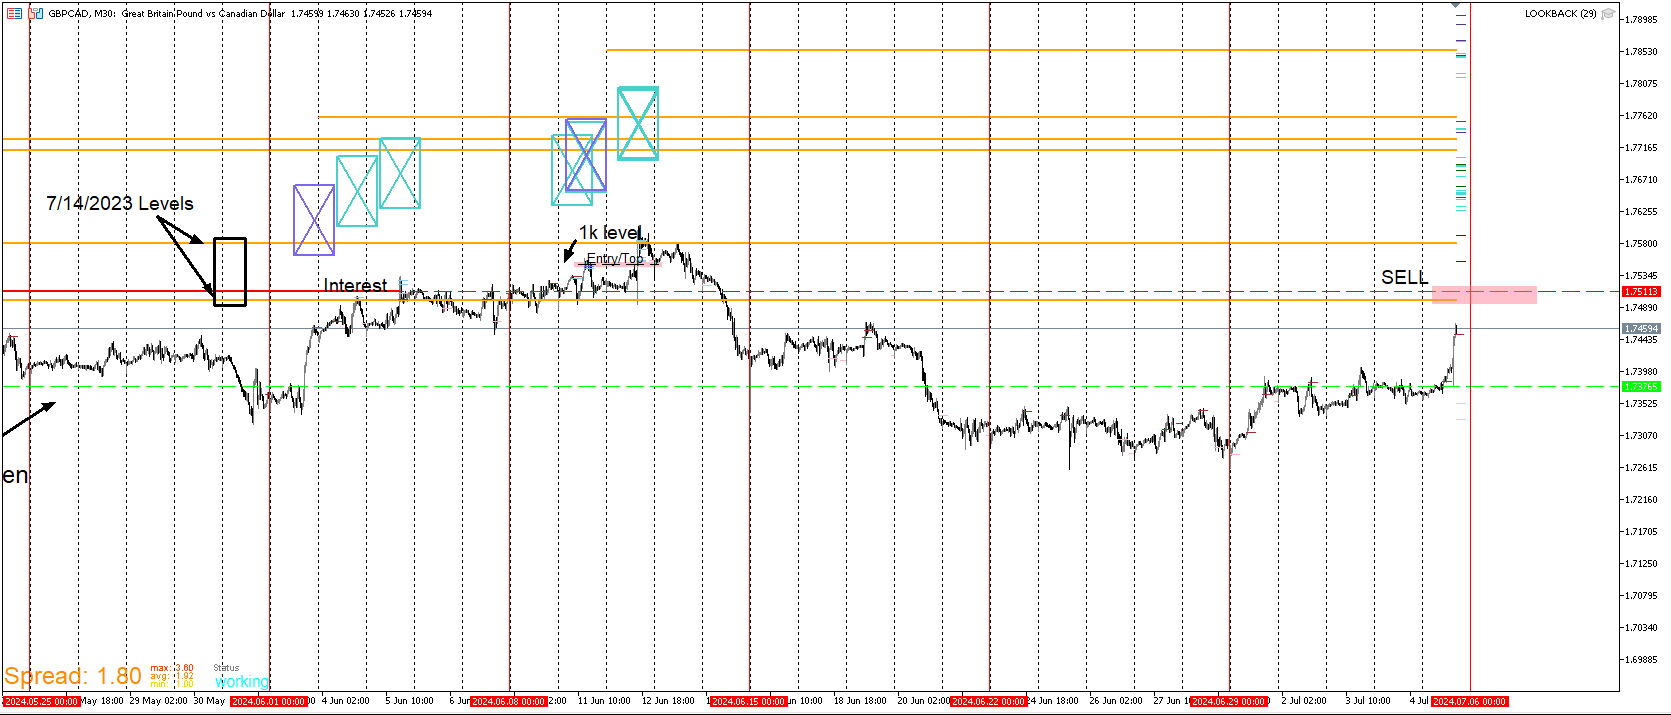
GBP/CAD UPDATE
Here's an update for GBP/CAD
Price did reach the level that I believed at the time to be the top. But soon after there was a major spike up. I noticed that this spike happened in just about every pair major and minor pair. Some were to the downside. This one just so happened to be one that went against my entry but I wasn't concerned. A general rule with a template like this is that I don't want to go long at these levels because there tends to be a solid likelihood of buyers getting crushed when late buyer excitement merges with what I believe to be sellers desperate to close their positions. Every template is designed with this concept in mind. I actually added a position around the top of that spike because I just couldn't see the market rewarding buyers on that spike. What I have learned in this situation is that price movement isn't always isolated to a single pair. It was likely a fundamental thing which I don't pay attention to and even then, the drawdown wasn't bad compared to how far price reversed.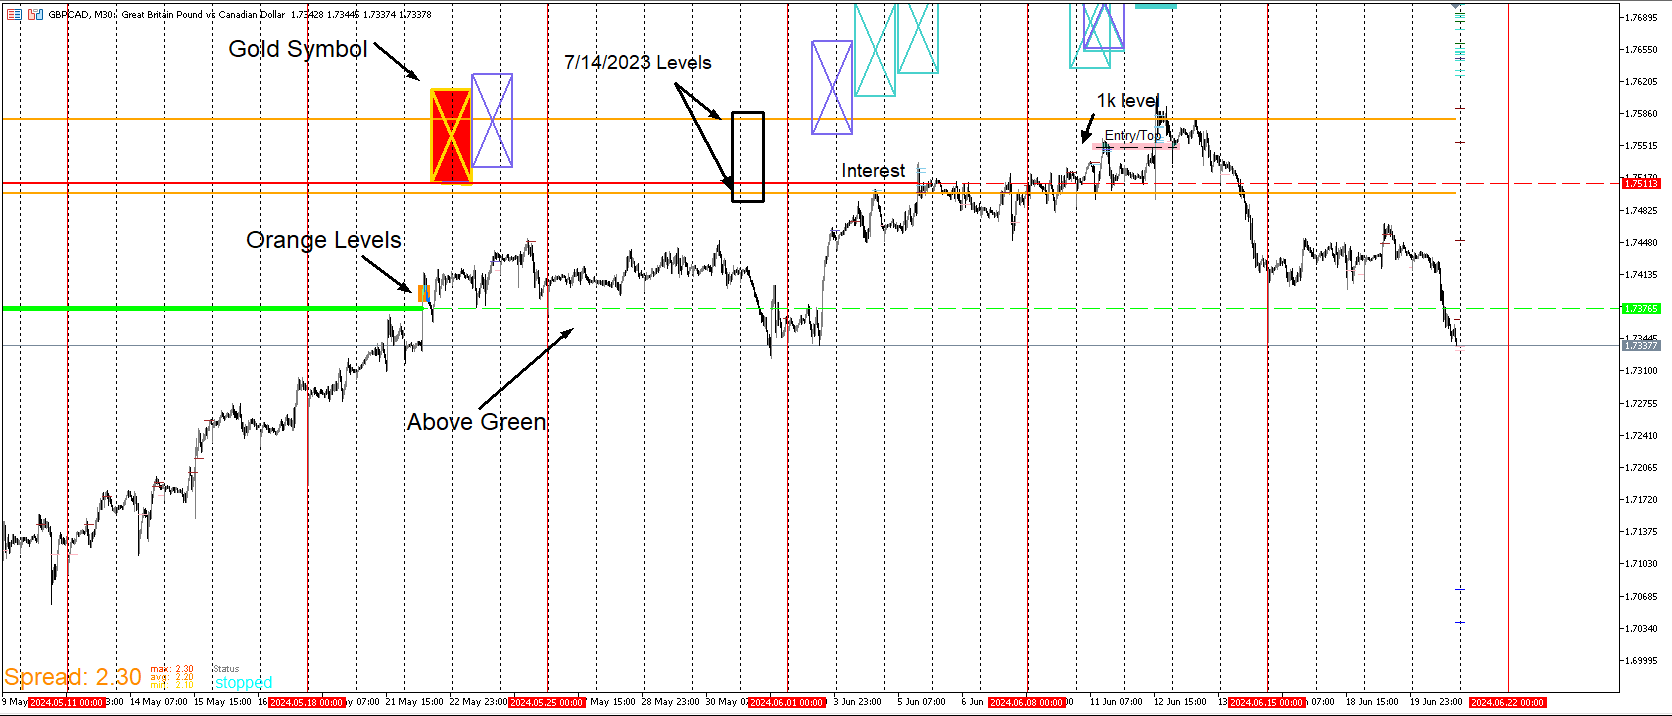
I post my entries just to show that I do actually place these trades with live money.
-
My templates are signaling a potential reversal for the Yen pairs. I don't have time to post the charts right now because I have to go to work. But I will post the levels where I'm entering at and follow up with the charts later. This applies if these levels are hit really soon. This is for documentation purposes.
USD/JPY: 162.949
EUR/JPY: 173.289
GBP/JPY: 205.331
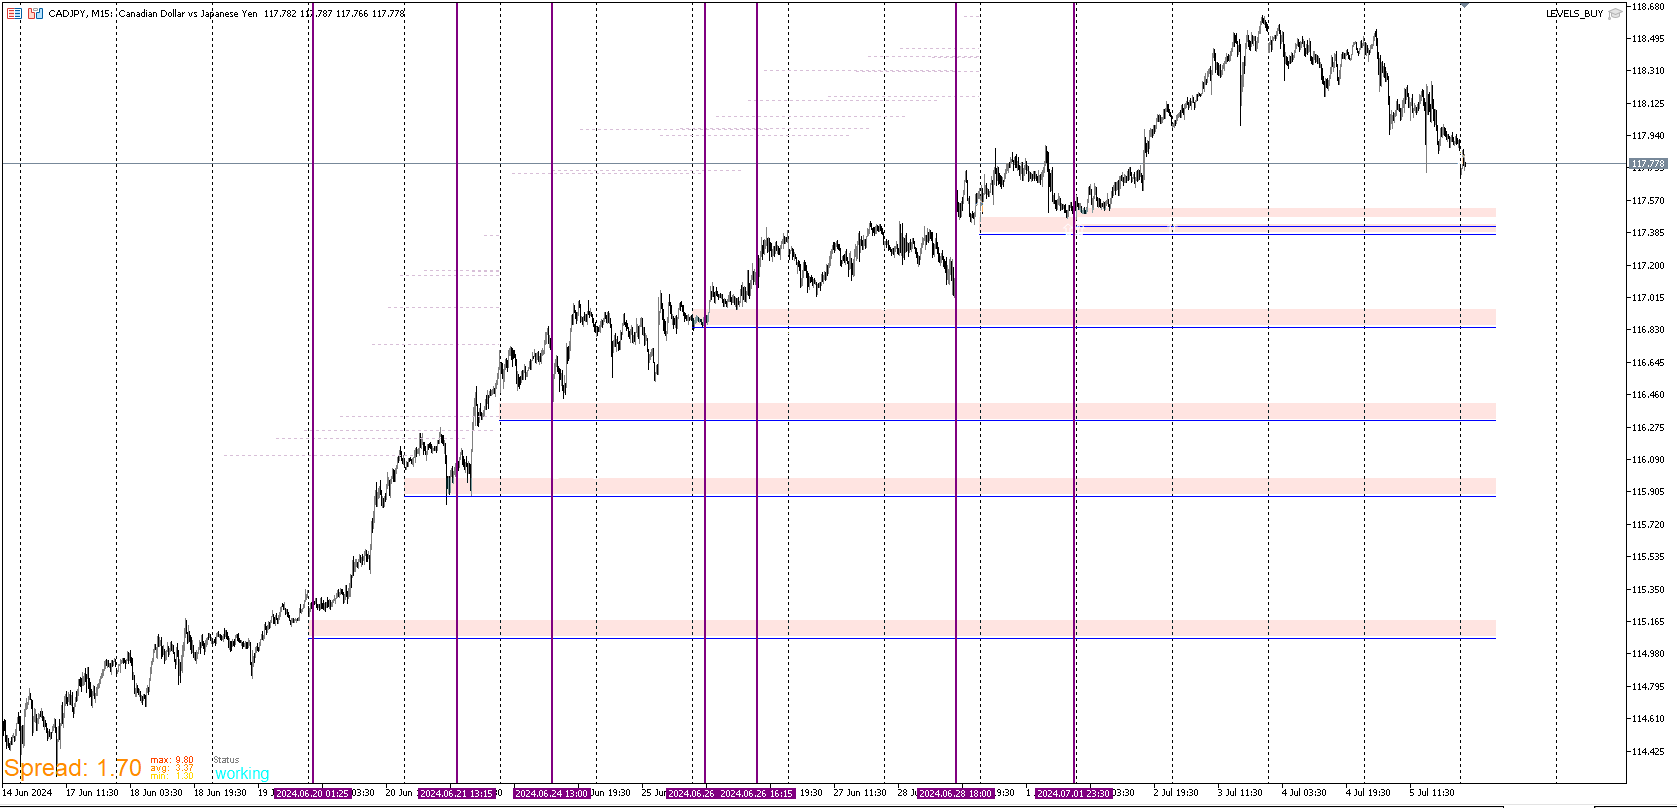
CAD/JPY: 119.370
NZD/JPY: 100.466
AUD/JPY: 107.871
CHF/JPY: 182.172 -
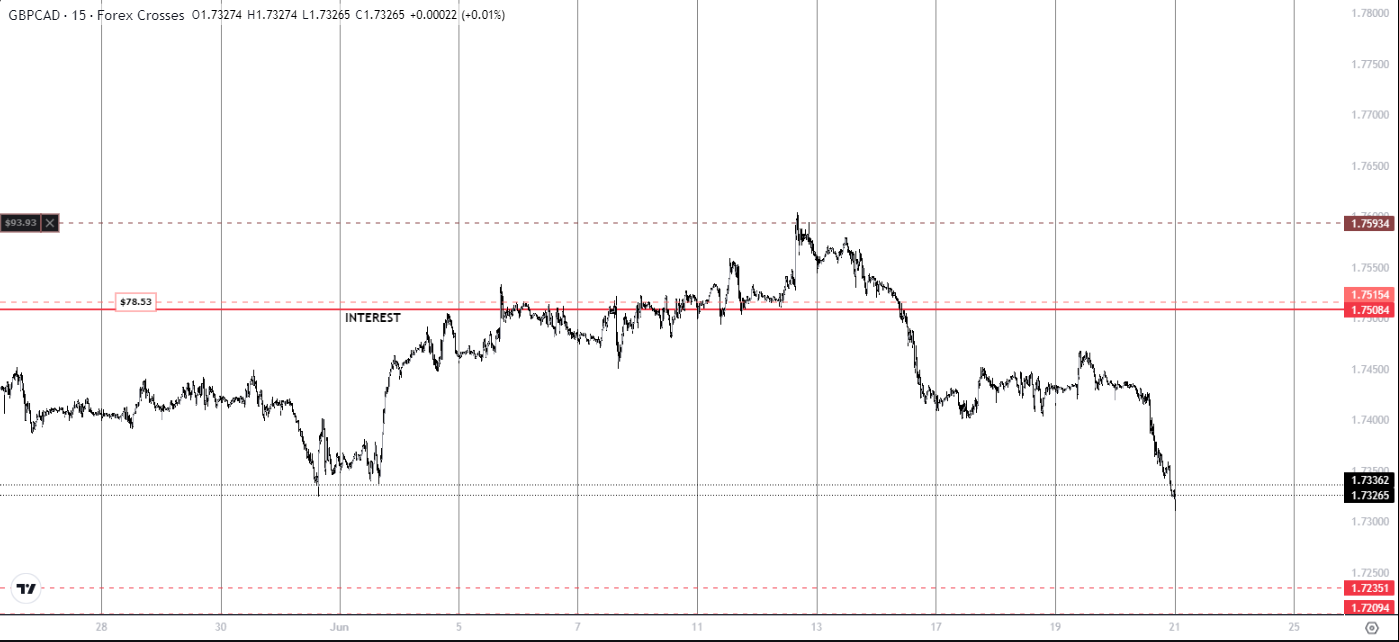
GBP/CAD UPDATE
I'll take a sell when price comes back to the interest level.
-
Here I will go more in depth on the correlation aspect of the B/C/C Template. I have observed many examples to support this and I have taken some trades specifically the CHF pairs based on this template and will post updates on them later. I believe that now is a good time to show a live example of this strategy. The basic idea of this is that when price pushes off from these zones, I need to see what a negative correlating pair does. Ideally one that is heavily negatively correlated. A rule of thumb is that the opposite pair usually does the opposite. That doesn't mean that I enter in the opposite direction on the negative pair. Sometimes it can go in the same direction before reversing. Sometimes it reverses as soon as the opposite pair trends the opposite direction. If it doesn't do the opposite at all, it at best consolidates for a while. There are rare cases when it trends in the same direction as the opposite pair. That's the information I look for. I will use CAD/JPY and AUD/CAD in this example.
I first start off by marking the push off zones with a vertical line. What this does is that it provides the exact point in time when the push originated.
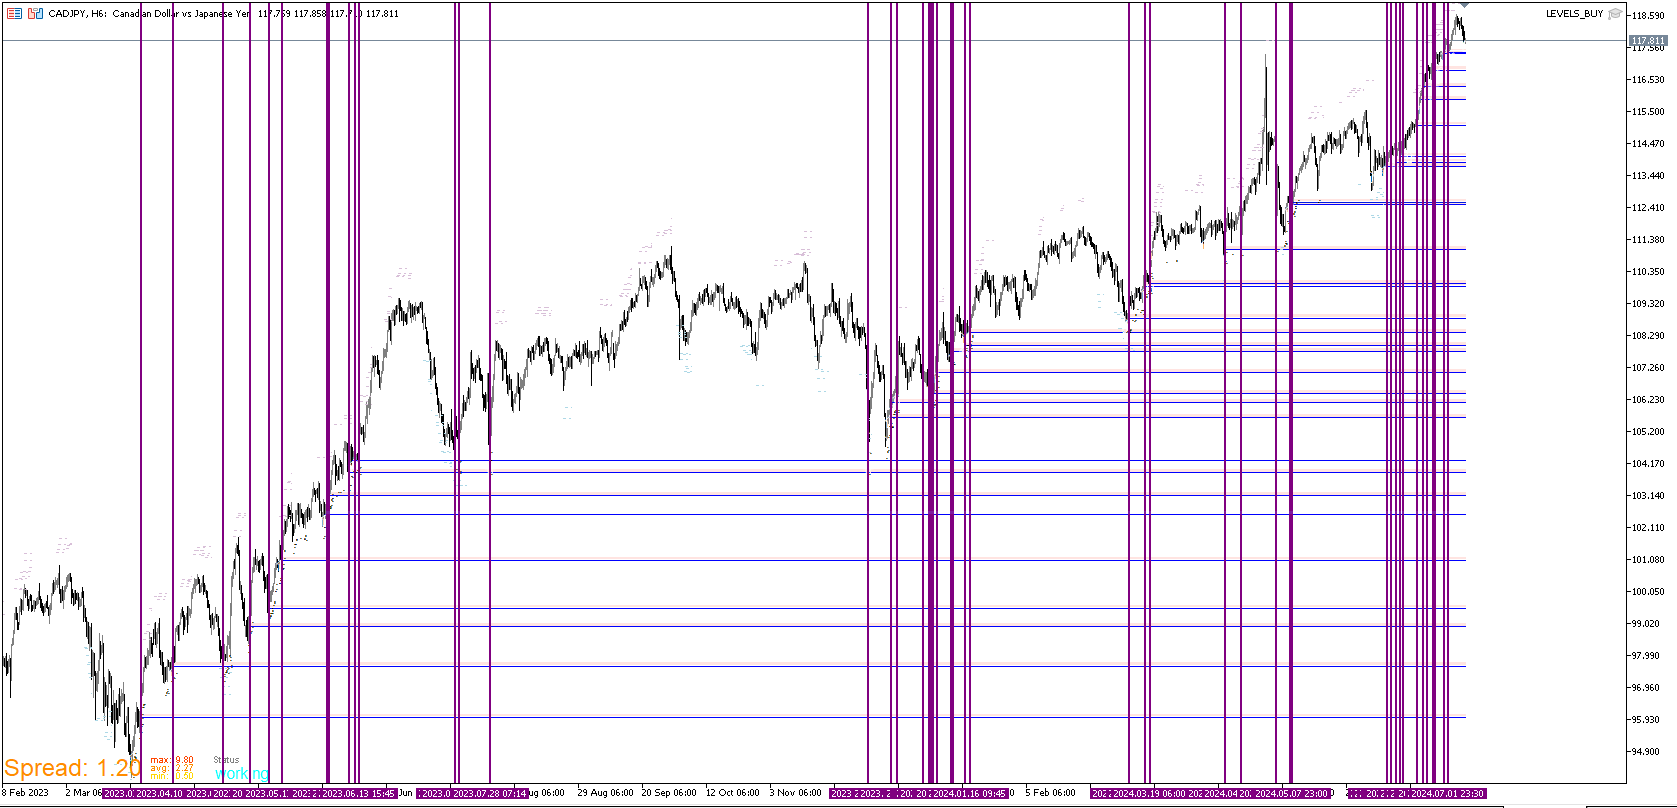
The next step is to save the template and apply it to the negative correlating pair. In this case CAD/JPY has been trending up. I will apply this template to AUD/CAD. Since the vertical lines represent time, I can see what AUD/CAD did the moment CAD/JPY pushed off. I highlight that time as accurately as possible with a rectangle.
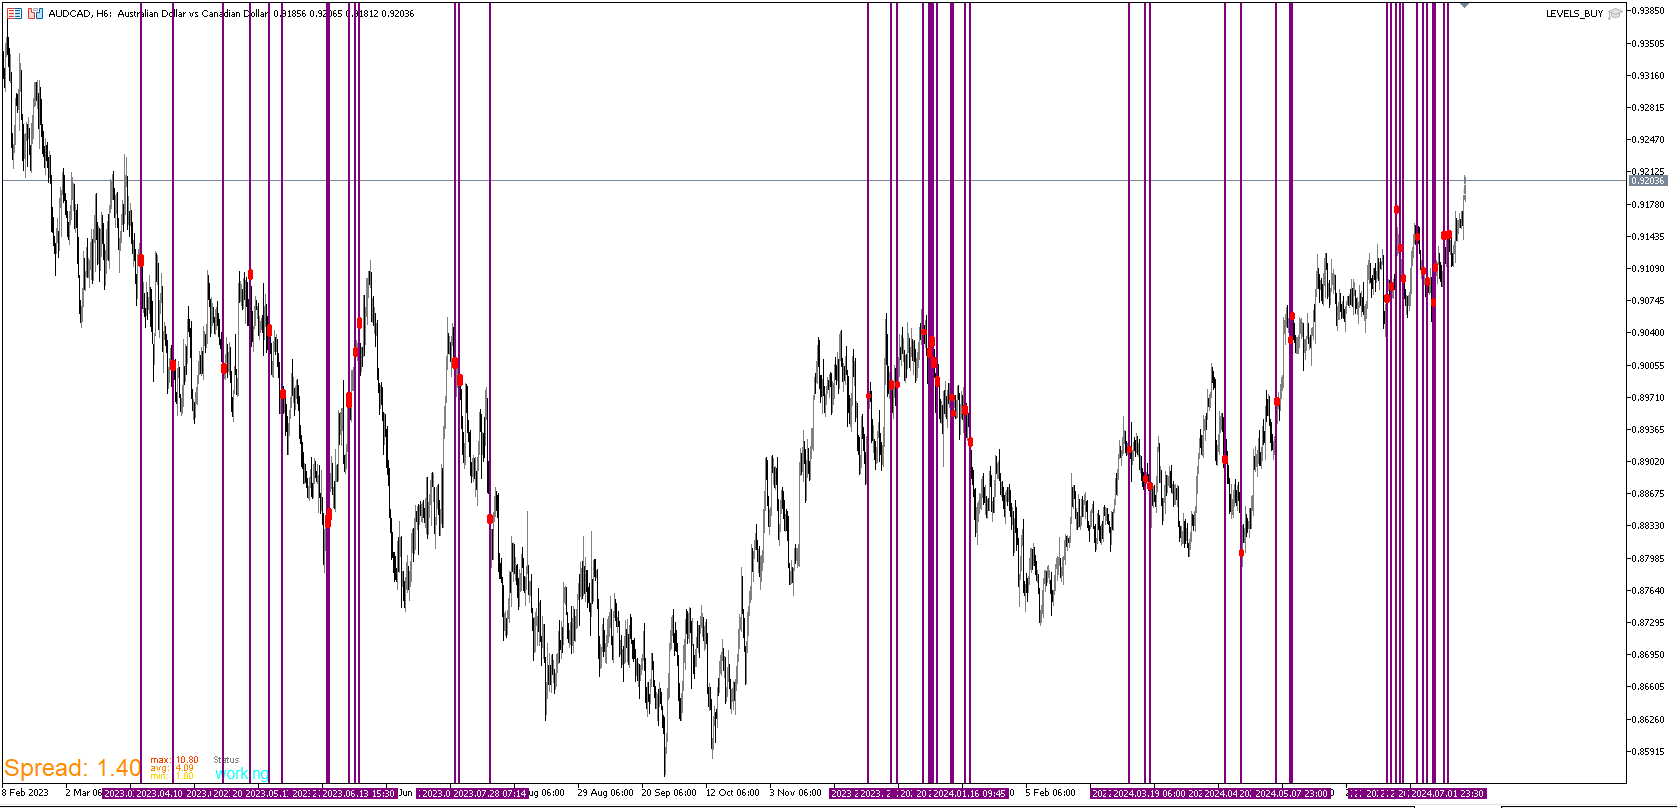
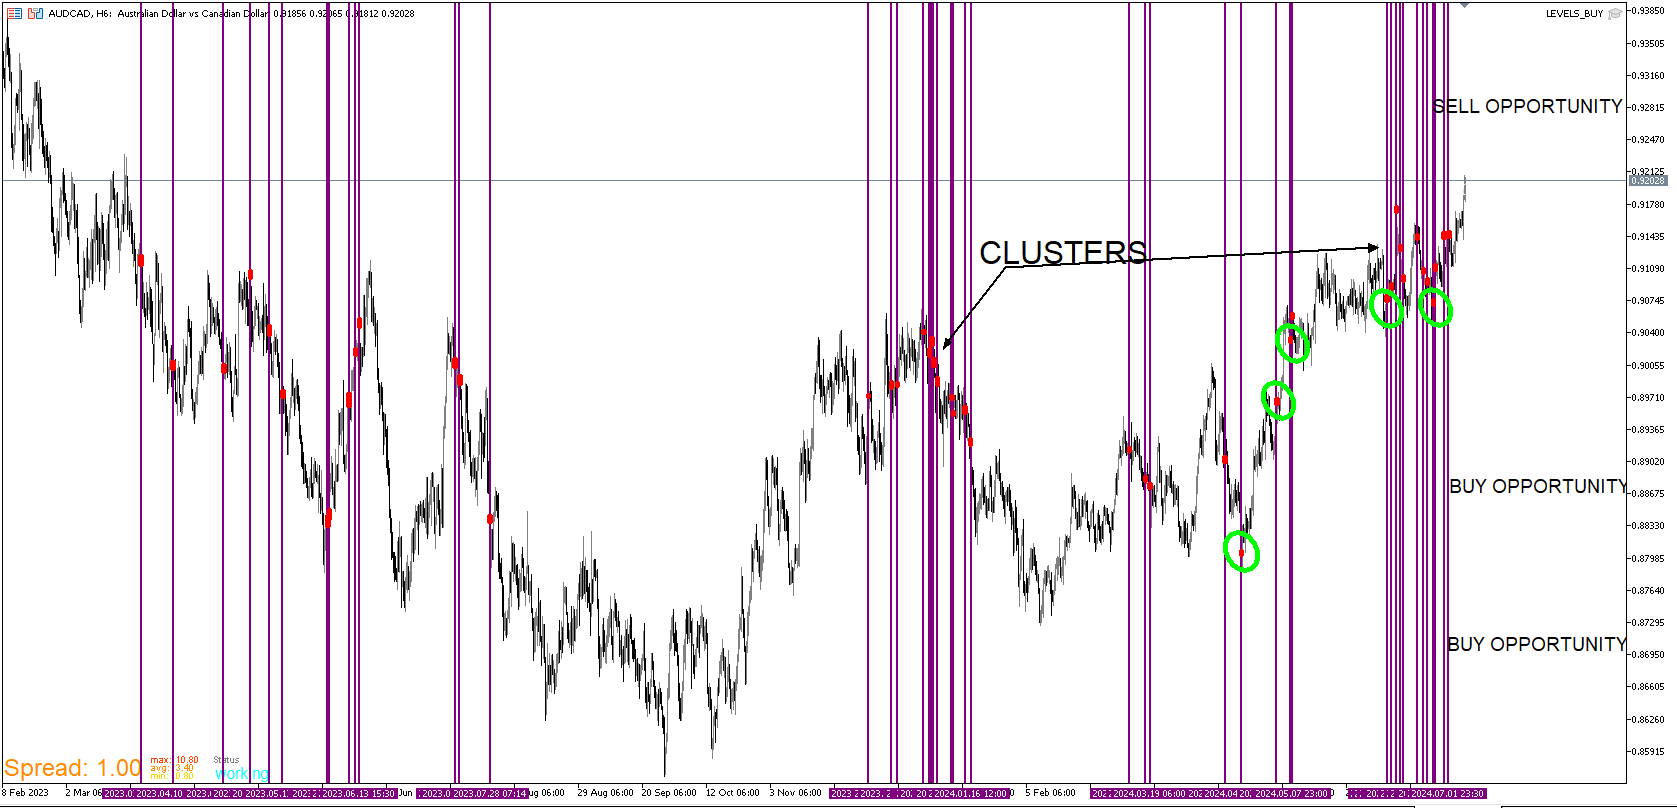
On the negative pair, I look for where price moved in correlation with the opposite. In this case, There are points when AUD/CAD pushed up at or around the same time as CAD/JPY. Those points are circled in green. Instead of buying as price continues up, I don't deem this upward movement as sustainable. Below those points are much better opportunities and I mean below as a couple hundred to few hundred pips. If price goes 50 to 100 pips below, that's not good enough. I believe that AUD/CAD does intend to go up but before it does, I need to see price come down below the green circled levels. Also where ever there are clusters, it's a very low likelihood that price will continue to push up. In this case I am short AUD/CAD but only if I'm getting other signals that prove to hold up over time. I'm not entering blindly.
-
Wow, que trabajo tan impresionante
-
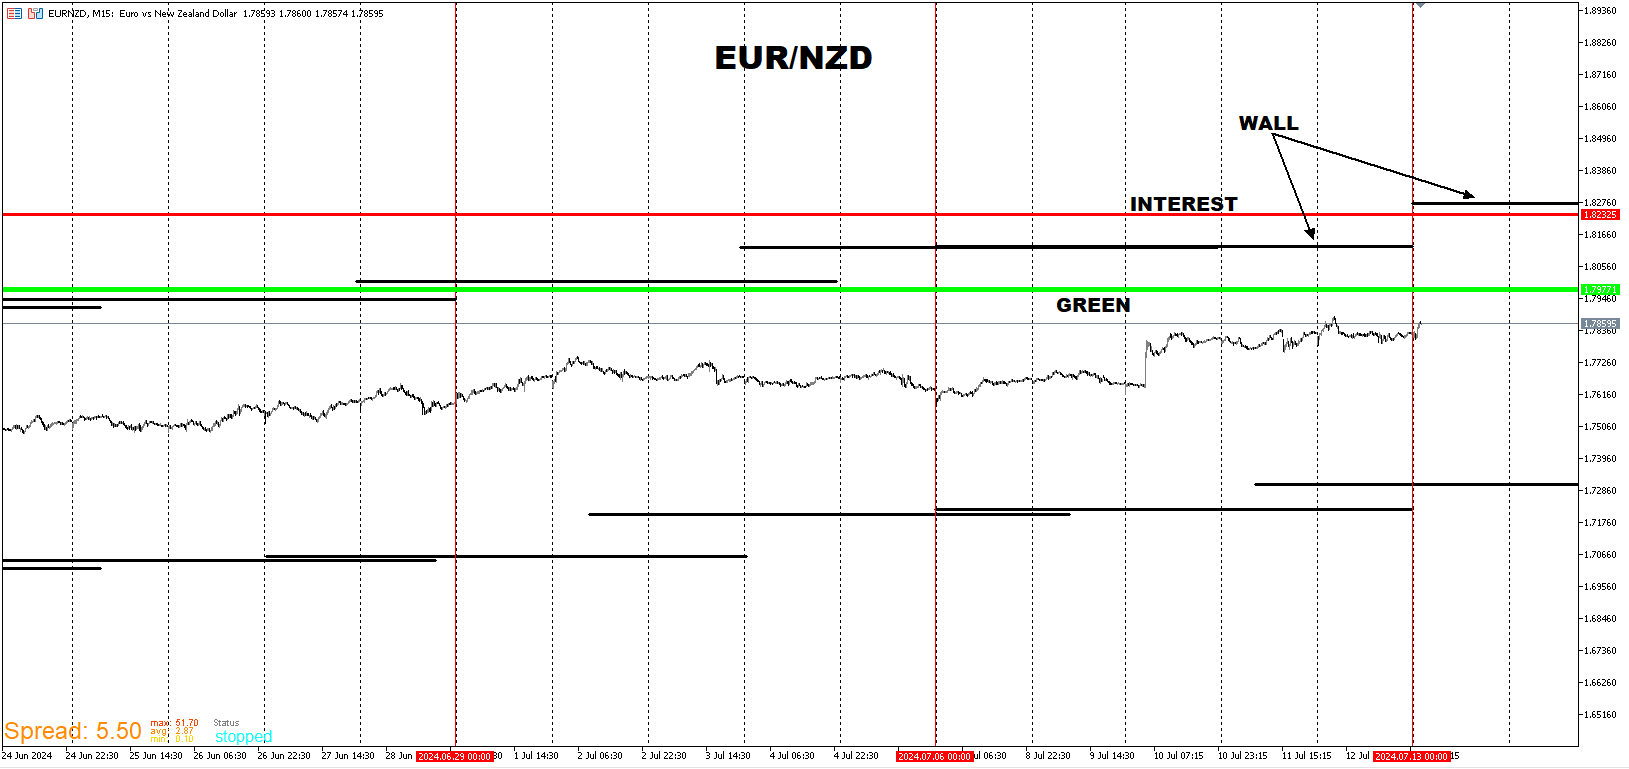
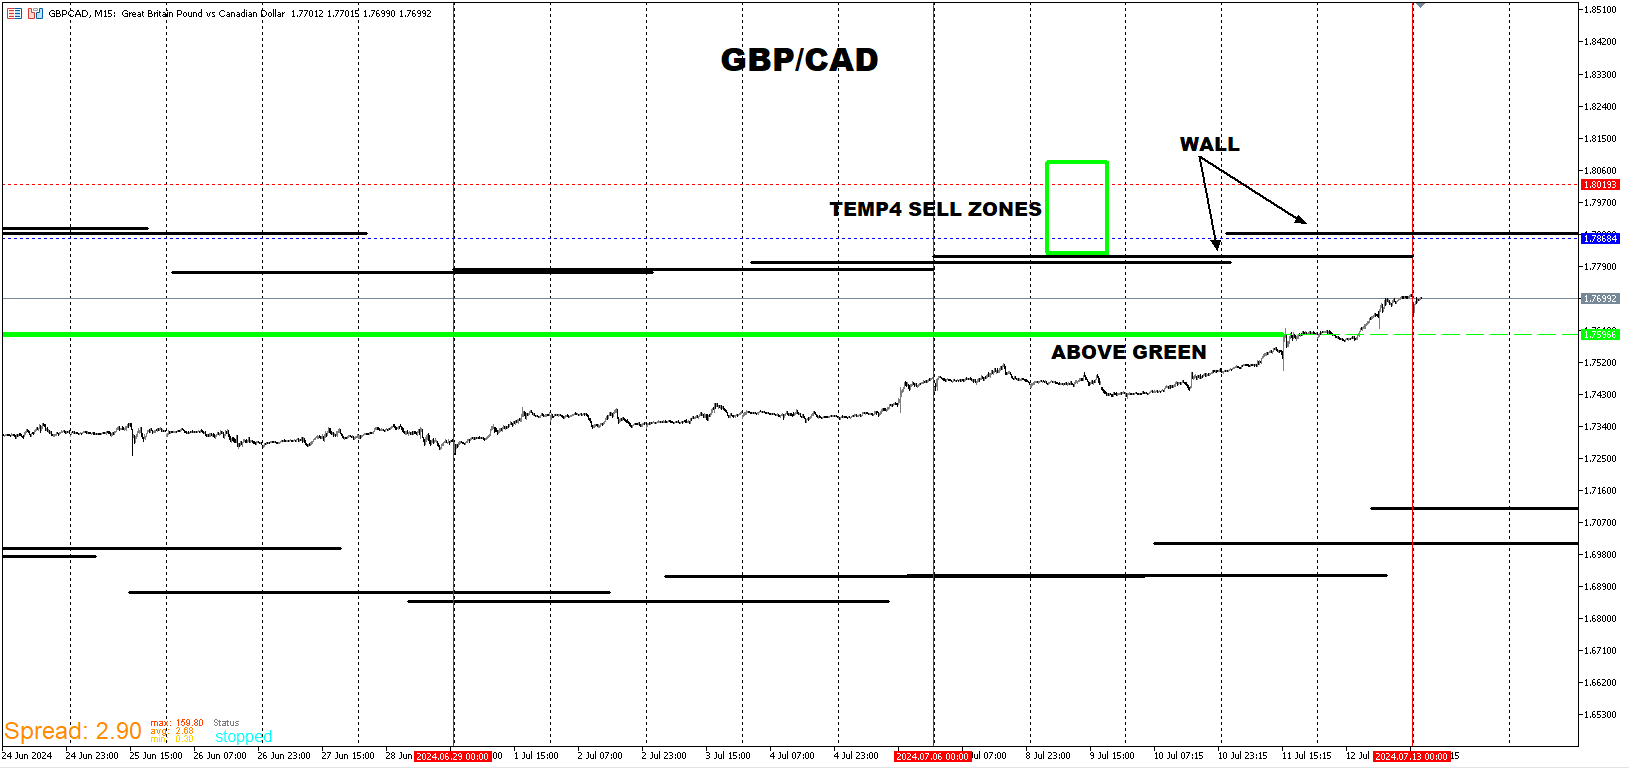
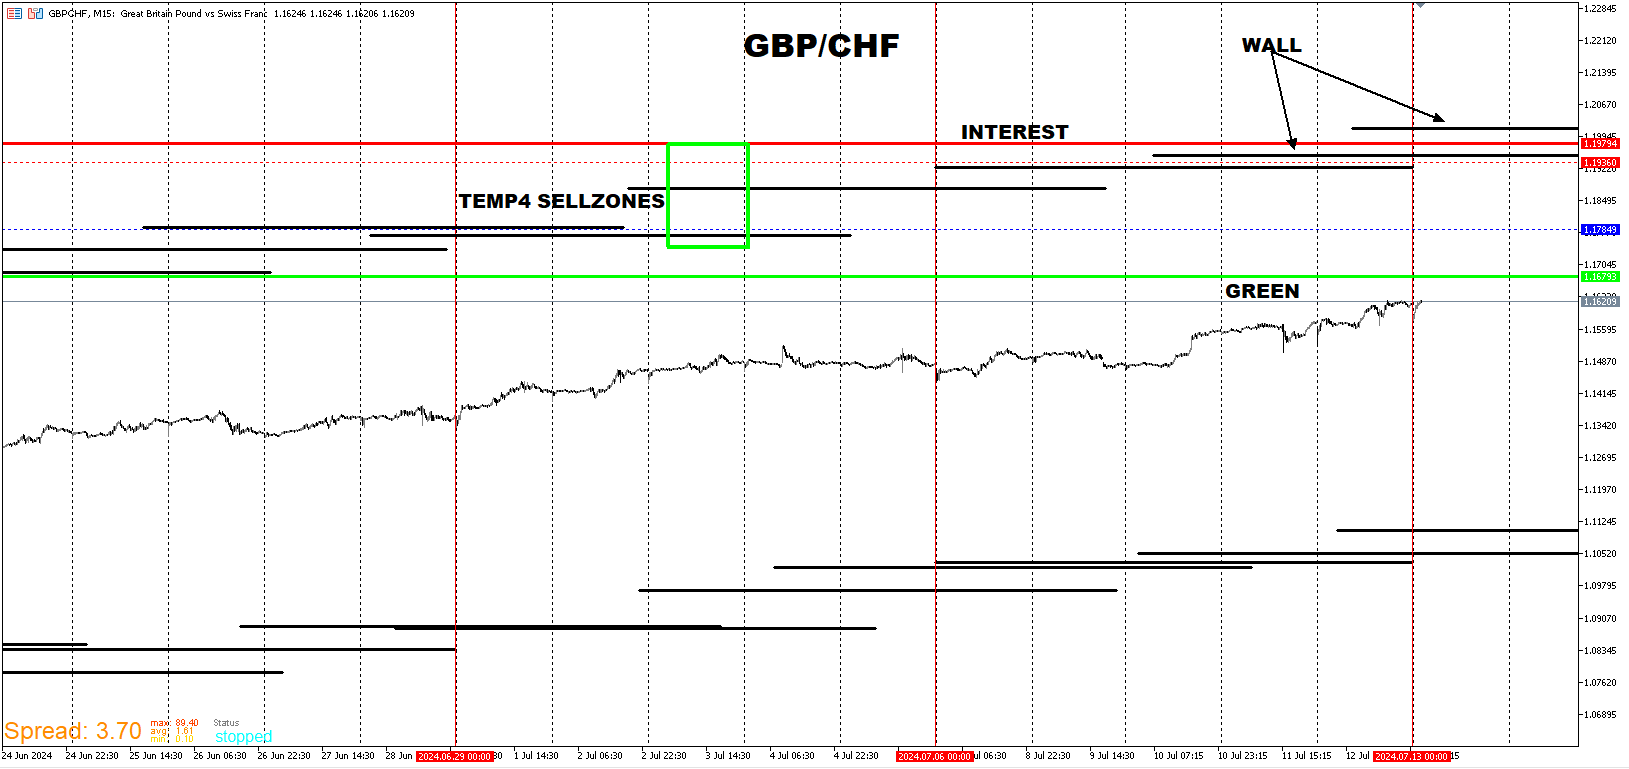
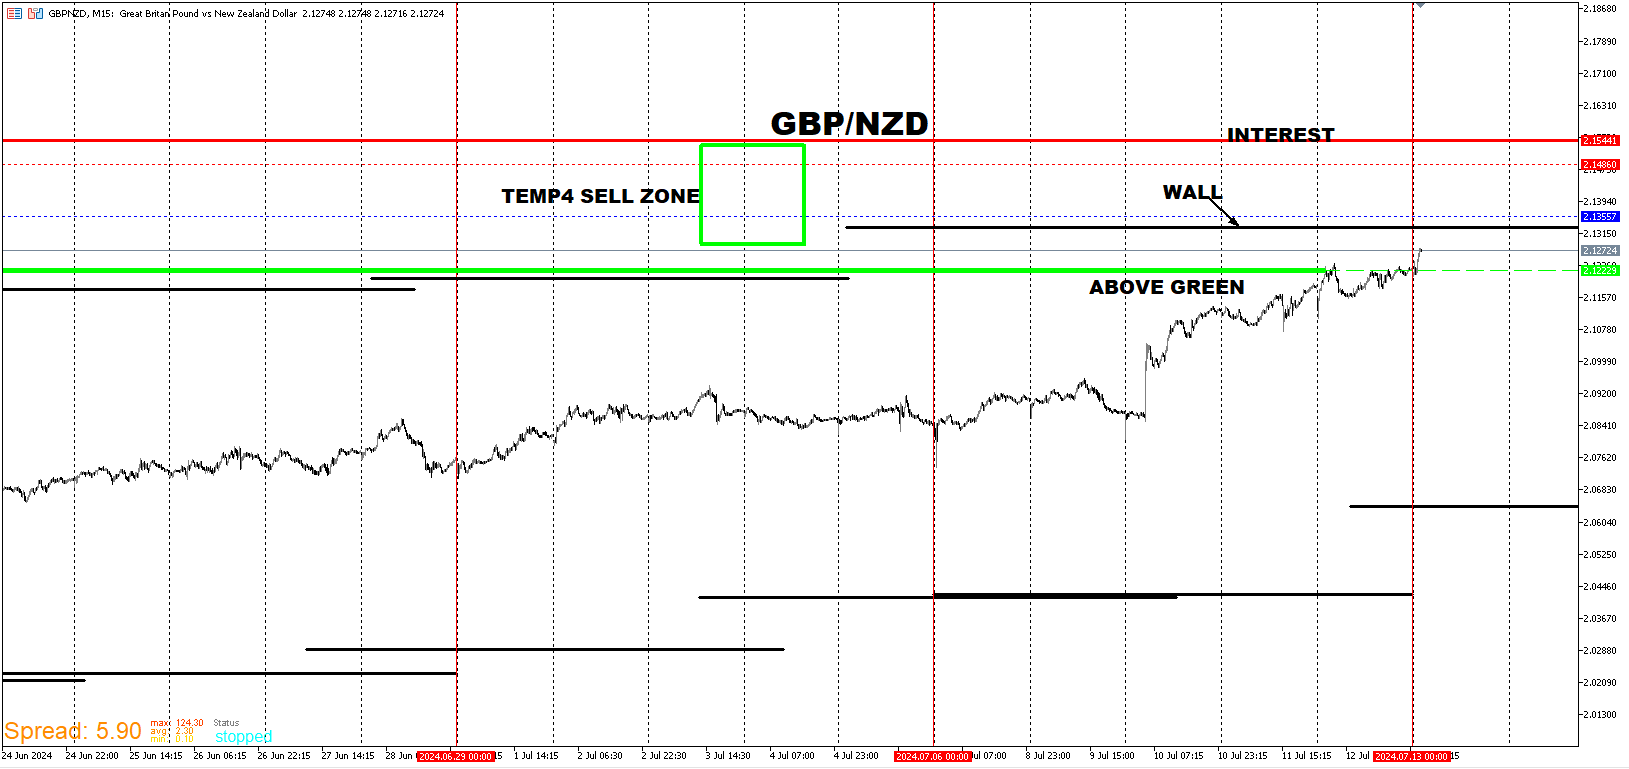
Here are the pairs I'm watching for to form tops. They are all nearing the wall template and a flush up especially pretty soon will offer a high likelihood for reversals. I was short on GBP/CAD for the past two weeks but I'm fine with it pushing up to a more probable area.