@l-andorrà I agree. That's what I had to do. The program is very good for fleshing out ideas and seeing if it's viable. It cuts out a lot of back and forth between communicating stuff to the developer. When you are satisfied with it but need it optimized, it gives the programmer a good frame of reference to build from.
J
JayPhillbrooks
@JayPhillbrooks
Swing/Positional trader with emphasis on building systems and tools for optimal entries.
Best posts made by JayPhillbrooks
-
RE: Backtesting is getting slower and slowerposted in Questions & Answers
-
RE: help for pivot 10 candle indicator fxdreamaposted in Tutorials by Users
@fdfx Unfortunately I'm not of use to assist with this. I'm not savvy when it comes to actual coding also this is an indicator which can't be created using this platform. It does remind me of projects I've done and solved but they were EA's. I'm not sure why it works on live market but not in backtester. You may have to try duplicating a new terminal and try it on the fresh one. Sometimes the tester be weird on one but works on another. Normally when something works live but is funky on the testers, usually the code is good. I could be wrong but hopefully someone with more knowledge can help.
-
RE: My EA updateposted in General Discussions
@Alex81 Correct. About 7 EA's. I covered the important ones. It's complex in terms of development. I just sought for the simplest strategy. Holding and milking the move. While other traders are focused on all the other stuff that they believe causes the market to move, I'm as close to the bottom or top and in profit no matter which direction price moves while they are taking on risk. My objective is to eliminate as much risk as possible. These templates helped me achieve that. Every position I'm in right now is as close to the bottom as possible. That's where I want to be. Yes this was all done in FXDreema. As frustrating as it was to make everything work, it's definitely possible to use it in more creative ways than just trying to build a strategy with a perfect equity curve in all market conditions which is impossible for me to do.

-
RE: My EA updateposted in General Discussions
Here is an example. It is a bit of an oversimplification. This usually plays out on a large timeframe but there's only so much room on the chart to draw it.

I will share a video of the EA in the next post to show how the line comes to be.
-
RE: Please Help Me Create My EA With Specific Simple Strategyposted in Questions & Answers
@l-andorrà Yeah it's definitely the best tool out of all the ones I tried and I'm glad that picked it up after trying out the other stuff. It's way more flexible and a ton more options and ways to skin a cat. I also have a 3D animation background and it's really similar to 3D programs that are node based. But yeah it was tough to grasp at first but that's how most software is that are actually pretty good.
-
RE: My EA updateposted in General Discussions
That's it for today. I'm not saying that price will hit those levels soon or if it will at all. I'm just prepared in case it does. If it does, it could be quick or a slow grind for a few days. Every bottom isn't an aggressive spike. It could be a slow roll over as well but I have an Idea of what to look for if that's the case. If it doesn't get there and pushes up instead for a great distance, It's totally fine. F.Y.I. I'm not posting these as signals that I think people should take. This is strictly to show how I blend EA's that I worked really hard on and how I use them to aid me when pulling the trigger. I still put a ton of time in on the charts outside of my EA's. I also still get nervous because I'm using real money and even though results have been good so far, I will be wrong at times. I look for these setups and they take weeks/months to manifest. So I have to get ready and explain my thought process even though price may never get where my attention is focused.
-
RE: ANY ONE TO MAKE THIS STRATERGY AUTOMATEDposted in General Discussions
You have the No Trade bloc connected. It's not taking any more trades because you are telling the bot to only execute if there are no positions. That's my guess. And for future references, if you have an issue with something, there is no need to oversell a strategy as being powerful or claiming there to be some secret. We can tell by looking at it that it won't be profitable because we all personally have EA's like this that we tried to build when we first started. That 20 bucks will be drained real quick when applied to the wrong market structure. When the margin becomes too low, the broker won't even allow the trade. We are happy to help but you are less likely to get help if you don't keep it specific to the problem.
-
RE: My EA updateposted in General Discussions
EUR/USD
This one is a good ways below the green. I've never seen price breach completely below into the white. If there is more downside, I would assume it to be very little.
It's not as deep into the red as I'd like but it is pretty deep below the green and been down there below a good amount of time. A slow grind near the previous two ribbons is also a good sign.


For the high tracer, I'd like to see it go down further and think it likely will. As of now, it's a little high for my liking.


Latest posts made by JayPhillbrooks
-
RE: Stuck on Process - What's next after FXDreema?posted in General Discussions
Since you asked a handful of questions, I will attempt to reply to them all so that I don't veer off subject.
just wondering how you incorporate FXDreema into your trading journey if you don't already have a profitable system?
:For me I spent months learning FXDreema and about 2 years in totality building out final EA's. Since my system is purely signals, The EA's display templates that lets me know optimal times to enter. I then paid a coding company to code it into a couple indicators. Thanks to FXDreema, the process was smooth with minor hicups because everything was already mapped out from the EAs. So FXDreema was basically a concepting tool and the money spent to pay them was made back plus some.
I'm learning to use FXDreema and backtesting on ICMarkets. The goal is to build a portfolio of EA's across the majors & crosses, to trade prop firms and having a successful Darwin.
:I personally stay away from prop firms unless I win challenges from competitions. My trading style doesn't fit any prop firms and when I do have a successful trade running, the firm would go through regulatory issues and shut down. I'm not putting up with strict rules and random shutdowns. Which brings me to Darwinex. There are no rules and they are reputable. I will say that you definetly don't want huge drawdowns because if your goal is to attract investors, it doesn't matter matter how much you grow your account. If the drawdown number is too big, it will turn potential investors away.
But then what? IC Markets only has a handful of pairs you can backtest. Say you have a profitable EA on GBPUSD, but you don't know how it works on other pairs.
So, do you have to get Data from Tick Data Suite 2, download Dukascopy data, convert it, and import it into MT5?:I'm not a fan of the term profitable when it comes to EAs. I believe that a trader can utilize EAs in a profitable system with timing and discretion that produces wins that outsize losses. But to plug and ea into a tester for 10 plus years and expect a steady, consistent, ''profitable'' result, I don't believe that exist. If an EA makes a smooth 50k profit in 2015 because it just so happen to be buys only in a smooth uptrend, technically it was profitable that year. But the next year it lost 50k or more then it was not profitable because the market conditions weren't the same. I'm not going into the next year with hopes that it will be profitable again. And it doesn't mean that EA would be profitable on another pair in an uptrend because its pullbacks may be much deeper.
Then, you import the 28 majors and crosses and backtest the EA on each of the 28 pairs?
:I believe that when when building EAs, it's essential to get familiar with how volatile each pair is. It's perfectly fine to build a system that applies the same concept to each pair. But be mindful that pairs mover quickly or slowly compared to others.
Then how do you optimize? If you want to test a RRR, BE stop or indicator settings, do you adjust the original EA and then run it across all 28 pairs INDIVIDUALLY again?
What about walk forward testing and Monte Carlo testing? I've read that you need those to test the robustness of the EA or the portfolio of EAs... But again, is that done on all 28 pairs individually?
:This is a continuation of my previous answer. I think this requires just as much effort if not more looking at charts, corresponding events, and price action behavior. If something isn't working or is flat out getting blown up, look at what may have contributed to that. When an EA is performing poorly, it may not have anything to do with the underlying logic to it. If it's buying USD/JPY as it's dropping, no need to fold yourself up into a pretzel trying to be clever by making adjustments. Maybe you should consider that the Yen carry trade is unwinding and if you paid a little attention to BOJ and the 160.00 level then you would expect a lot of volatility. That goes for foreign conflicts, natural disasters, elections, etc. These are the things that trip up many people who don't look at the markets in totality. You don't have to be a phd economist or anything. Just look at how things correlate and how price moves with certain reactions. If US treasuries are selling off, why on earth am I short GBP/USD? If gold spiked up over the weekend and sold off due to a foreign conflict, why am I long EUR/CAD when literally every similar event going back 5 years, EUR/CAD sold off with gold. This is why I study them all and how they affect each other because by studying just one leaves out overall context that keeps me from taking bad trades which aren't backed up by probabilities.Or should I just focus on one instrument like NQ and/or GC cfd's? Less volume of work and "portfolio" development to worry about.
:Again, I think it's better to get a grasp on the overall markets and how they affect each other. But you're still free to only trade NQ.Let me know how you guys are doing this because, it seems overwhelming. It seems Like FX Dreema is a great tool to build something specific, but if you don't have something specific, what are the next steps in successful algo development?
:Everything I listed is how I go about it. I'd say get to the point of having something specific, refine it, and apply it live. Keep learning and mesh it with your style of trading. The success is being done and actually using the algos. Even more success when the wins outweigh the losses by a longshot and you're not going into deep drawdown.Where do other tools like Strategy Quant come into play? I heard they're great for strategy development but a lot of people never use it to it's full capacity because they don't understand the logic behind EA's which you learn through FX Dreema.
:I actually use it from time to time but still learning it. Much more difficult to grasp but it's one of those things I'd rather focus on if I make enough money trading so that I wouldn't have to work a 9-5. I was only able to dive into FXDreema because I got into a car wreck and was out of work for a year. Plus the price tag is a bit pricey.Full Disclosure - I love FXDreema - it's fun to learn and stumble my way through the functions. I love playing with it as literally hours fly by.
:I don't use it to create new ideas but I do test stuff out in certain market conditions that happened in the past so that if there's a similar even, I would use it.But I'm obviously stuck on process. Any help/direction from successful algo developers would be greatly appreciated.
:The best direction I can give you is to study market conditions because that's where algos are being applied. When things work out or not, see the possible reasons and signals that would let you know beforehand how the algo is likely to perform. -
RE: My EA updateposted in General Discussions
DmRO indicator has been updated and finalized.
It's available here
https://jaymart15.gumroad.com/l/skdsdf7 day free access to it with pdf and video instructions. Really short and simple and for a fair price.
-
RE: What Is The Best Way To Learn FXDreemaposted in Questions & Answers
I'm assuming you mean not executing properly as in technical errors. That would indicate that you don't have basics down. There's people on here who have guides and you may find a few tutorials on udemy and youtube that have clear explanations but they are good for basics. I don't believe there to be any material that strips down every single element with in depth explanations. It's normal to have a ton of projects that won't see the light of day. It's a lot of trial and error and you will always get stuck on something no matter how experienced you are especially when coming up with new ideas. It's best first search if someone else had the issue. If no luck then ask. In the meantime keep testing things out until someone get back at you. Most importantly break your project down. Write down the conditions and expectations. Keep it simple enough to fit on a napkin and start building. Only proceed to the next step when the previous step runs with no issues. Don't try to solve a bunch of issues at once. And when you do improve try to solve as many issues as you can when other people post questions.
-
RE: My EA updateposted in General Discussions
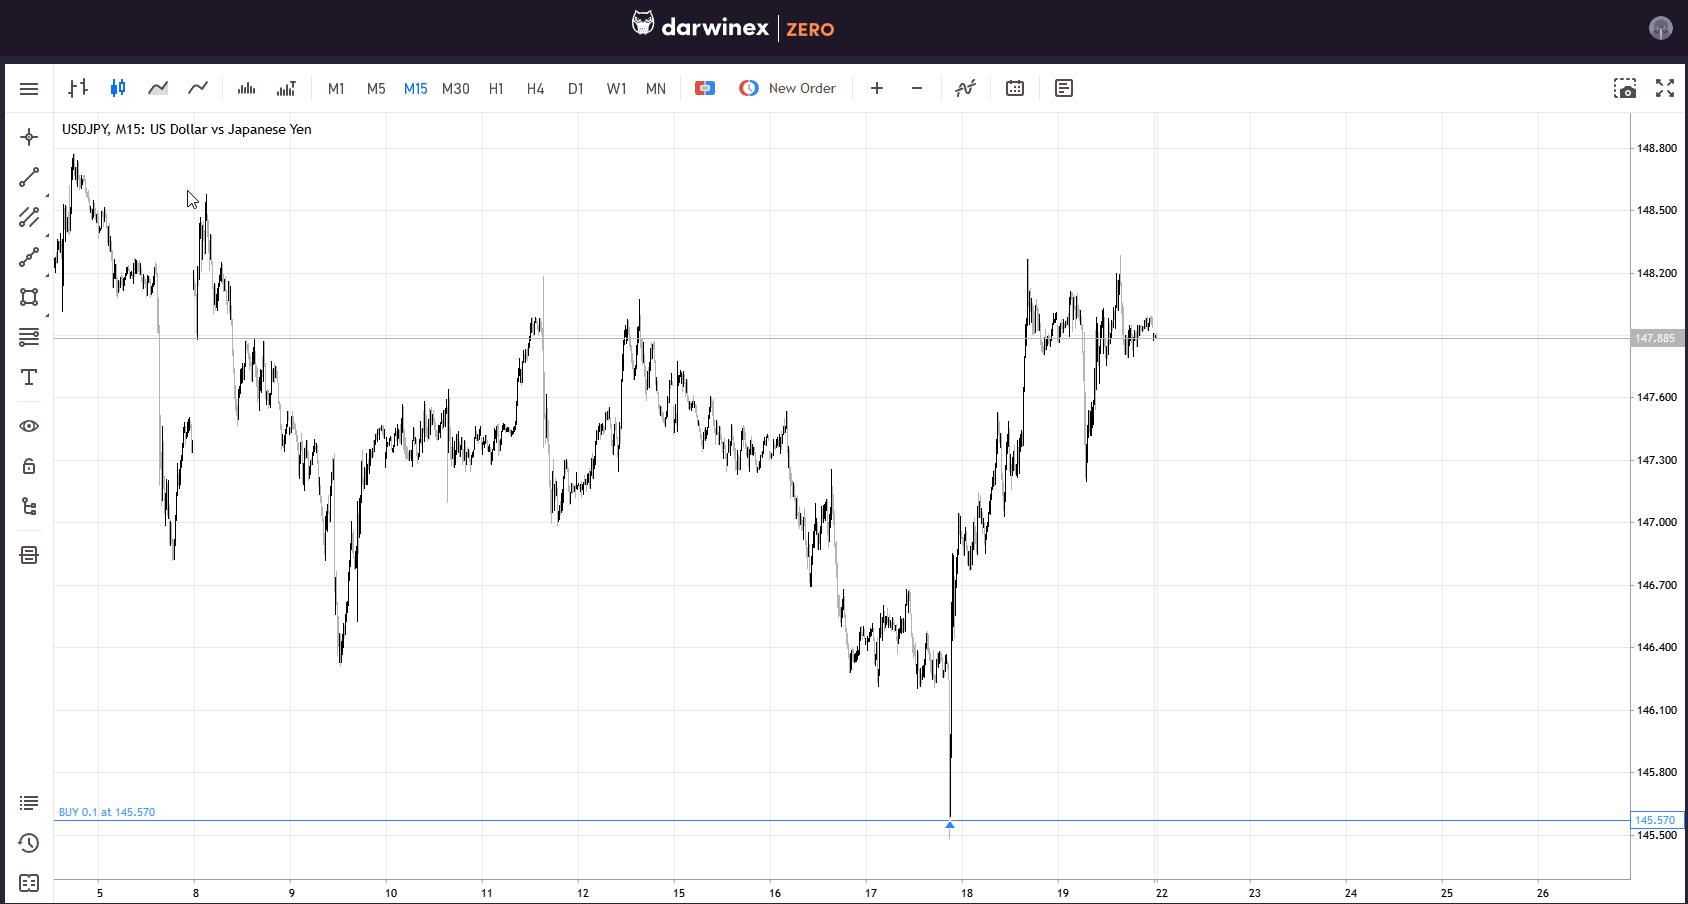
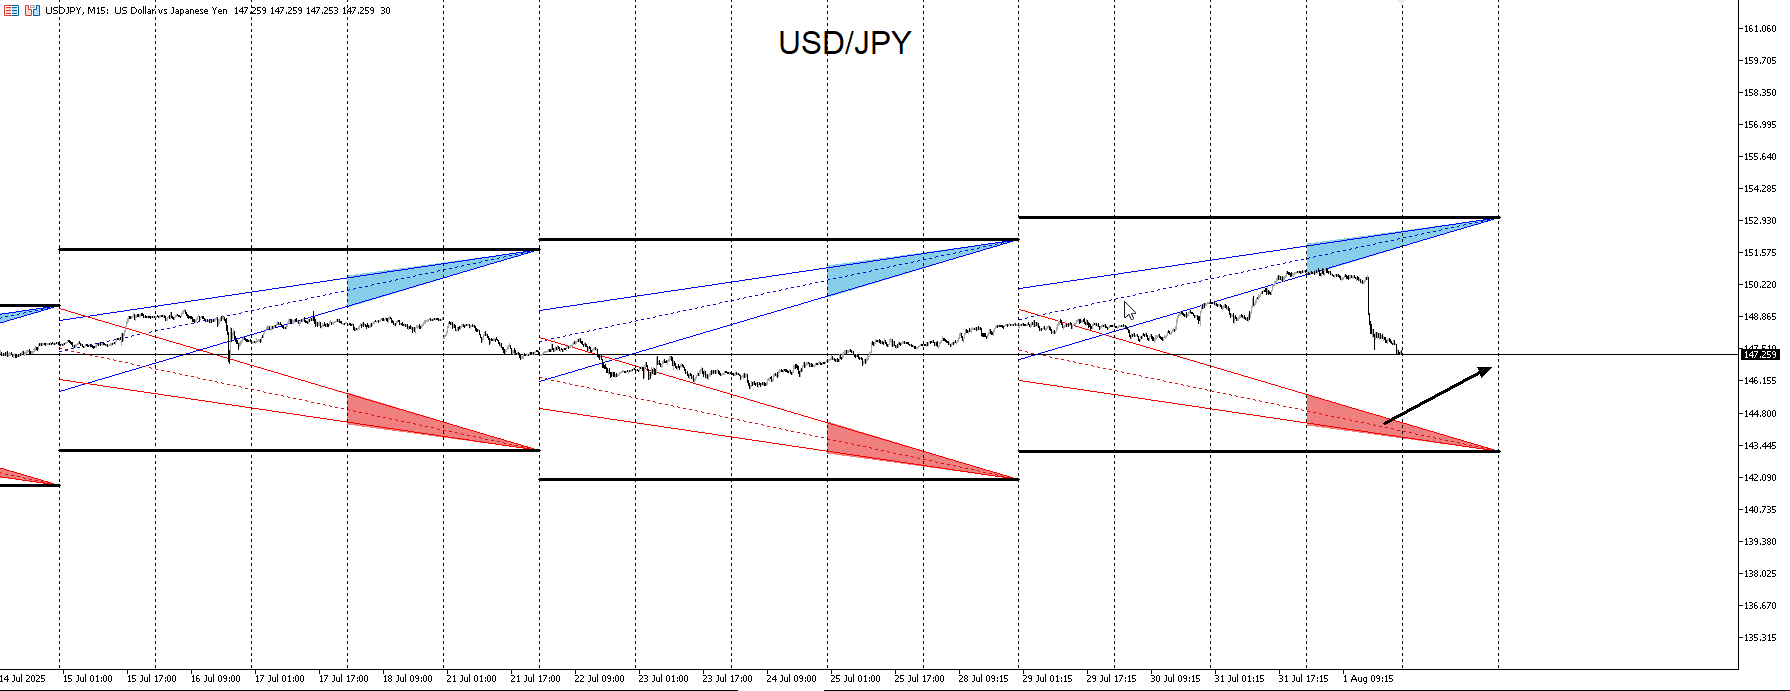
Here’s an update on previous charts starting with USD/JPY. I posted a setup that I was anticipating and didn’t get it at the time. It took around an entire 6 weeks to get the signal. Price mostly consolidated and the idea was to enter only when the yellow tracer contacts the yellow line. Since price was sideways, the levels weren’t too different. It just happened to be generated at nearly the exact ranges of the first post. This isn’t to say that I believe that price will trend up from here. It’s just an entry based on probabilities that if it were to put in a trend up, this is where I want to be positioned early.The buy limit got triggered and I will look for another entry this coming week.
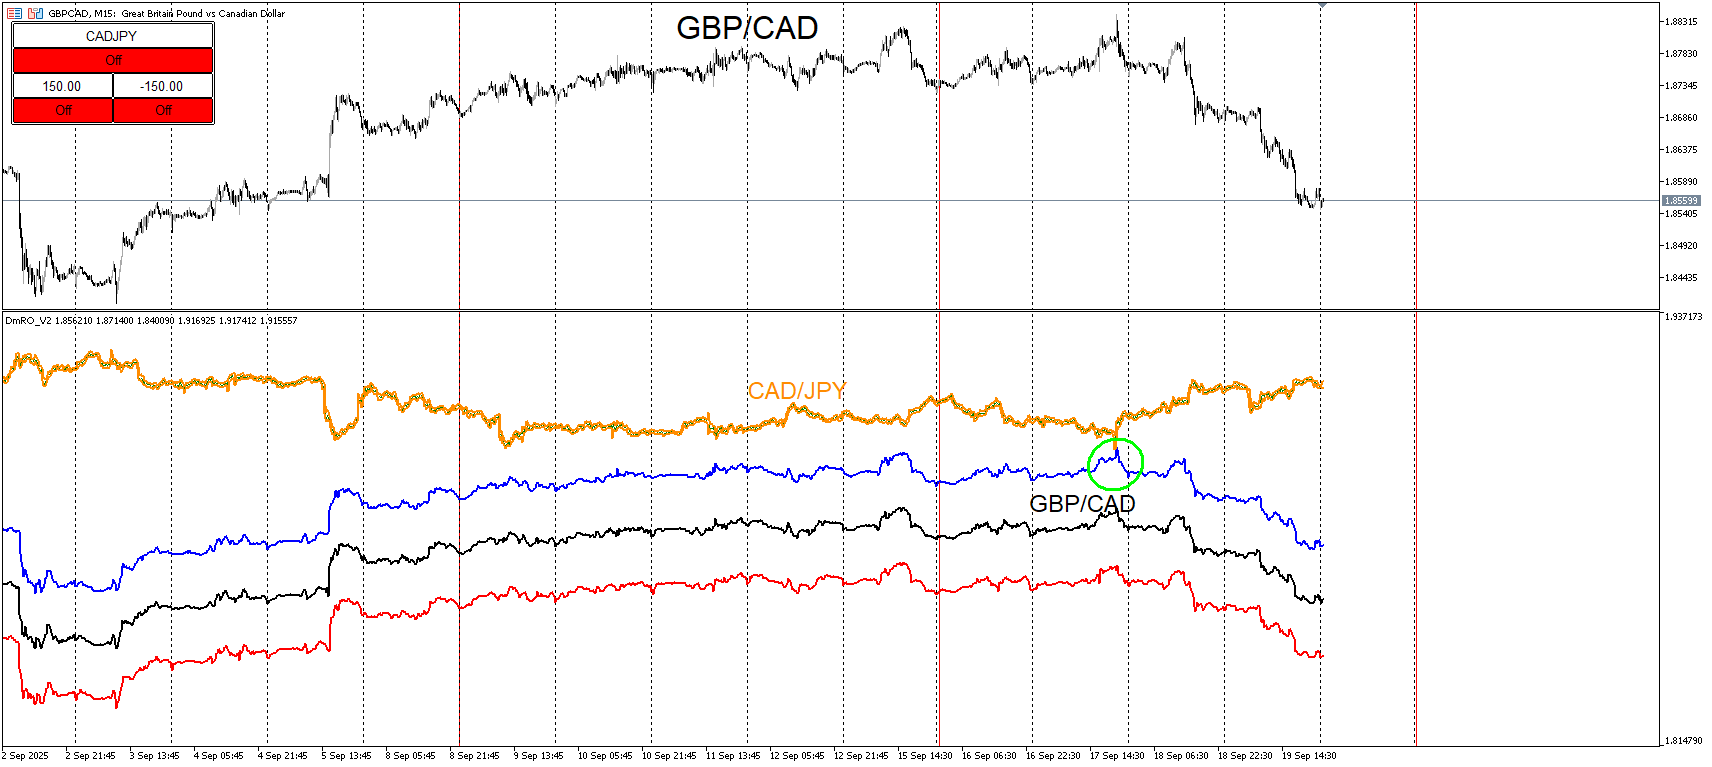
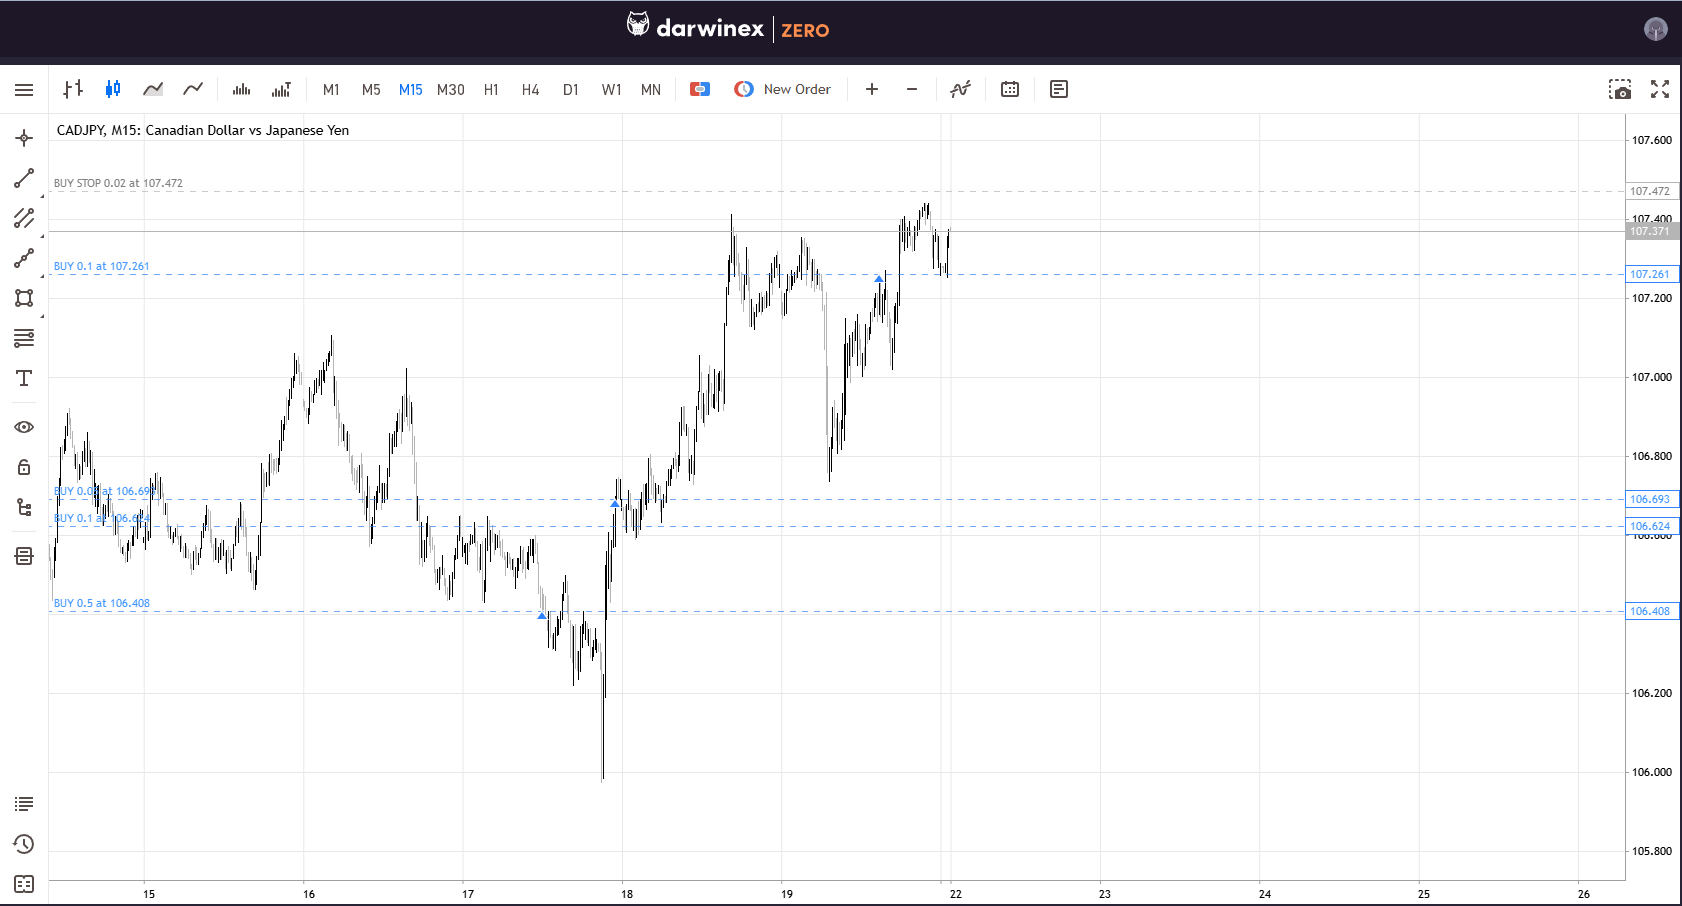
CAD/JPY is another pair I covered recently and took entries on. I did add some positions but they were taken out with some being at break evens and some with a small loss.I did re-enter and will continue to look for more entries if it continues up. I re-entered because it was still respecting the EUR/AUD and GBP/CAD interpolation tracers. It actually came into contact with GBP/CAD for the first time so I took the entry just in case they diverge and won’t return again for another while.
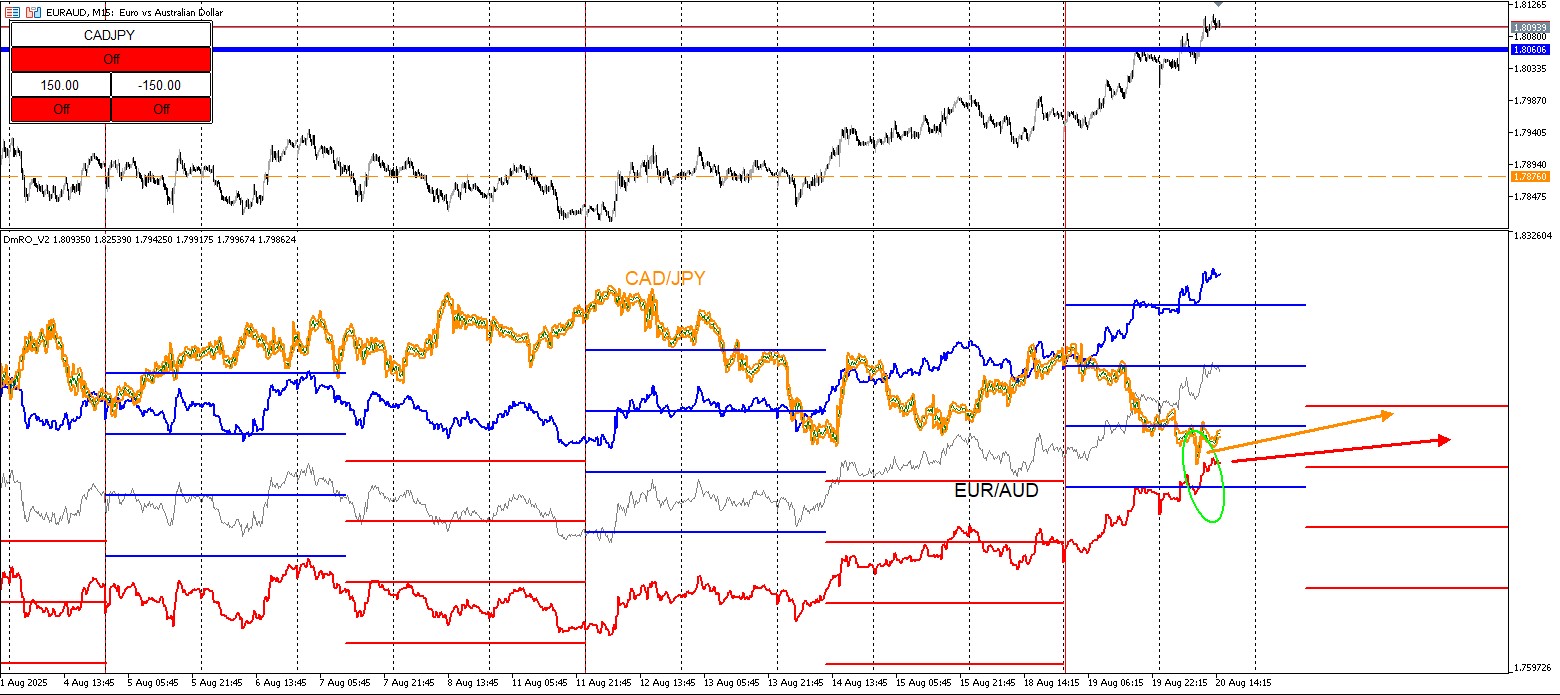
Here’s EUR/AUD with CAD/JPY overlaid on top.The last buy was when CAD/JPY was below the red. If CAD/JPY is to keep trending up, there is a very low likelihood that will dip below the red again before doing so. The black line is more likely than red but still unusual. But the bluE tracer is a much more likelihood for re-entries.

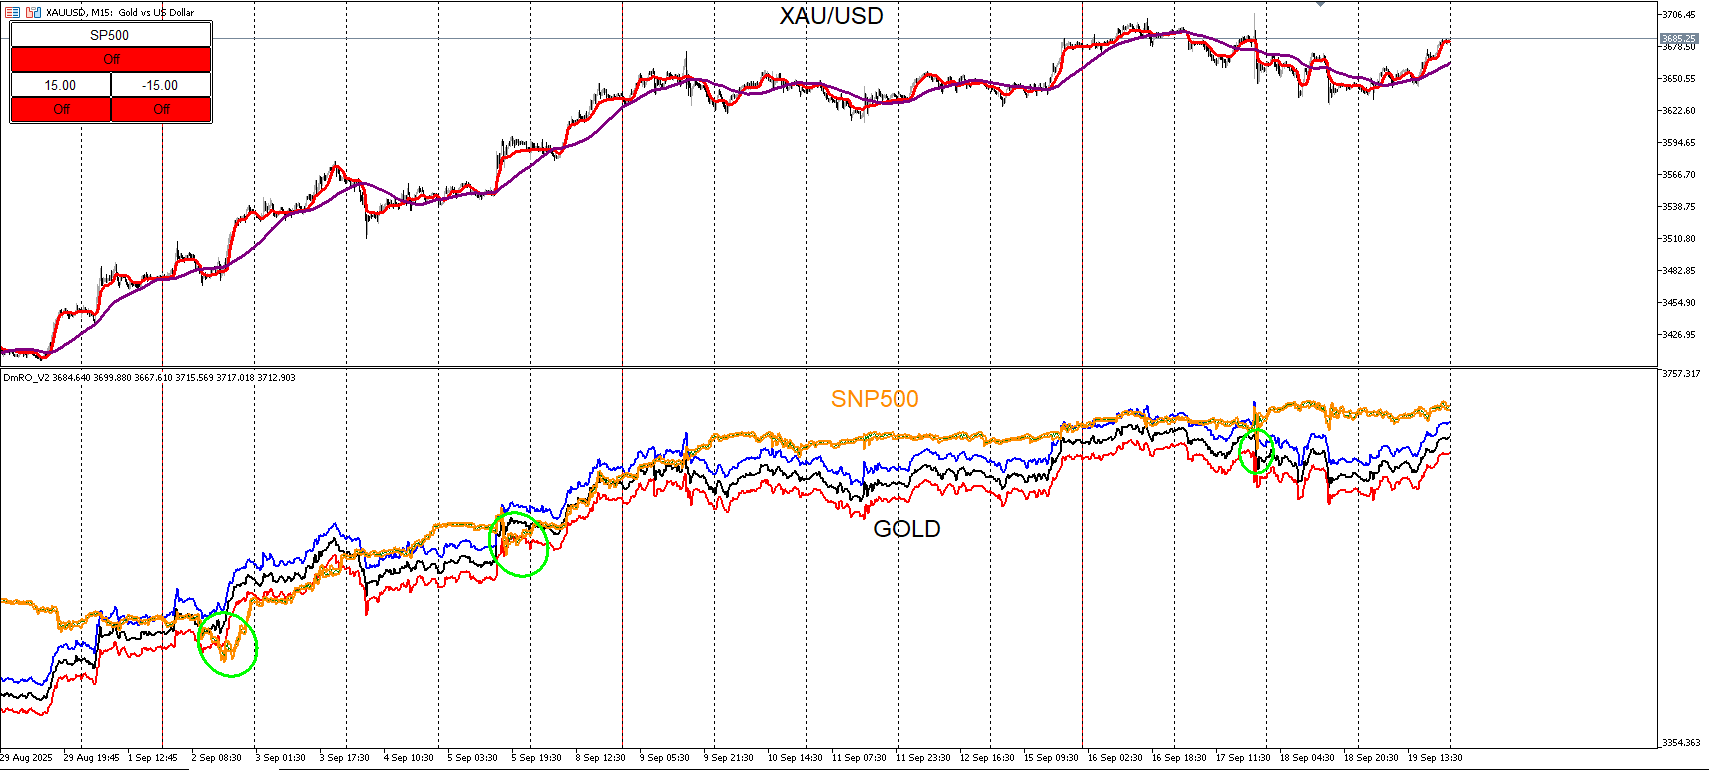
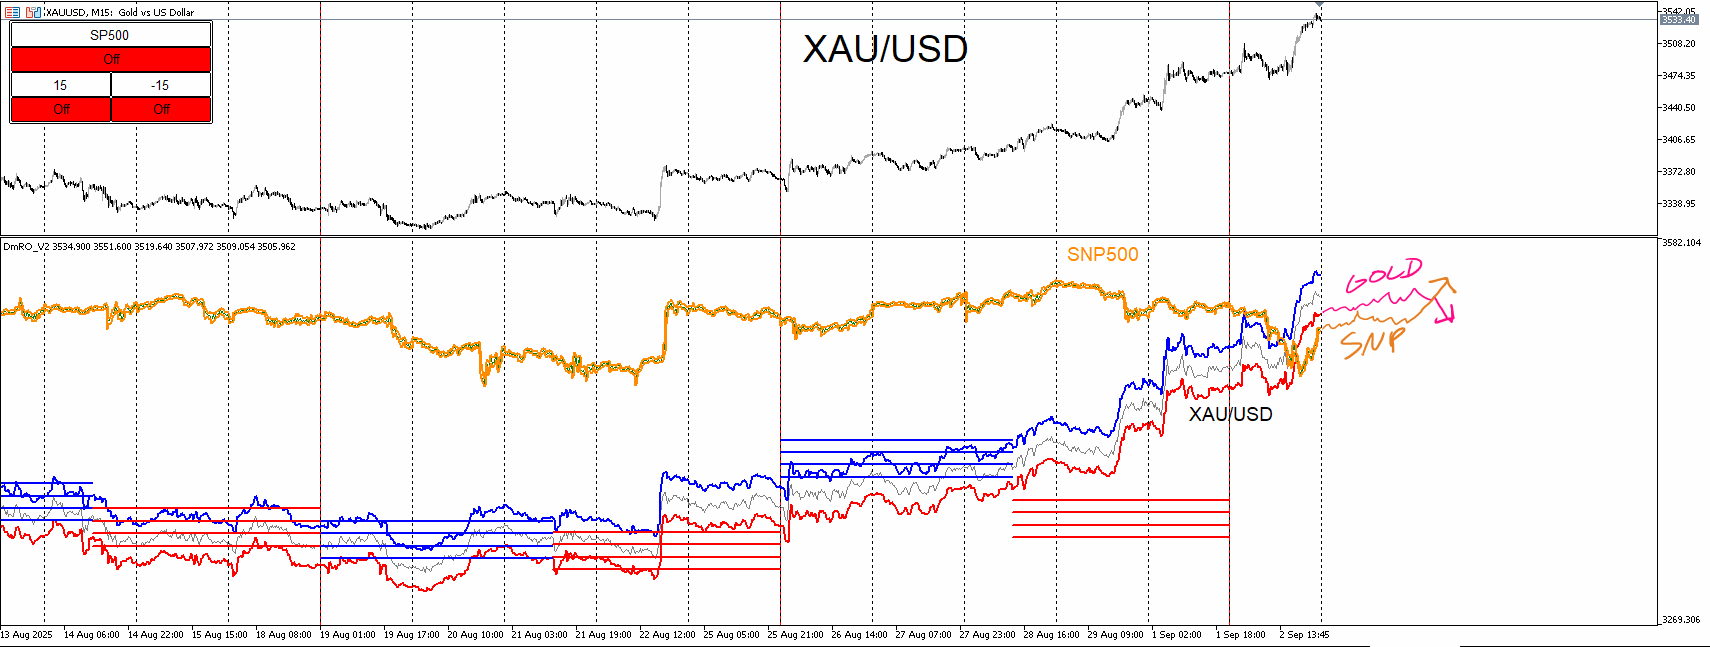
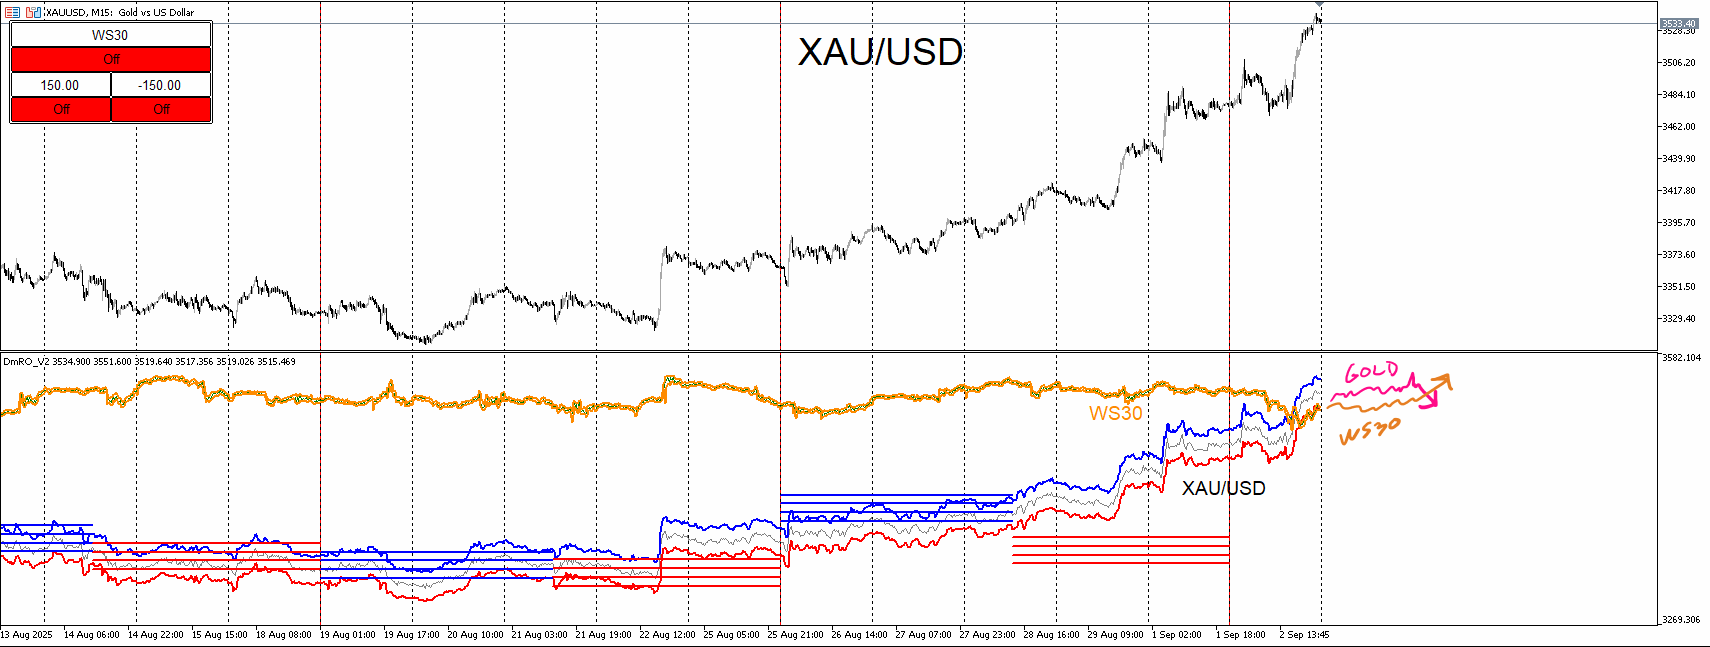
For indices and metals, both Gold and the SNP moved pretty similar since the SNP overlay crossed below the red tracer of gold. I added on to the SNP whenever it retraced back down below the red. For gold I am adding shorts around bullish momentum over time. Not heavy but this is how I’m shorting gold even though it looks like it’s still going up. I view bullish momentum here as traps before it retraces back down.Overall I see the SNP overlay as a wall that gold is pounding before diverging.
-
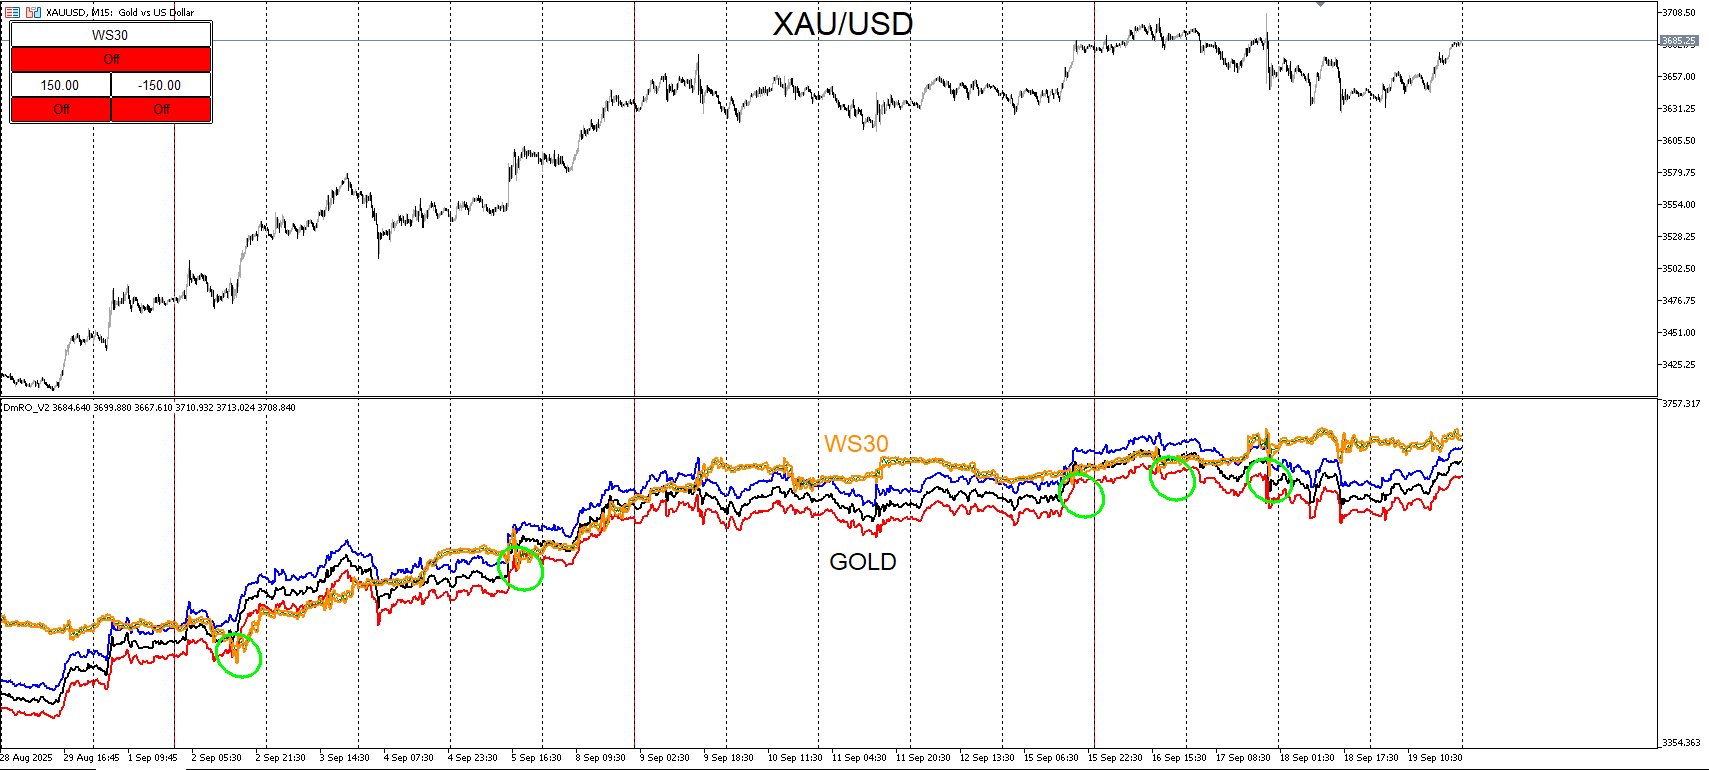
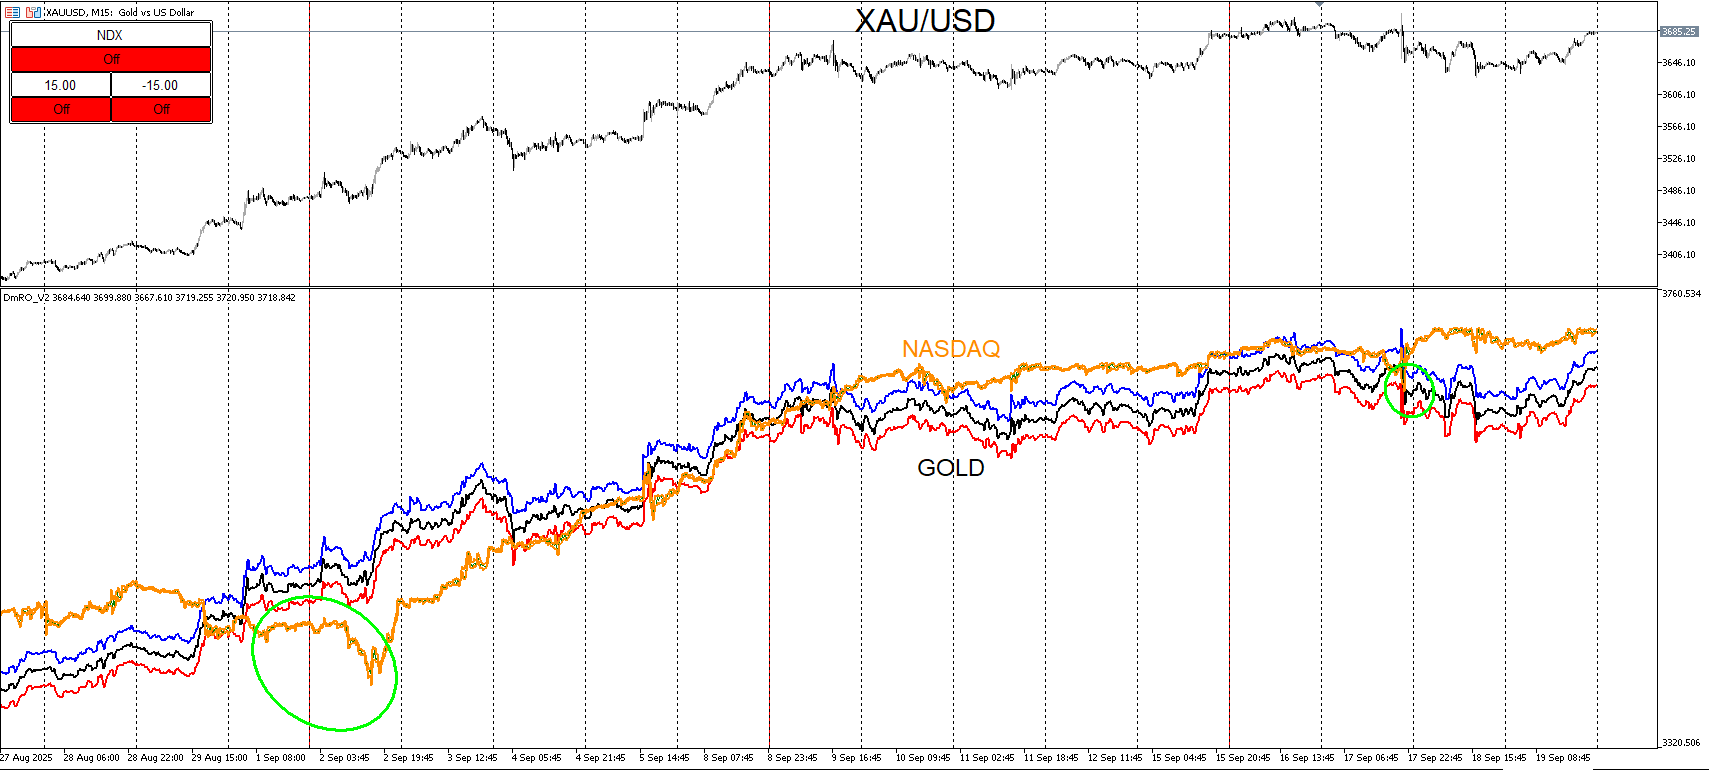
RE: My EA updateposted in General Discussions
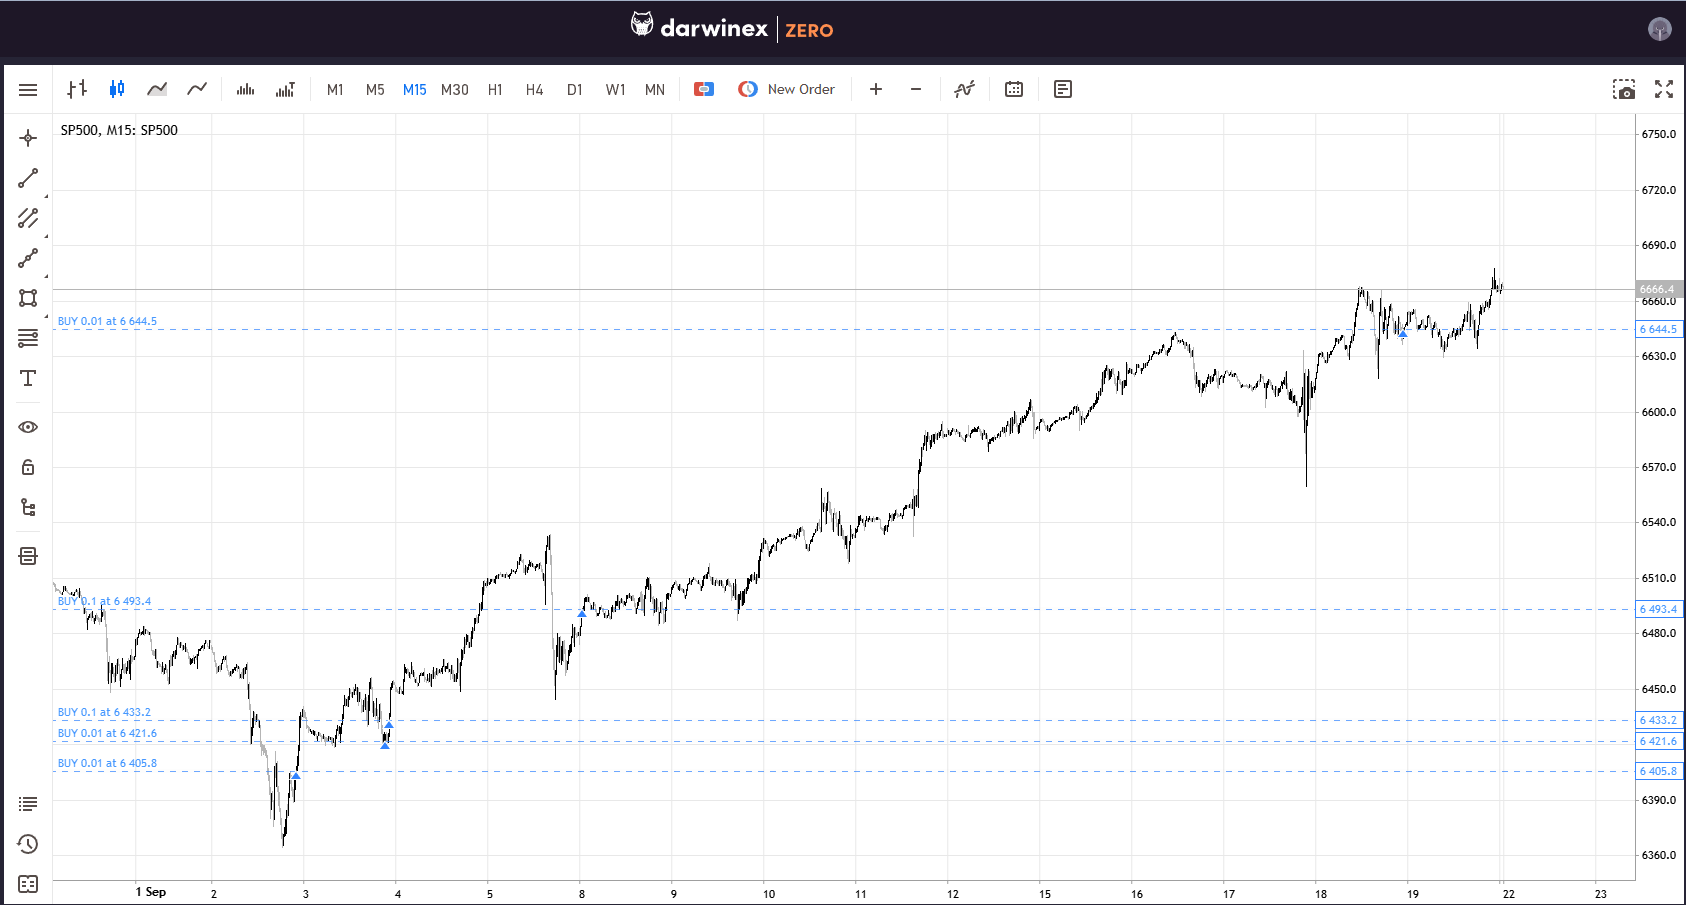
Here’s a look of the DmRO indicator when applied to indices and metals. I don’t focus much on indices and metals but there are opportunities that can be spotted from time to time and I believe this may be one of them. Looking at XAU/USD, it’s been a bull market for quite some time. One should be very cautious of shorting all times highs and possible squeezes up but I believe that there is a time and place for everything. What ‘’should and shouldn’t’’ be done when it comes to trading the markets is entirely dependent on the trader when it comes to strategy, edge, and risk when it comes to tolerance and how it’s managed. I don’t view all trends or phases within trends as the same. In this situation I am more willing to short gold. That doesn’t mean that I expect it to fall from here. I prefer to see it climb up more and pyramid shorts into bullish volume over a period of time. I will not go heavy while expecting a drop. I will enter small and manage risk so that if I’m wrong, the losses will be very minimal. This is more so an opportunity to long the SNP and WS30 for a long term entry. 5 out of 5 of the previous interactions within the indicator throughout this current year were opportunities to get in with the April drop being the most extreme. This is my idea for an entry based purely off that probability.
-
RE: My EA updateposted in General Discussions
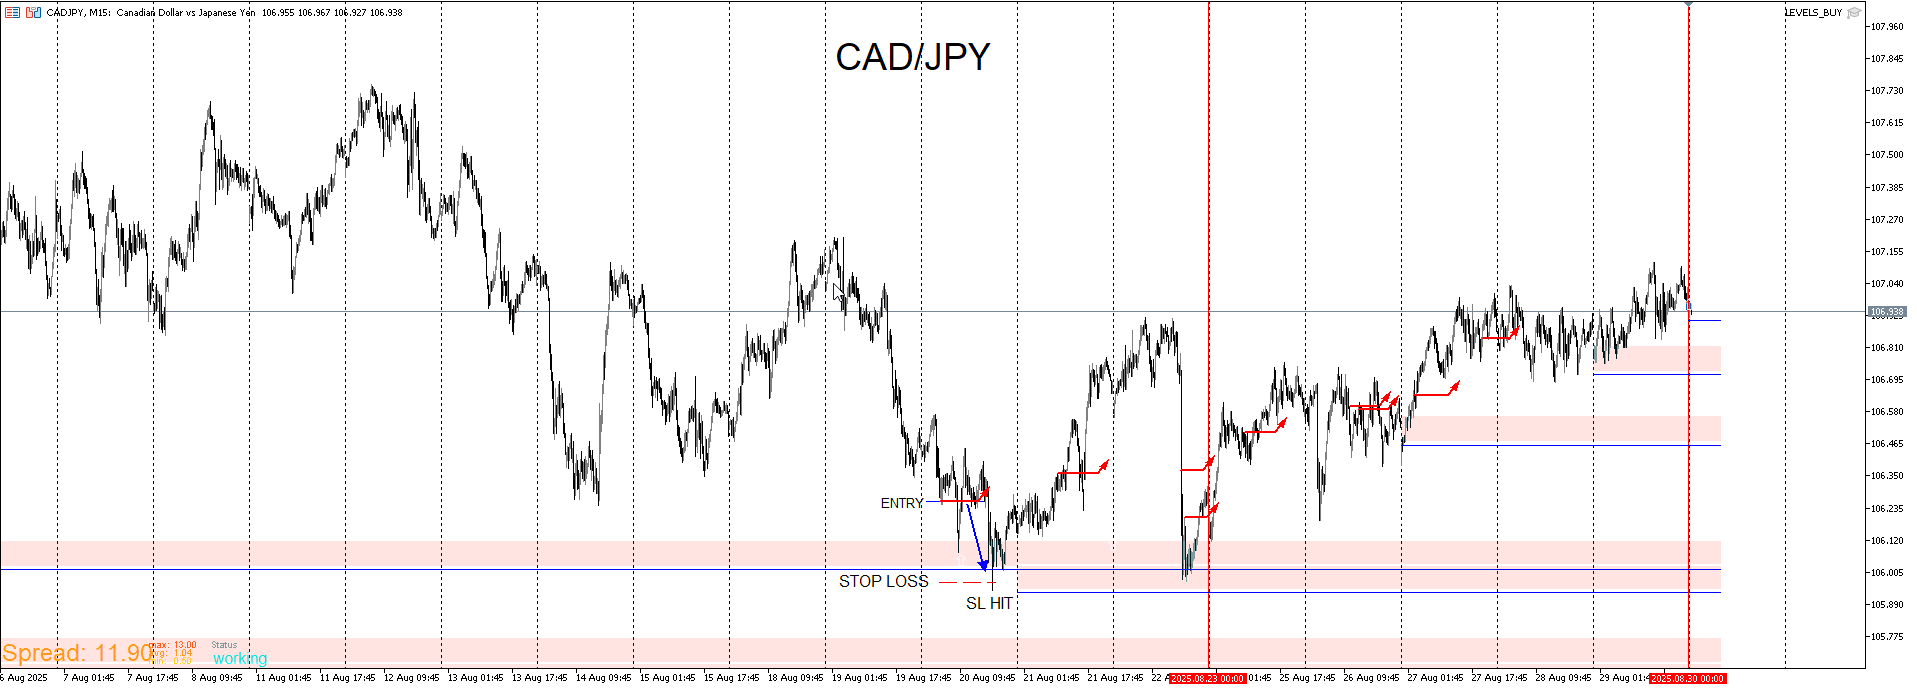
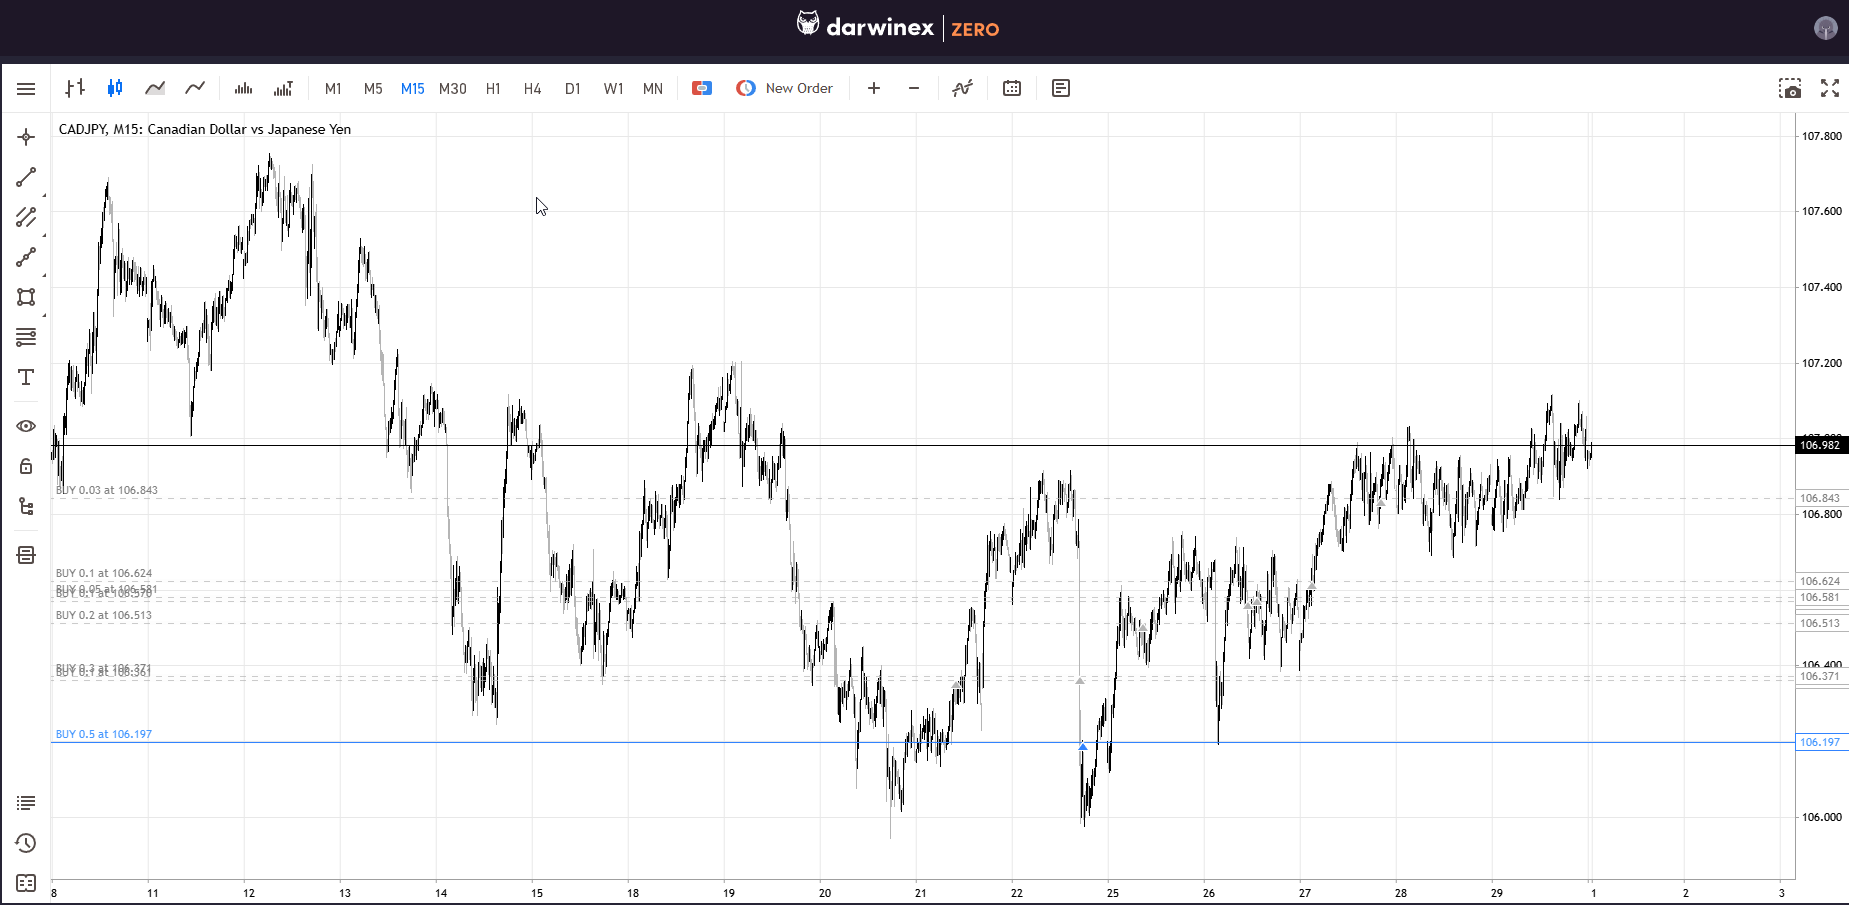
Here’s an update to end the month of August. My first entry on CAD/JPY got stopped out. That was why I used a very small position on the first entry. Even though I got stopped out, that didn’t change my bias. I re-entered and added more positions of varying sizes but all still reasonable to the account size. The stops are also set underneath market structure. I don’t know if price will continue upwards. But if it does, this is where I want to be positioned. While I do look for bottoms, they are really hard to time for entries but I will pyramid positions if I believe the bottom was recently put in. Highlighted in green are my positions. I did add a couple on the drop but in this case I didn’t worry because this is a rare instance I’d feel okay with doing so. I’ve also shorted GBP/AUD and GBP/CAD which both moved down. Now I will sit and wait and let it play out regardless which way it goes. When I see another opportunity to add I will post an update.
-
RE: My EA updateposted in General Discussions
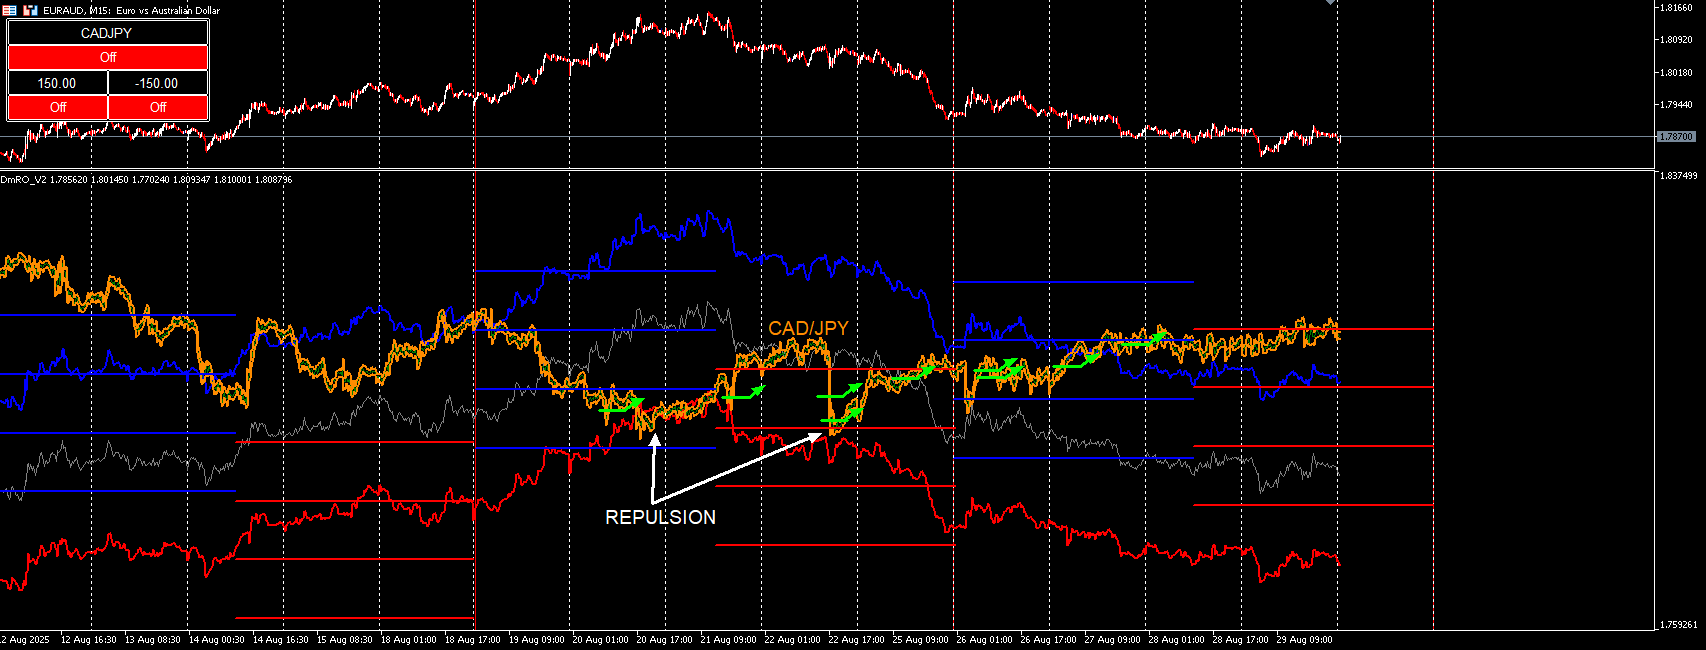
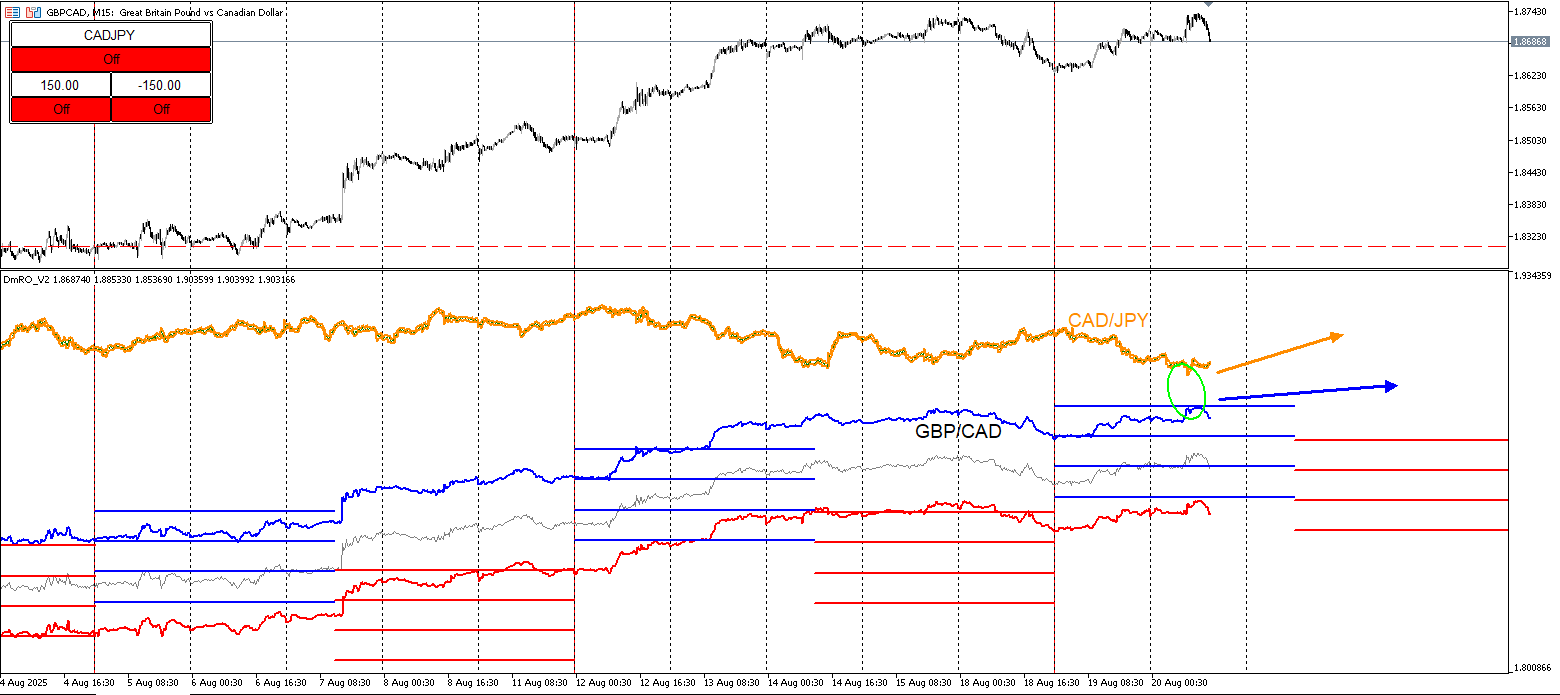
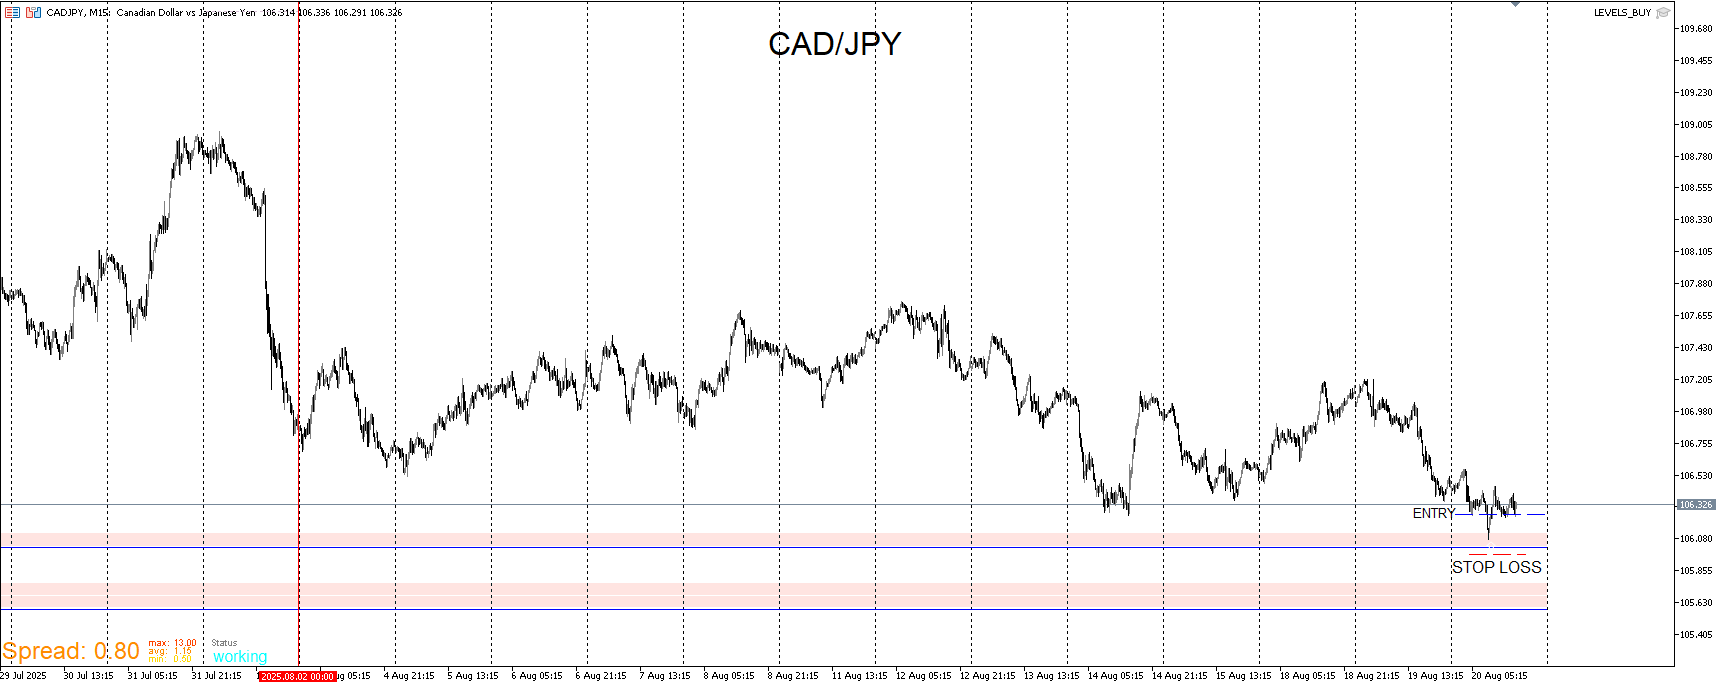
Here’s a setup that I briefly touched on in a previous post. This will be the second time I’m taking an entry with this setup. I’ve actually missed a handful of them due to computer issues so I didn’t catch them live. This is a rare instance and the type of setup that I see as a lucrative opportunity. I believe that CAD/JPY is at or nearing a turning point before upward momentum come in. I entered at 106.253 with a small position. On this version of the DmRO indicator is the ability to overlay another instrument. The feature isn’t 100% perfect for every instrument and can be buggy but overall after a lot of cross referencing and filtering out what works and what doesn’t, it’s a pretty handy feature. A handful of currencies just aggressively pushed up namely EUR and GBP currencies. Though my bias is short on them, that doesn’t mean that I’m shorting now. That opportunity may come weeks later. But what I am looking at is how CAD/JPY is interacting with GBP/CAD and EUR/AUD. CAD/JPY which is represented in the orange moved down as certain EUR and GBP pairs pushed up. I am expecting a repulsion with CAD/JPY going long and some EUR and GBP pairs likely stagnating sideways. Just because one pair puts in a trend, that doesn’t mean that an inverse pair will put in a trend in the opposite direction. Maybe they could go short from here but from past experiences, it never worked out for me shorting into aggressive movement like this. For GBP/CAD, I’m looking at CAD/JPY vicinity to the blue tracer. For EUR/AUD, it’s very near the red negative tracer which is the strongest signal for this setup. The actual price line can be used as well. These lines can break through each other and continue but that’s a very rare scenario so I look for either pinching or some intersecting before reversing. Also it depends on if I have other analysis that confirms my bias which in this case I had other reasons to be long on CAD/JPY. This method assist with timing.
Here's a template that I still use. This helps with risk. If my analysis is wrong or mistimed, this is where I want to be invalidated at. I can always give it another shot later.
-
RE: My EA updateposted in General Discussions
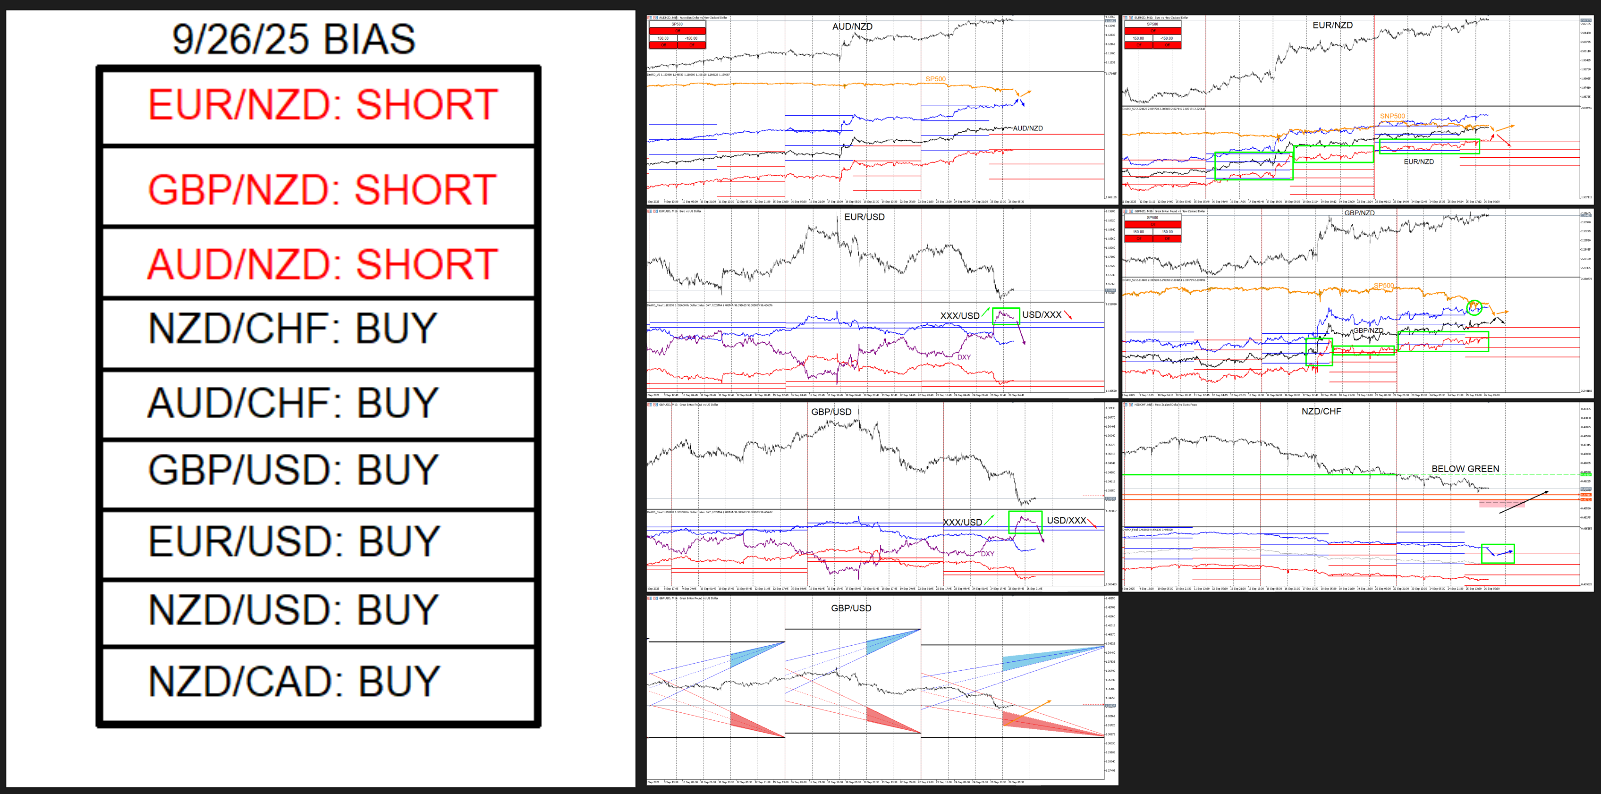
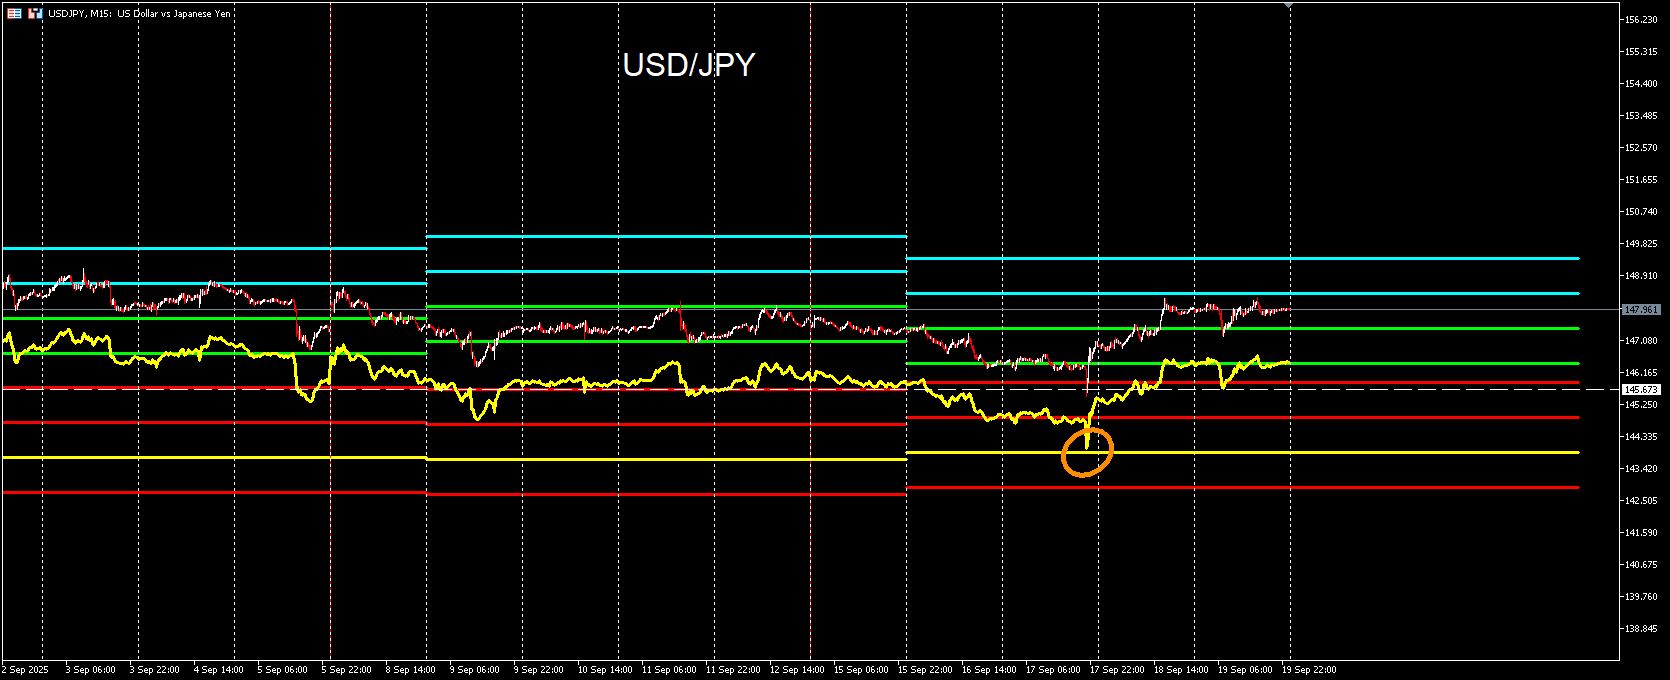
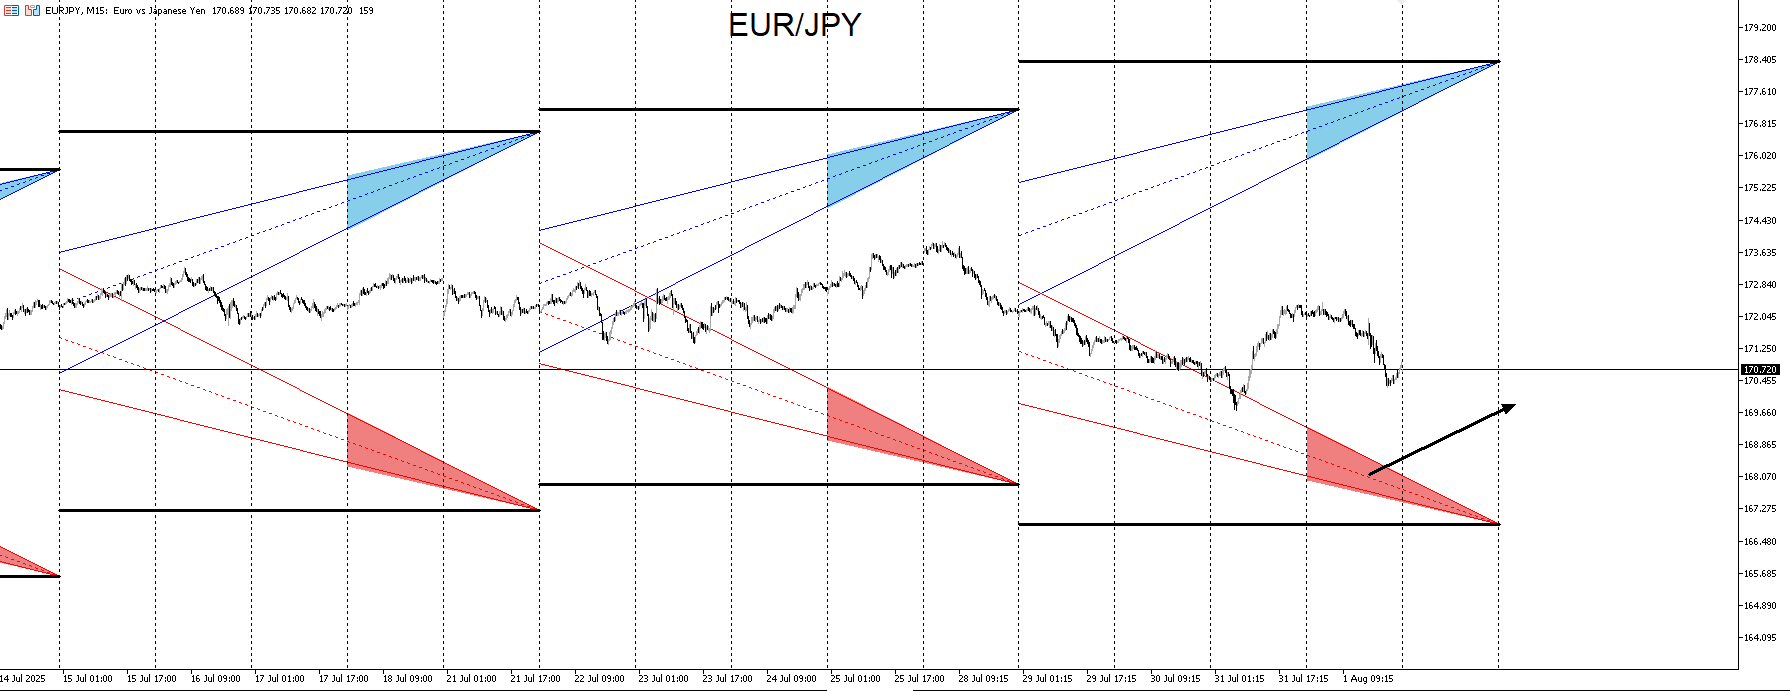
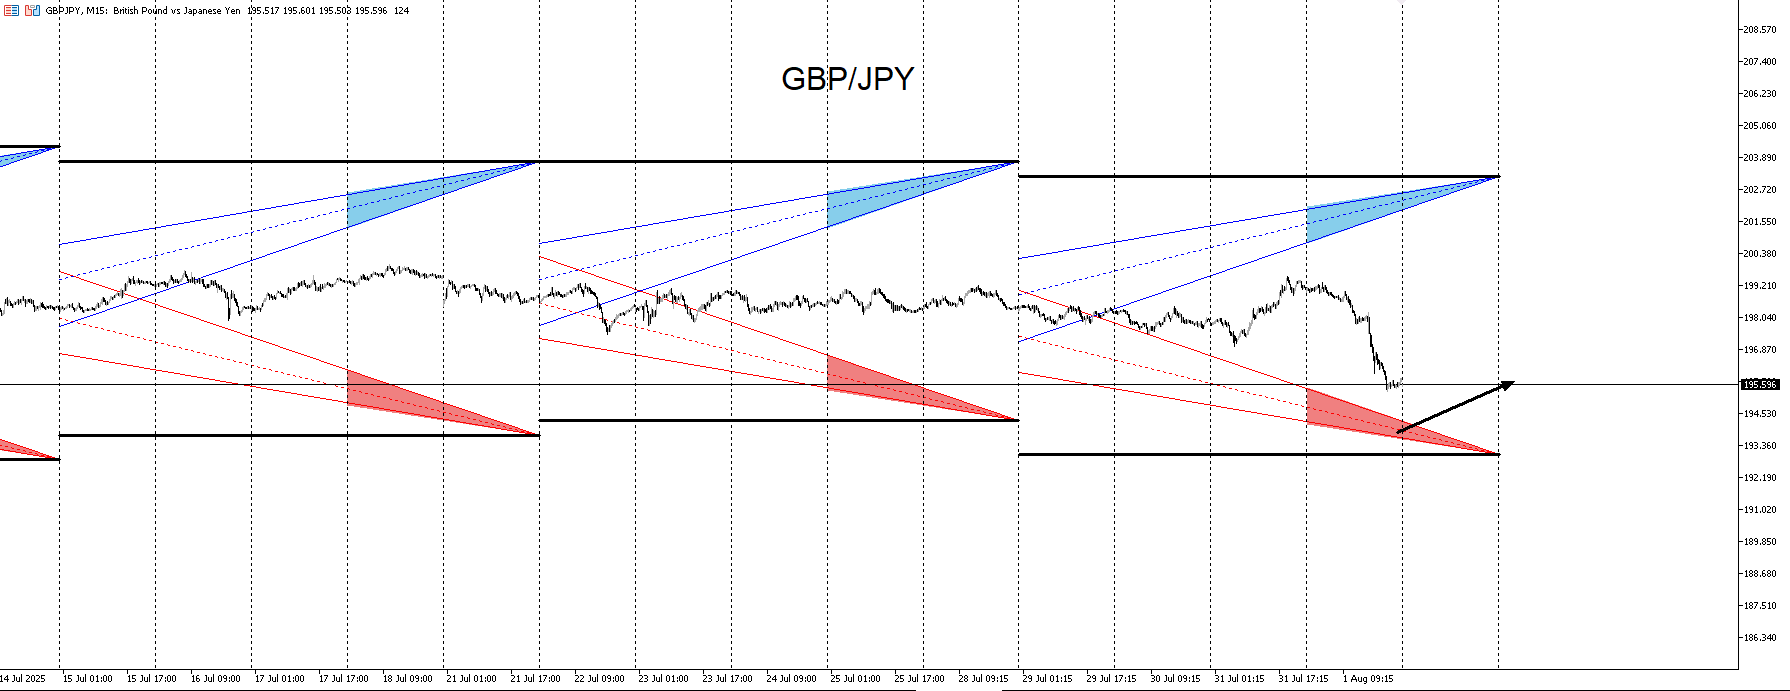
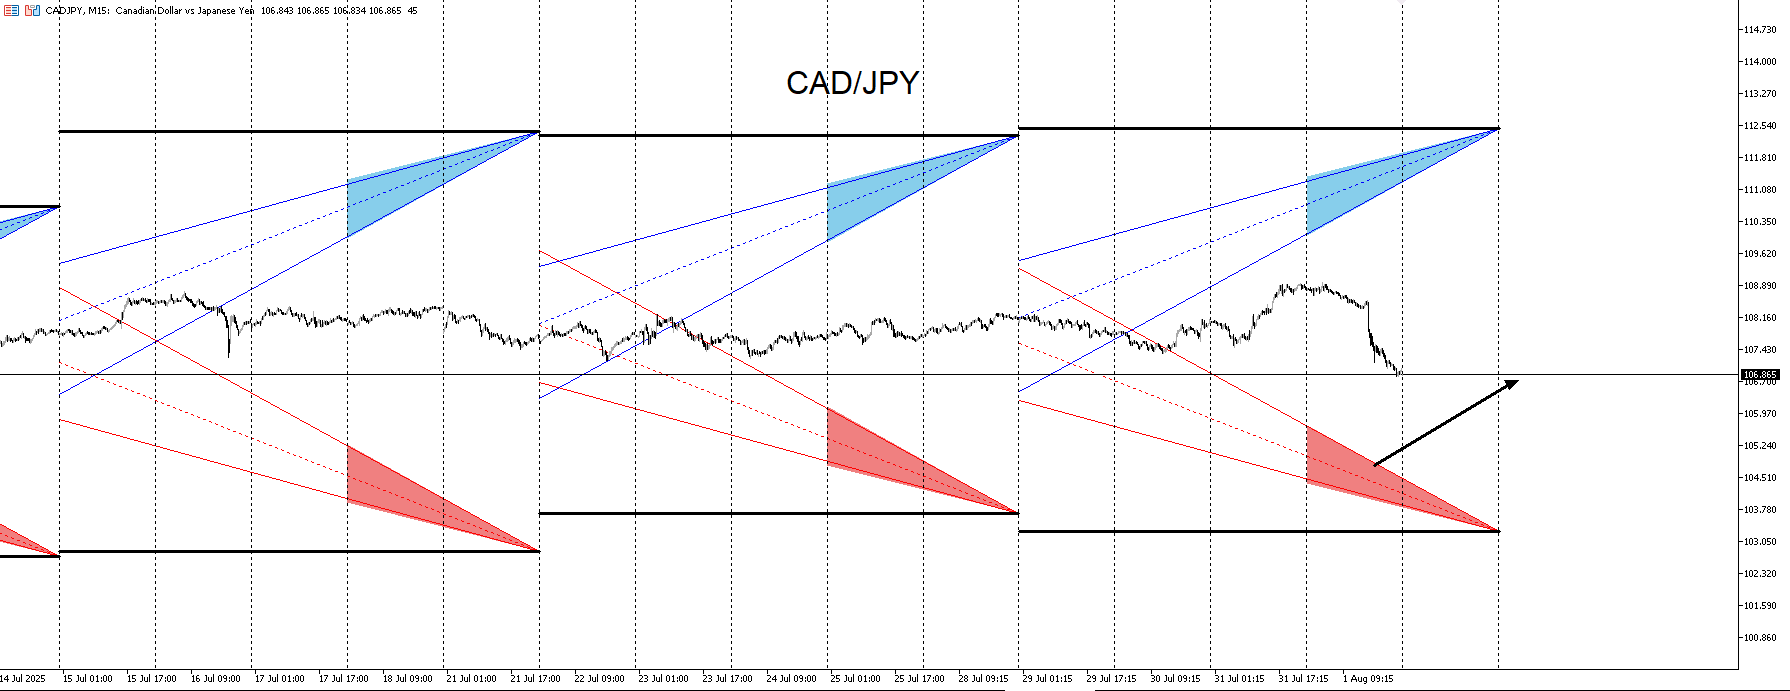
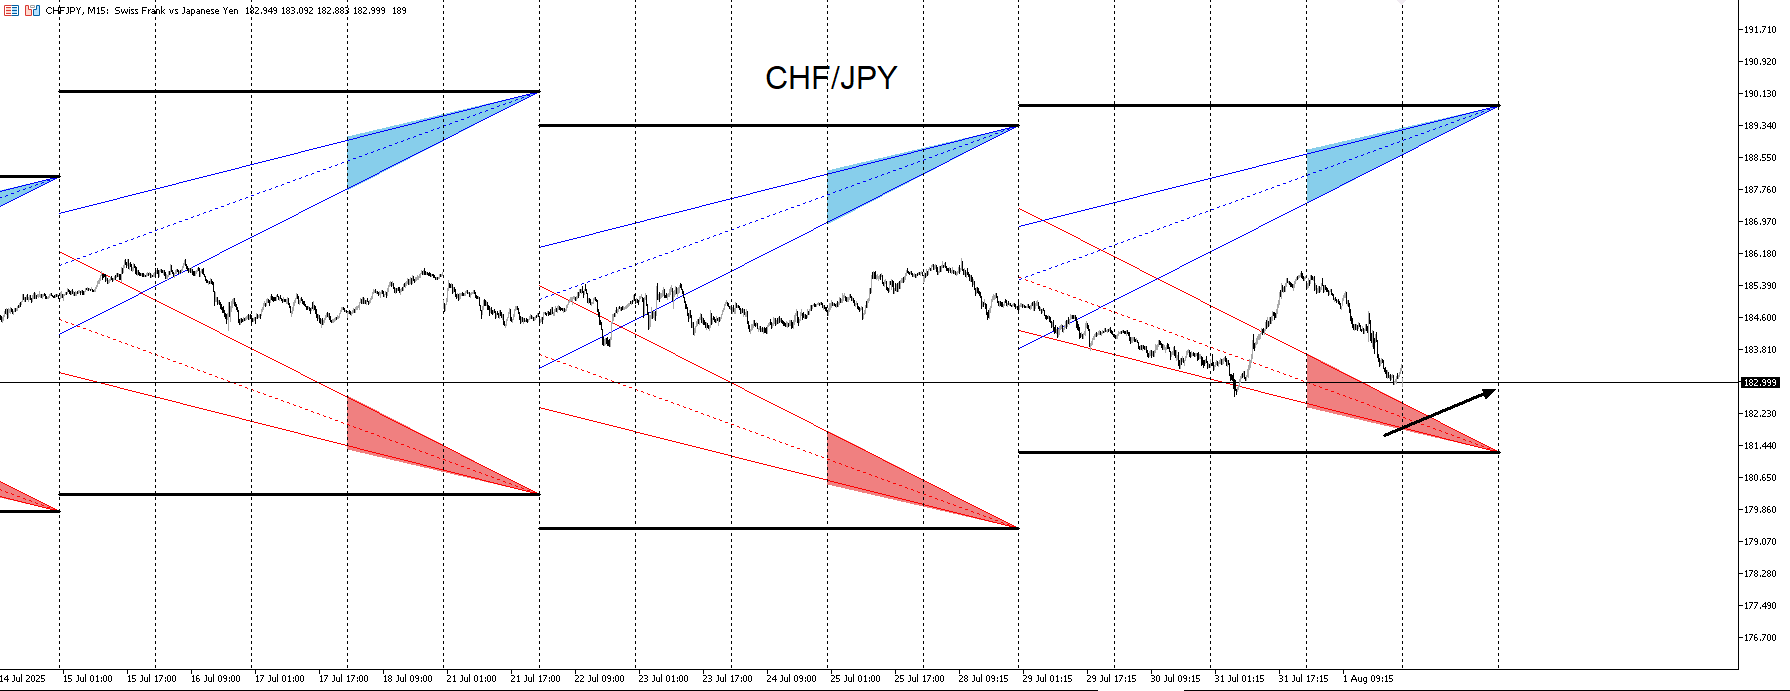
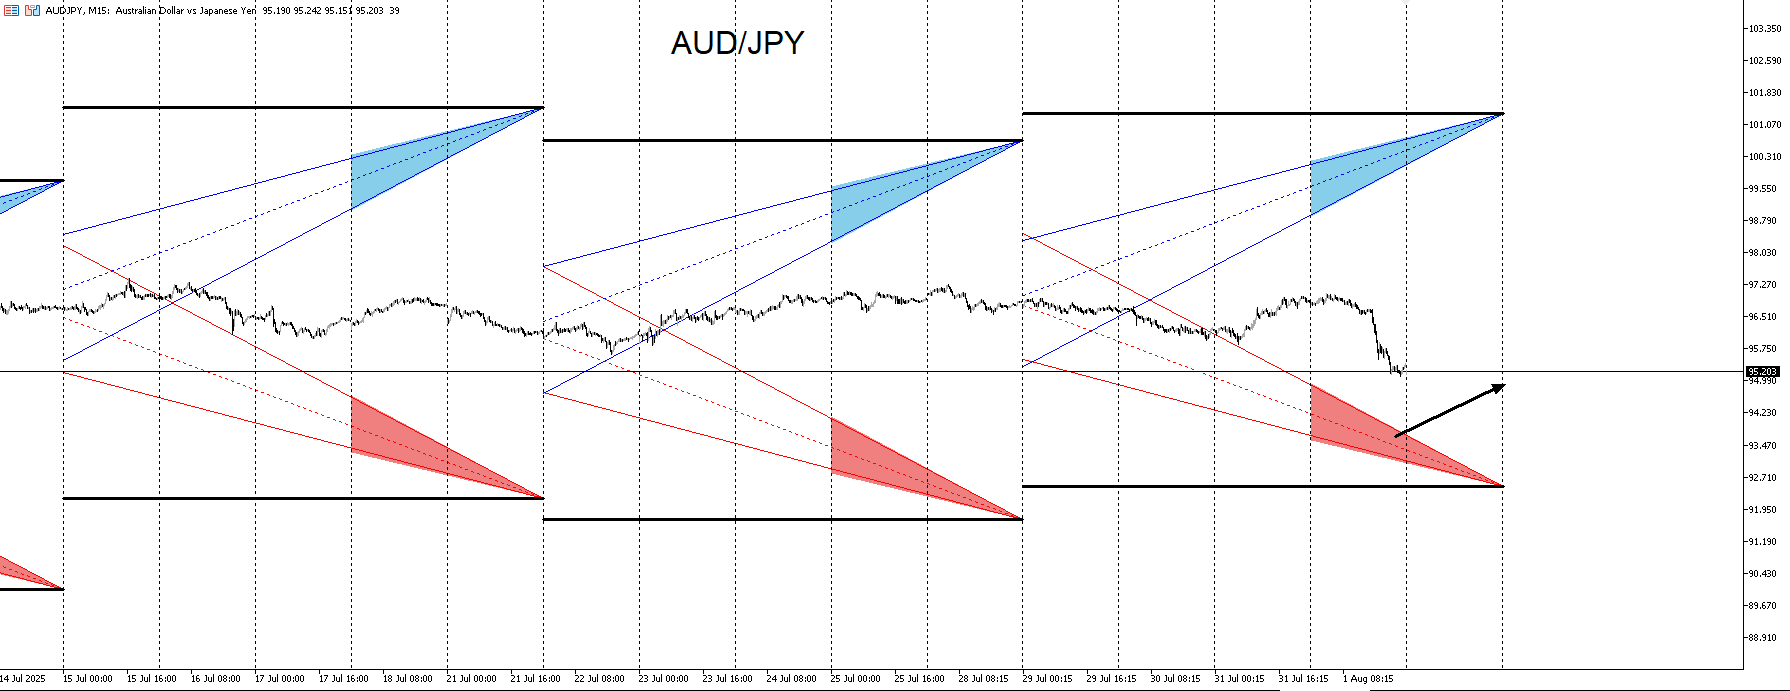
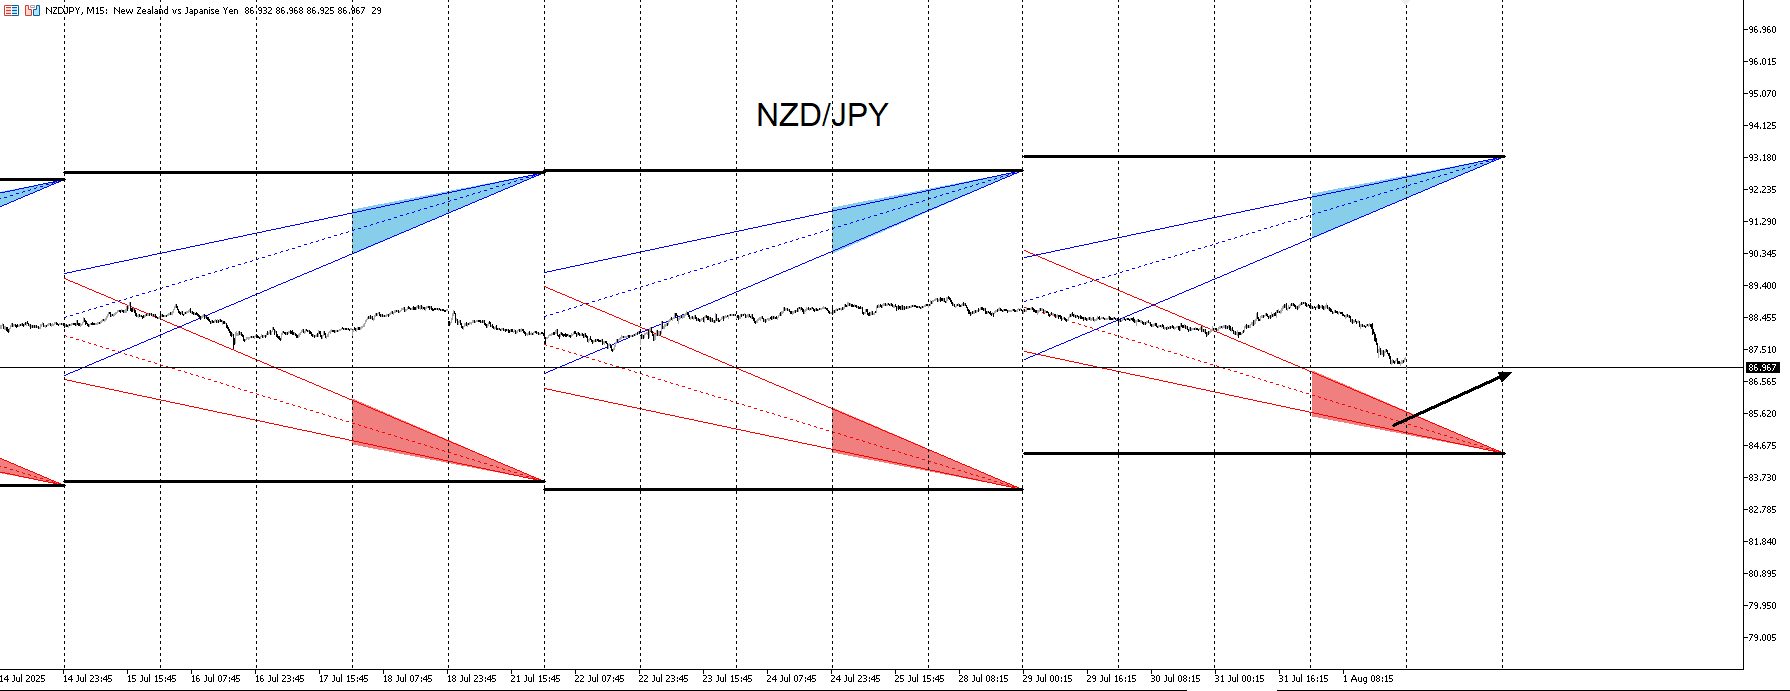
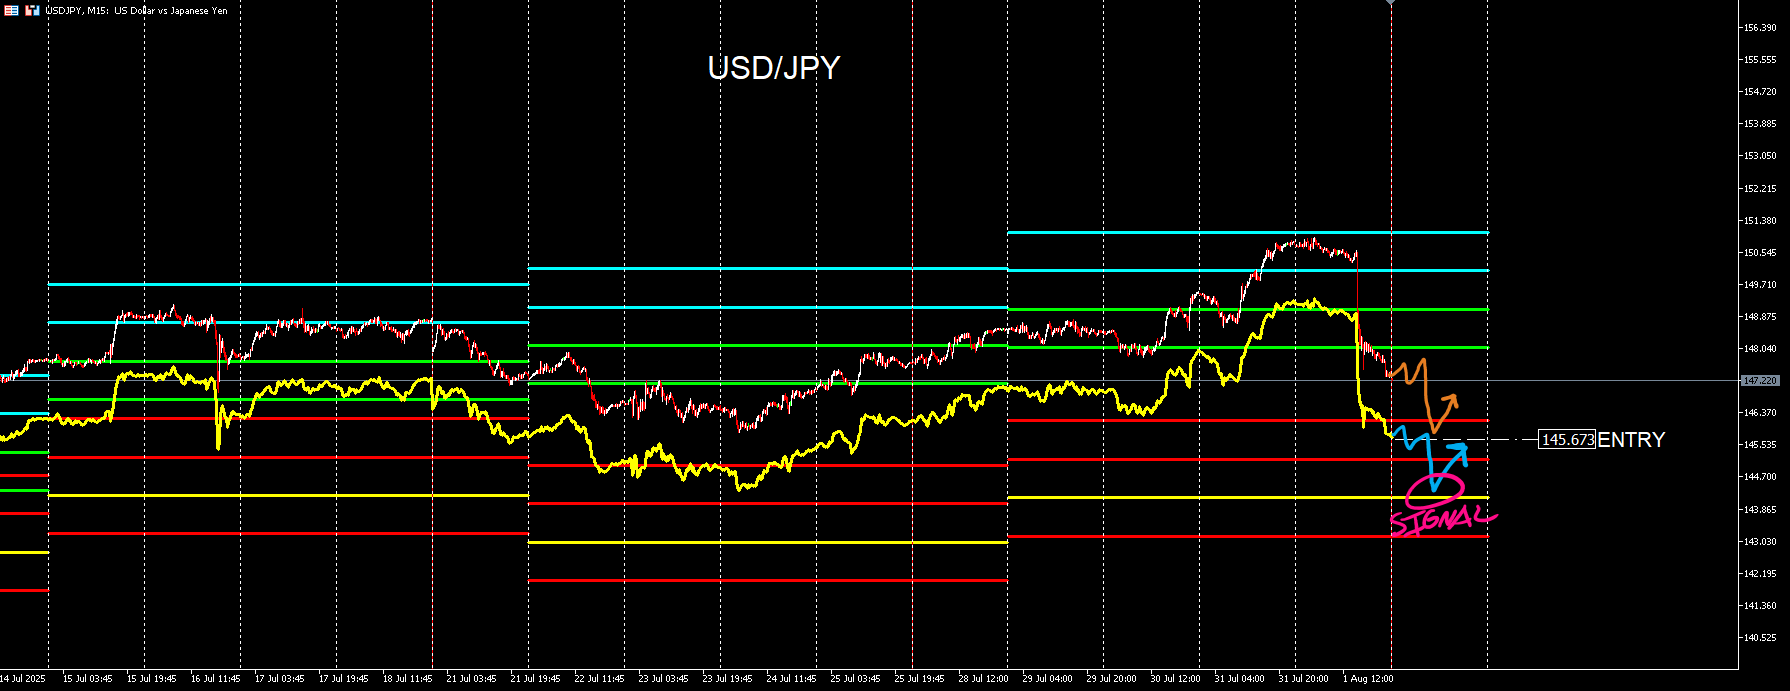
For this coming week I’m getting long signals on the Yen pairs. GBP/USD signaled long too and came just shy of my limit order before pumping up. Knowing that these pairs may continue their uptrends, this is where I want to enter and I’m looking forward to XXX/USD pairs to continue lower and move upwards once the Yen pairs start to consolidate after upward movement. If Yen pairs do continue up, I don’t expect them all to continue up. Maybe a small handful will but I would expect AUD/JPY and NZD/JPY to likely consolidate more and drop lower before continuing up. The USD/JPY chart with the black background is the indicator modified to display it in another template that I use. If I suspect the market will keep trending up, I will want to enter when that yellow tracer contacts the yellow line.
-
RE: My EA updateposted in General Discussions
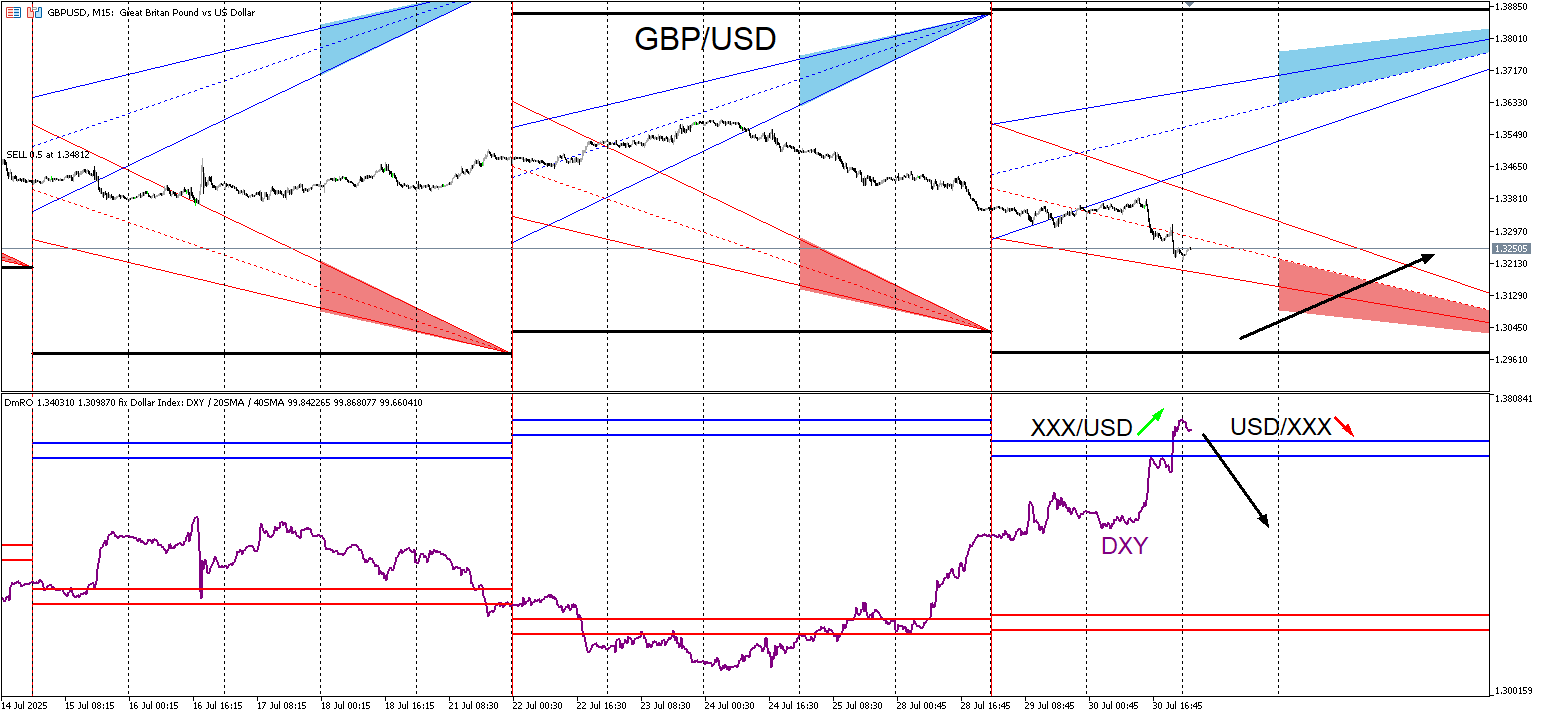
Here is one entry I’m taking using the indicators. The DmRO indicator is modified with the levels adjusted and the DXY is overlayed on top. The idea here is to see where the purple DXY line is at within the indicator. If it’s near or above the positive blue levels, its a sell signal for USD/XXX pairs and a buy signal for XXX/USD pairs. If it’s near or below the negative red levels, Its a buy for USD/XXX pairs and a sell for XXX/USD pairs. For this case price can go lower while the DXY is above the positive levels so I am only accumulating small positions at the start of a probable uptrend. This pair has been trending up for a while and if it’s going to continue, I see this as an optimal zone to hop back on it given the time and what the indicators are showing. There are other pairs that I’m entering in on too but this one is the only one I had time to do a write up on.