@l-andorrà I agree. That's what I had to do. The program is very good for fleshing out ideas and seeing if it's viable. It cuts out a lot of back and forth between communicating stuff to the developer. When you are satisfied with it but need it optimized, it gives the programmer a good frame of reference to build from.
J
Best posts made by JayPhillbrooks
-
RE: Backtesting is getting slower and slowerposted in Questions & Answers
-
RE: help for pivot 10 candle indicator fxdreamaposted in Tutorials by Users
@fdfx Unfortunately I'm not of use to assist with this. I'm not savvy when it comes to actual coding also this is an indicator which can't be created using this platform. It does remind me of projects I've done and solved but they were EA's. I'm not sure why it works on live market but not in backtester. You may have to try duplicating a new terminal and try it on the fresh one. Sometimes the tester be weird on one but works on another. Normally when something works live but is funky on the testers, usually the code is good. I could be wrong but hopefully someone with more knowledge can help.
-
RE: My EA updateposted in General Discussions
@Alex81 Correct. About 7 EA's. I covered the important ones. It's complex in terms of development. I just sought for the simplest strategy. Holding and milking the move. While other traders are focused on all the other stuff that they believe causes the market to move, I'm as close to the bottom or top and in profit no matter which direction price moves while they are taking on risk. My objective is to eliminate as much risk as possible. These templates helped me achieve that. Every position I'm in right now is as close to the bottom as possible. That's where I want to be. Yes this was all done in FXDreema. As frustrating as it was to make everything work, it's definitely possible to use it in more creative ways than just trying to build a strategy with a perfect equity curve in all market conditions which is impossible for me to do.

-
RE: My EA updateposted in General Discussions
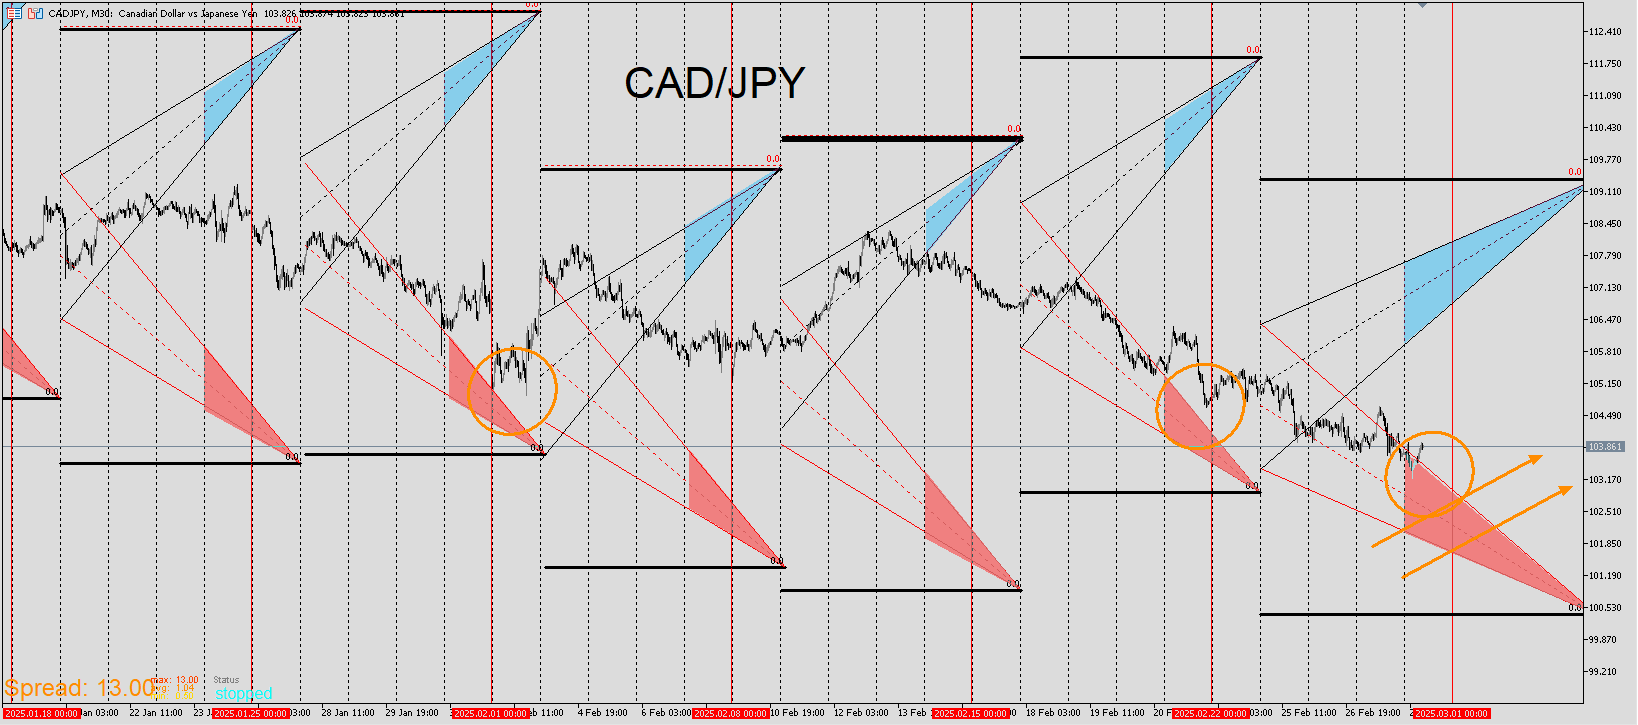
Here is an example. It is a bit of an oversimplification. This usually plays out on a large timeframe but there's only so much room on the chart to draw it.

I will share a video of the EA in the next post to show how the line comes to be.
-
RE: Please Help Me Create My EA With Specific Simple Strategyposted in Questions & Answers
@l-andorrà Yeah it's definitely the best tool out of all the ones I tried and I'm glad that picked it up after trying out the other stuff. It's way more flexible and a ton more options and ways to skin a cat. I also have a 3D animation background and it's really similar to 3D programs that are node based. But yeah it was tough to grasp at first but that's how most software is that are actually pretty good.
-
RE: My EA updateposted in General Discussions
That's it for today. I'm not saying that price will hit those levels soon or if it will at all. I'm just prepared in case it does. If it does, it could be quick or a slow grind for a few days. Every bottom isn't an aggressive spike. It could be a slow roll over as well but I have an Idea of what to look for if that's the case. If it doesn't get there and pushes up instead for a great distance, It's totally fine. F.Y.I. I'm not posting these as signals that I think people should take. This is strictly to show how I blend EA's that I worked really hard on and how I use them to aid me when pulling the trigger. I still put a ton of time in on the charts outside of my EA's. I also still get nervous because I'm using real money and even though results have been good so far, I will be wrong at times. I look for these setups and they take weeks/months to manifest. So I have to get ready and explain my thought process even though price may never get where my attention is focused.
-
RE: ANY ONE TO MAKE THIS STRATERGY AUTOMATEDposted in General Discussions
You have the No Trade bloc connected. It's not taking any more trades because you are telling the bot to only execute if there are no positions. That's my guess. And for future references, if you have an issue with something, there is no need to oversell a strategy as being powerful or claiming there to be some secret. We can tell by looking at it that it won't be profitable because we all personally have EA's like this that we tried to build when we first started. That 20 bucks will be drained real quick when applied to the wrong market structure. When the margin becomes too low, the broker won't even allow the trade. We are happy to help but you are less likely to get help if you don't keep it specific to the problem.
-
RE: My EA updateposted in General Discussions
EUR/USD
This one is a good ways below the green. I've never seen price breach completely below into the white. If there is more downside, I would assume it to be very little.
It's not as deep into the red as I'd like but it is pretty deep below the green and been down there below a good amount of time. A slow grind near the previous two ribbons is also a good sign.


For the high tracer, I'd like to see it go down further and think it likely will. As of now, it's a little high for my liking.

-
RE: My EA updateposted in General Discussions
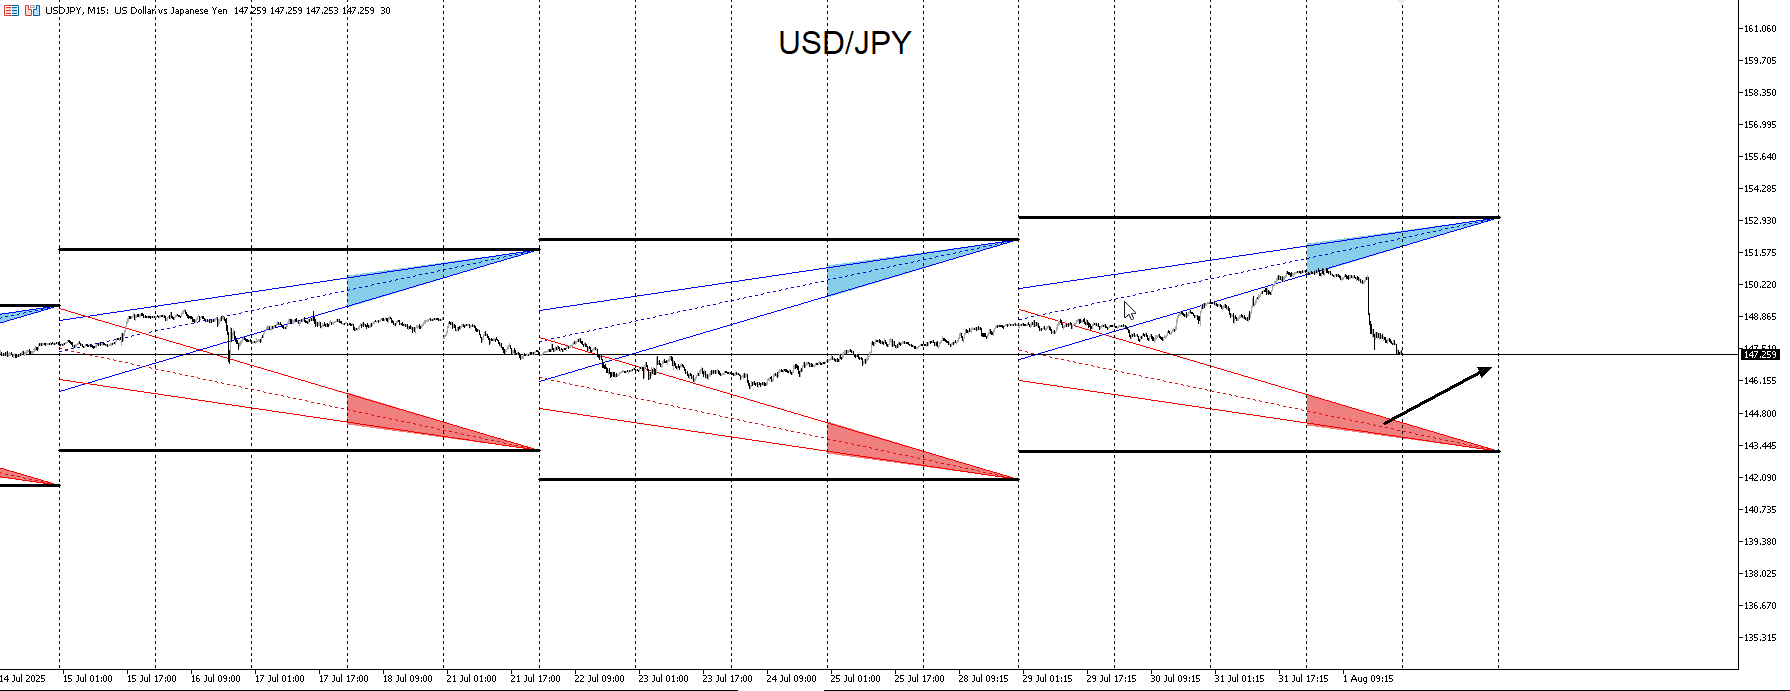
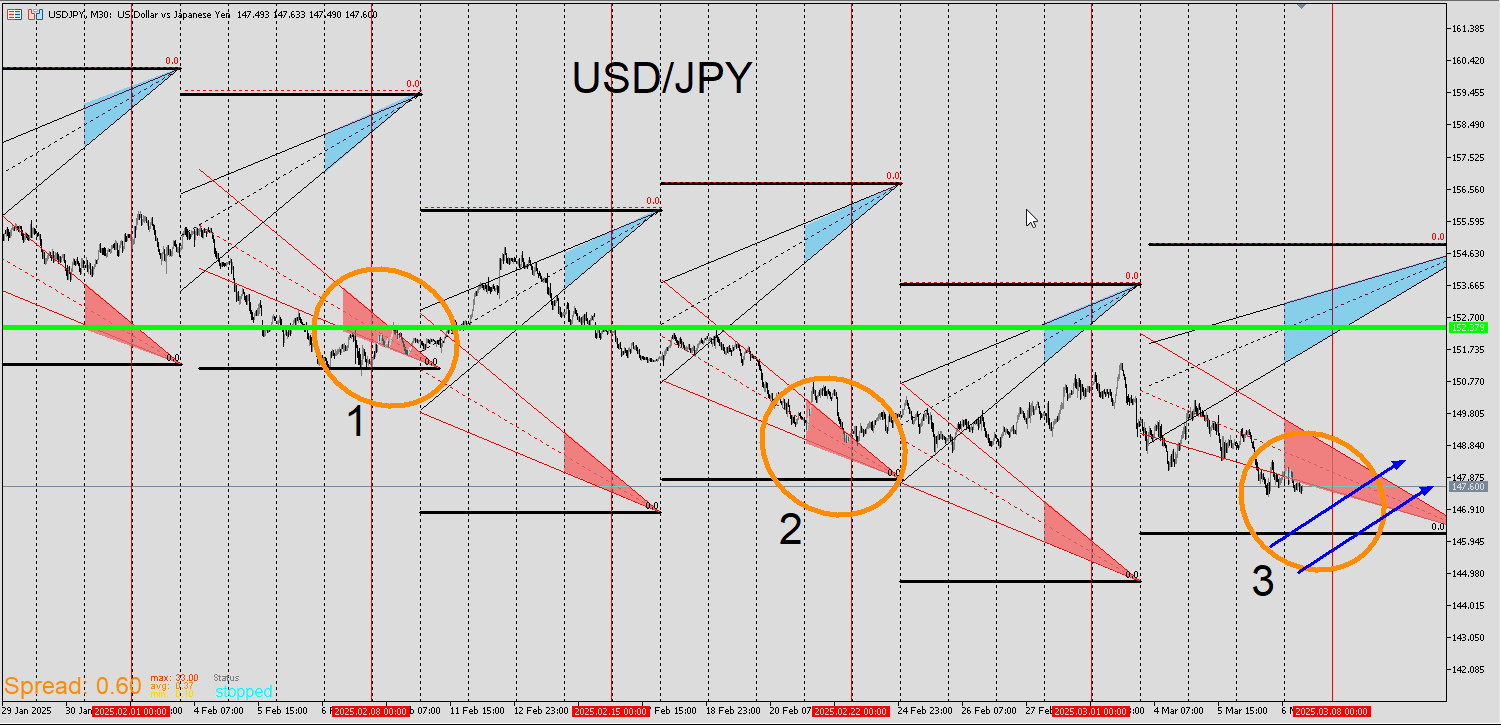
USD/JPY setup came later after the other Yen pairs. When price convincingly and consecutively reaches into these zones, I see that as an entry. I do think there will be some upside to follow. Not sure how much or for how long but if there is, this is a point where I want to enter.
-
RE: My EA updateposted in General Discussions
There are a handful of pairs that could possibly be a squeeze setup into a sell. For each of these pairs price is starting to extend beyond the green lines which is a sign of a reversal. A squeeze up within a short amount of time would be a trigger for me to enter with a sell stop after price trades at the top of the range. If not this still could likely be a top but price may range around these zones for a few days before turning down. Not sure what the likelihood for either scenario but I will be on the watch for both. In this example I'll use EUR/CAD. It has been pushing up but an extended push to the upside in Tokyo or London session, I see it as a blowoff. One thing for sure, I don't want to be a buyer in these zones.

Pairs with the same setup are
EUR/NZD
GBPNZD
EUR/AUD
GBP/AUD
GBP/CADWhatever EUR/CAD does, these pair will move pretty similar.

-
RE: My EA updateposted in General Discussions
I'm taking a couple of entries and will explain my thought process behind them. This is more so a way of how I analyze price action and will utilize an EA for an entry. This is a pattern that I've seen play out while backtesting across multiple pairs and it's rare that it happens and is difficult to spot even after the fact. I'm taking this opportunity to document it live. If it doesn't play out as expected then that's fine but my hunch is pretty strong and the risk is low. This is an idea and I'm sharing it to demonstrate that I don't purely use EA's/Indicators. I use things in conjunction.
The idea here is to pay attention to 2 negative correlating pairs which I have stated in previous posts. For this example, EUR/GBP and GBP/CAD. Both pairs have very similar movement for 2 weeks. I look for a final similar push in the same direction followed by and obvious divergence. Once that divergence is clear, I look for a pullback within that area for an entry. Even though initially I don't buy at higher prices or sell after price goes lower, this is an exception and I keep my risk very low when doing so. GBP/CAD did drop with the recent pairs I just posted so my thesis is short anyway. That drop came later than I expected so I'll use this as an opportunity to short. I'm only using adaptive moving average and trendlines to visualize direction. There are not used for predicting or buying/selling a ''bounce''. Similar structure for negative correlating pairs is bound to diverge and the best way to spot it is to look for the obvious change and direction.


-
RE: My EA updateposted in General Discussions
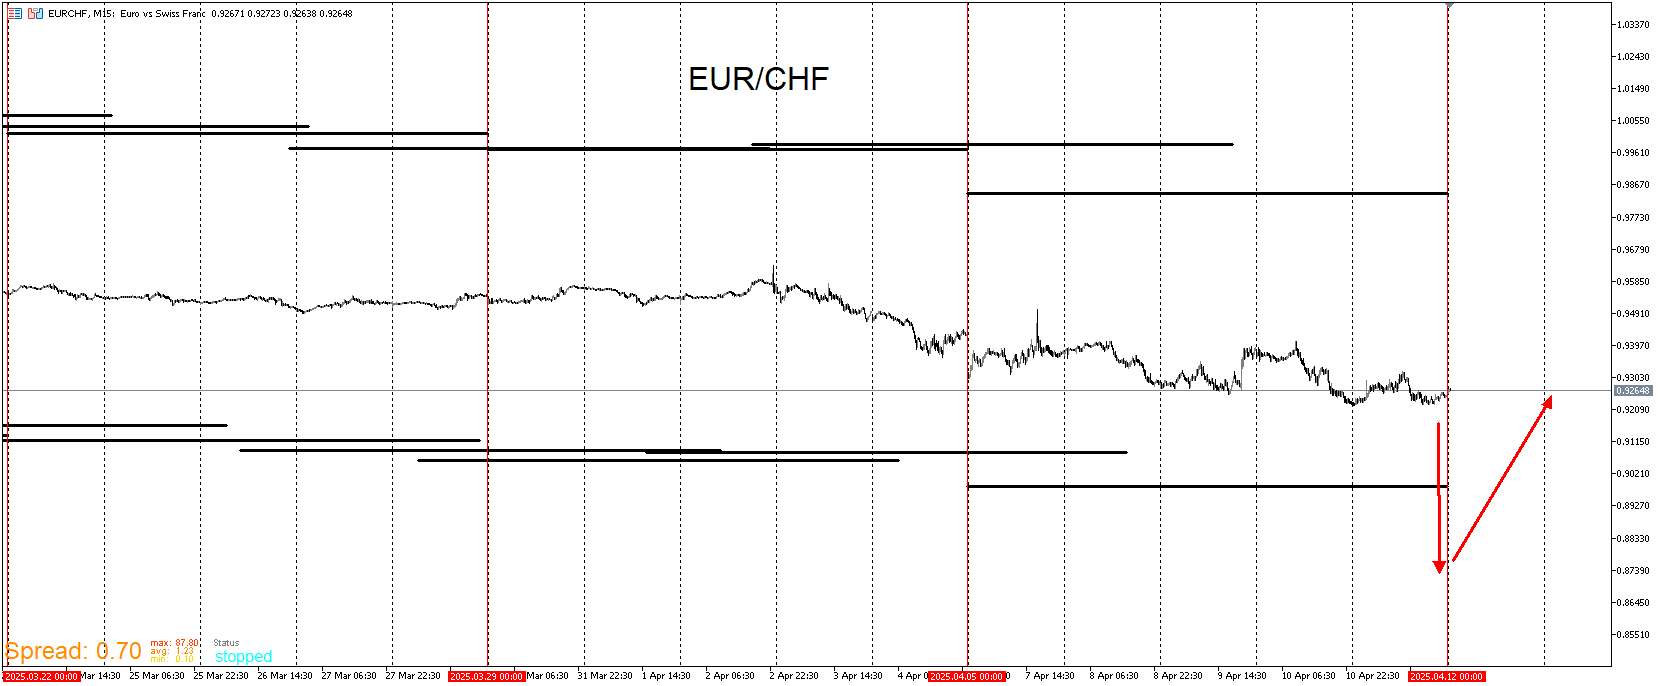
One thing I am looking out for is the Wall Template for EUR/CHF. What I've noticed from backtesting is that price very rarely extends to the wall. Maybe once going back 10 year. It usually reverses between 60-300 points shy of it. Price is around the 250 point range. If there is flush through it, that would be a trigger to enter. I don't think it's likely to happen but I'll take it if it does. Even if the other pairs trends up first, I believe that this pair will trade well below the EUR low that was made on 11/22/24. That could occur over the course of a few weeks but I'll be on the look out for it and will look for that 60- 300 point distance then and even better if the DmRO indicator confirms.
-
RE: My EA updateposted in General Discussions
Back with an update. I am officially done with my DmRO and Ribbon indicator. They will be available soon once I complete the guide. As a show of gratitude, If anyone is interested, I can send the tools with a 3-6 month trial period meaning that once it's plugged on a chart, it's yours for that time period. Plus it would be great for feedback. Also I will make a few more posts in here regarding updates on the indicators but I don't want it to be mostly signals. I have a substack for my ideas now and you will find it here. https://justin15012.substack.com/ I may post a couple more ideas here but this forum should be for learning. I would like to thank all those who created and keep this platform running as well as those who engage because this isn't easy to learn. Still the best platform out of all the other stuff out there by far. Feel free to reach out to me if you'd like to test out my creations.
-
RE: Need help for fixing killzone highs and lows 🙏posted in General Discussions
It's not structured correctly.
This may not be exactly what you need but it should be assembled somewhere along the lines of this.
-
RE: My EA updateposted in General Discussions
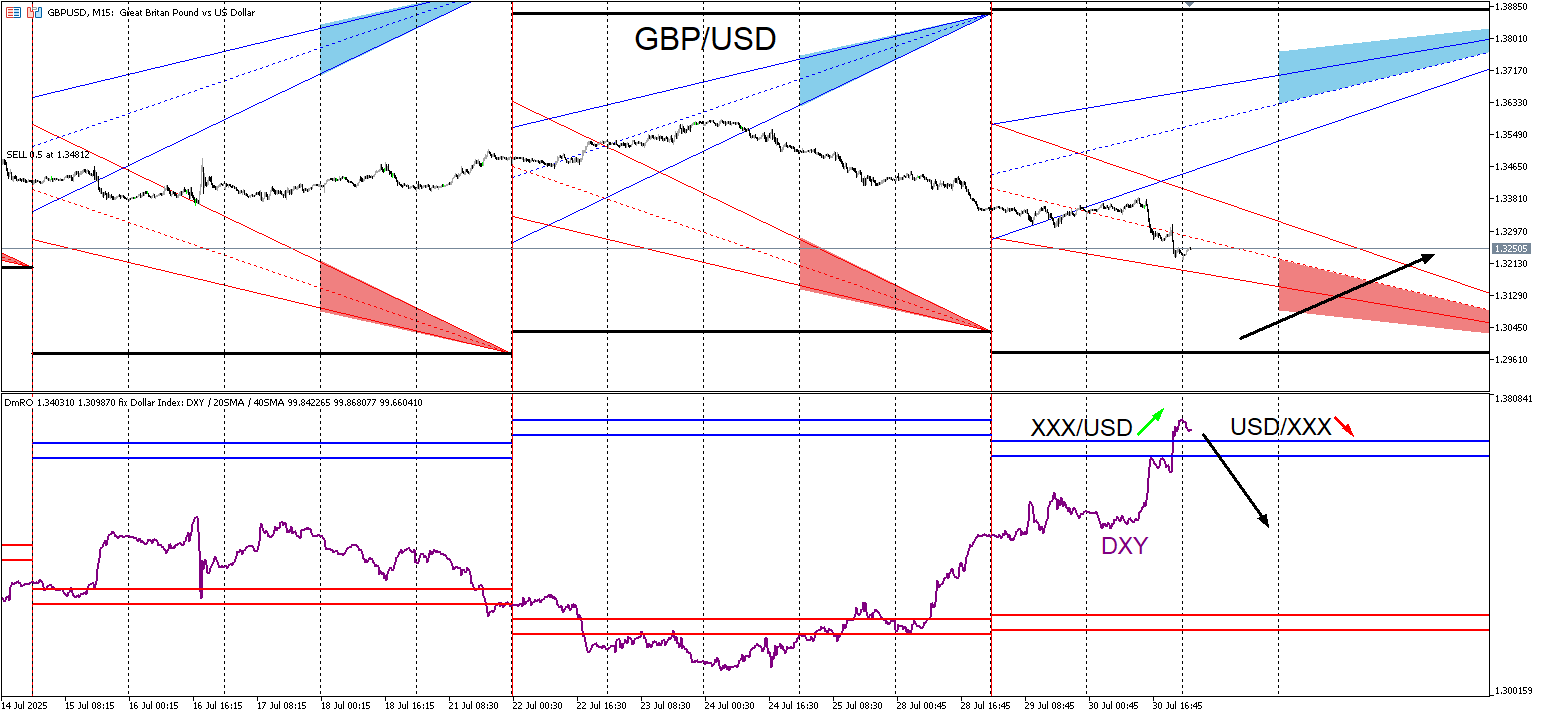
Here is one entry I’m taking using the indicators. The DmRO indicator is modified with the levels adjusted and the DXY is overlayed on top. The idea here is to see where the purple DXY line is at within the indicator. If it’s near or above the positive blue levels, its a sell signal for USD/XXX pairs and a buy signal for XXX/USD pairs. If it’s near or below the negative red levels, Its a buy for USD/XXX pairs and a sell for XXX/USD pairs. For this case price can go lower while the DXY is above the positive levels so I am only accumulating small positions at the start of a probable uptrend. This pair has been trending up for a while and if it’s going to continue, I see this as an optimal zone to hop back on it given the time and what the indicators are showing. There are other pairs that I’m entering in on too but this one is the only one I had time to do a write up on.
-
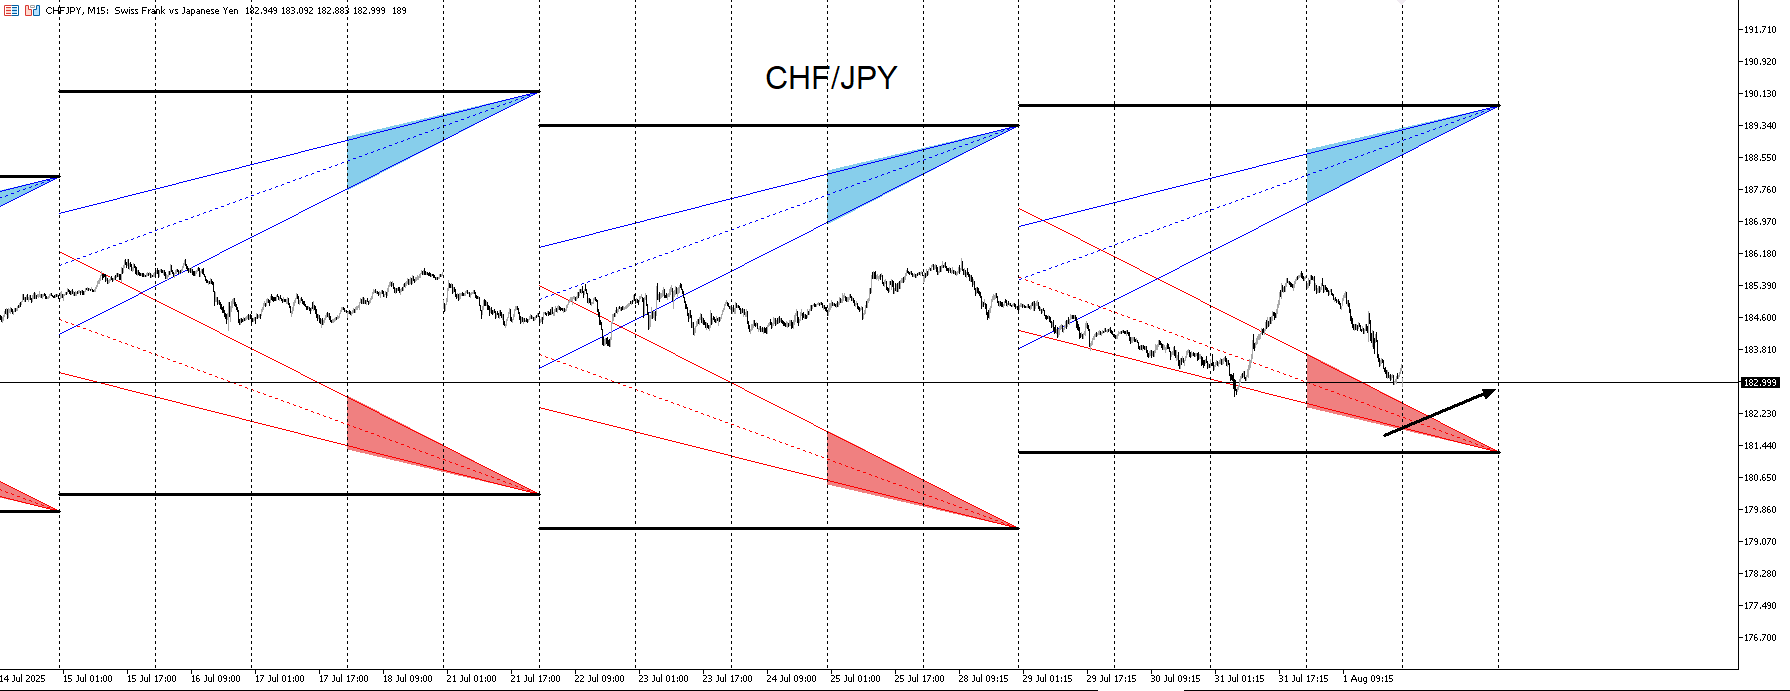
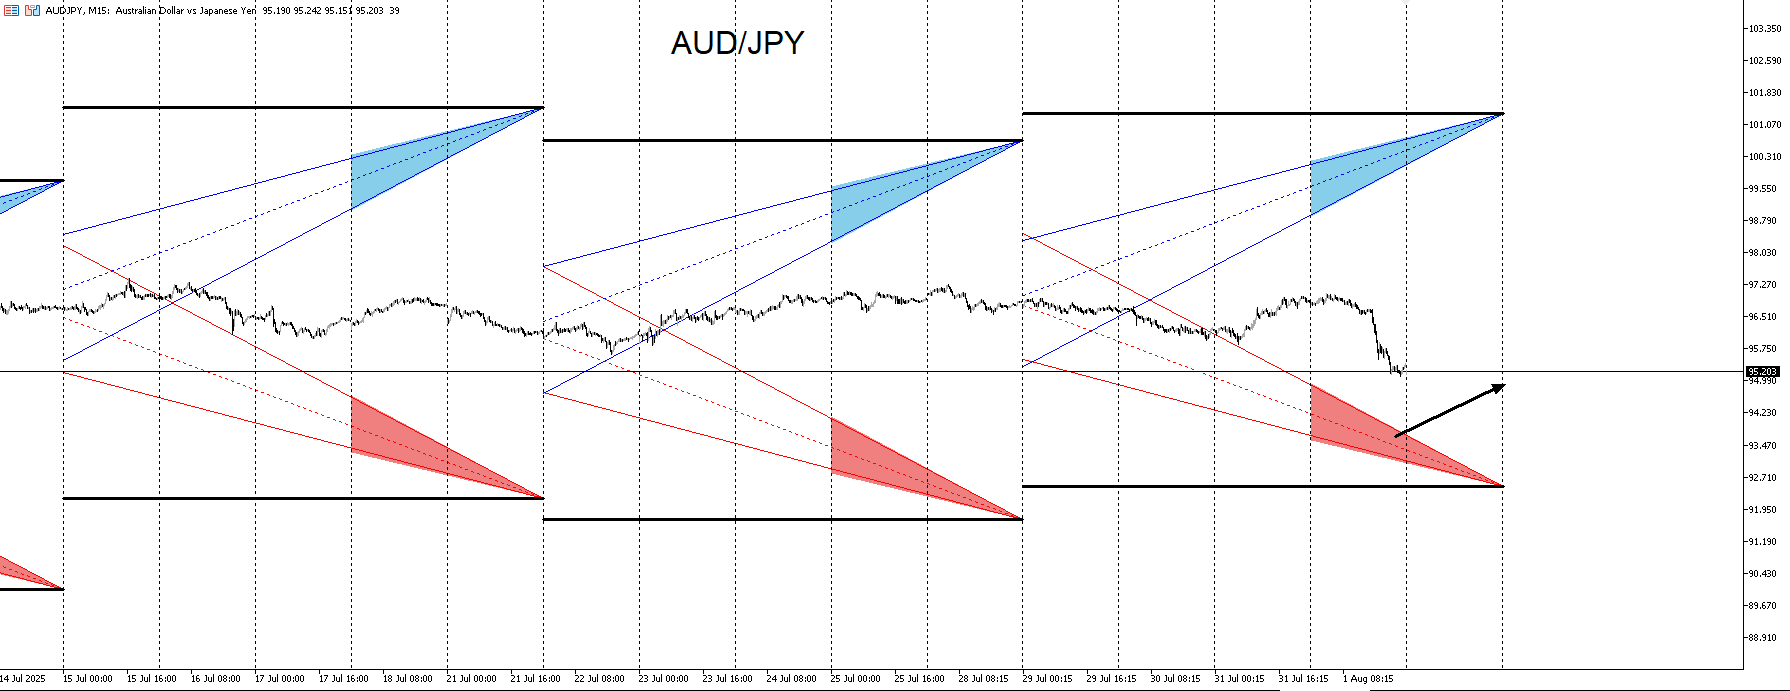
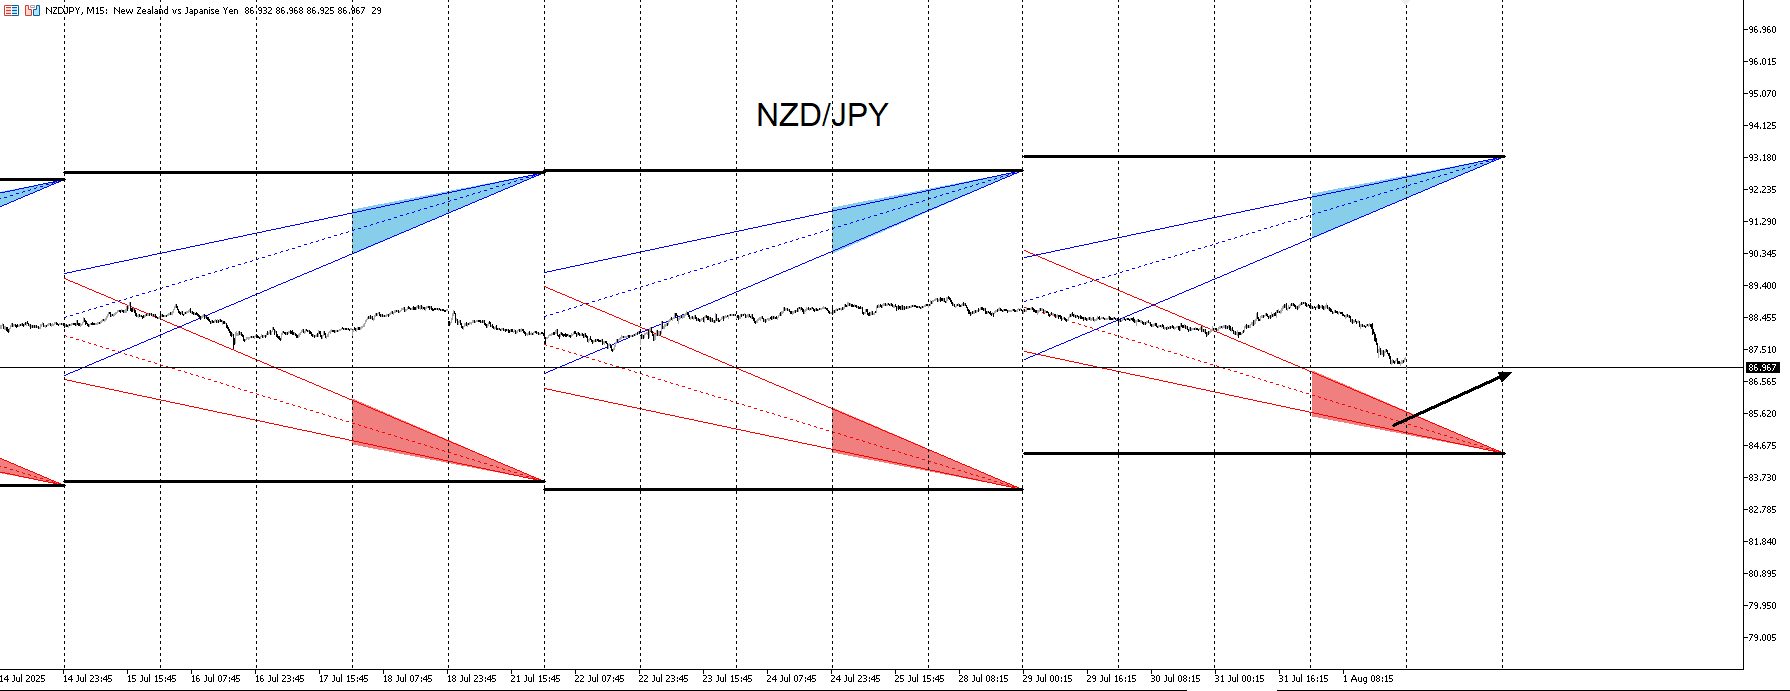
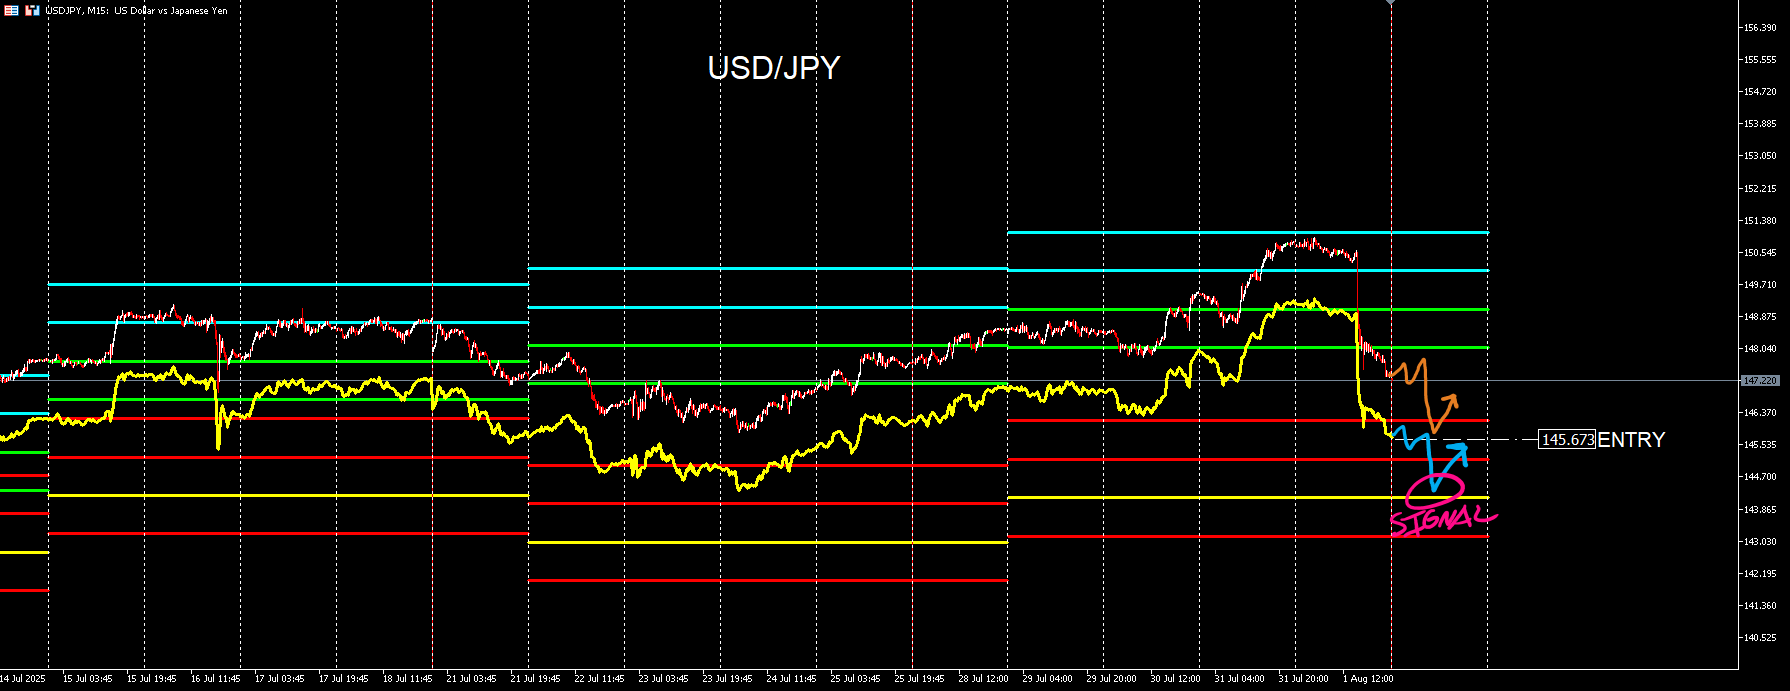
RE: My EA updateposted in General Discussions
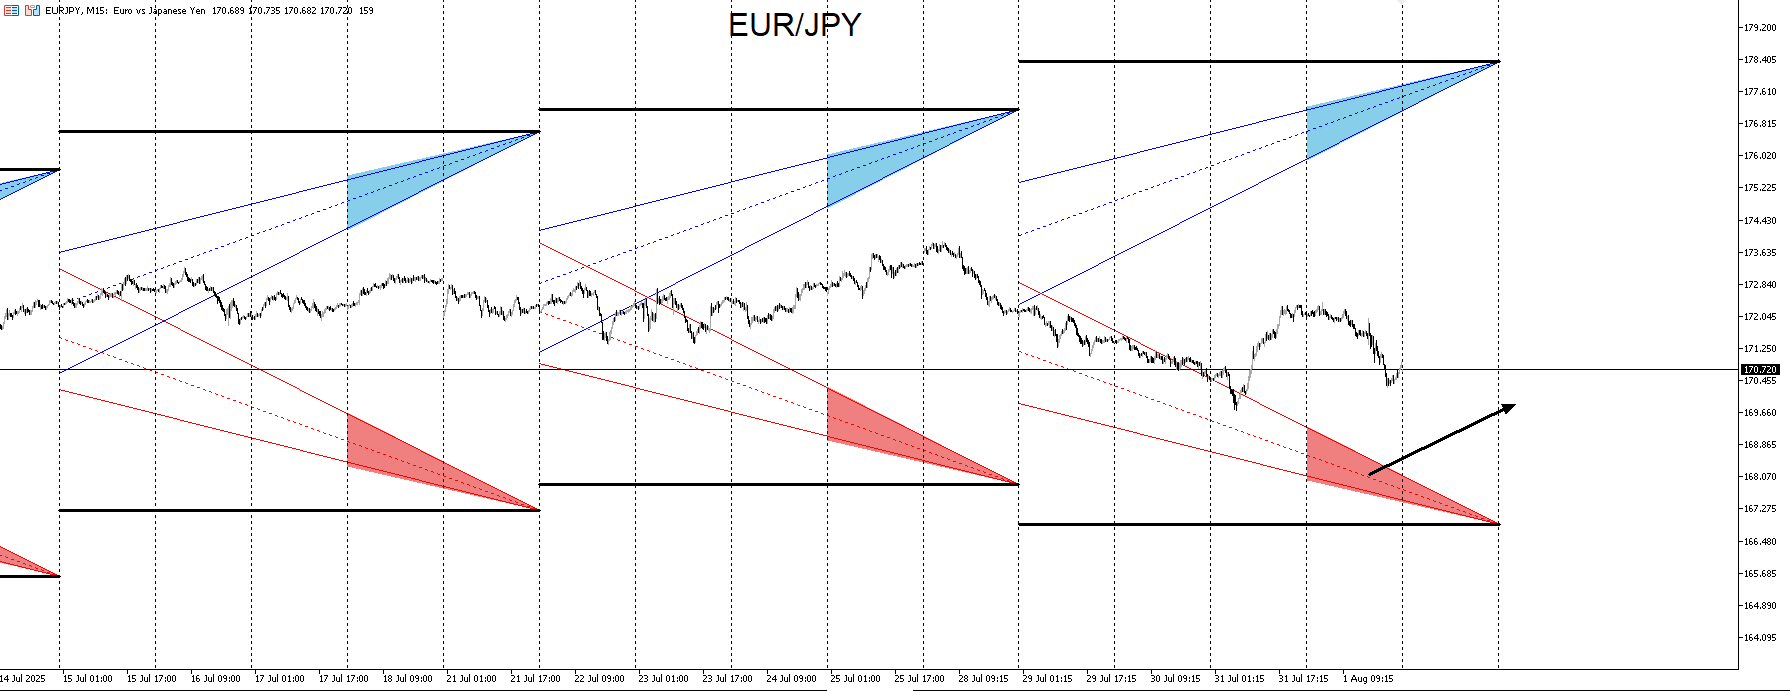
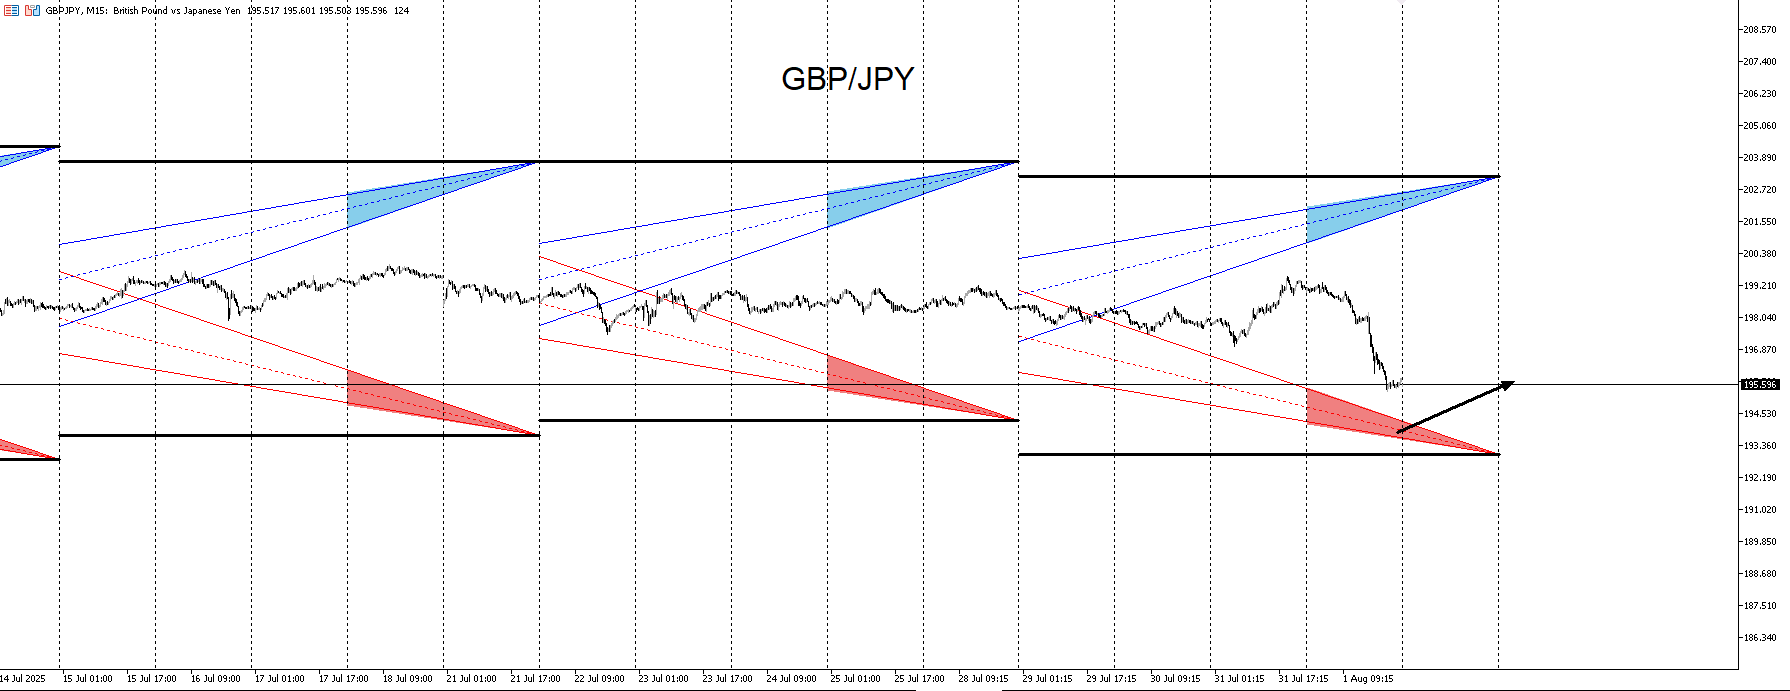
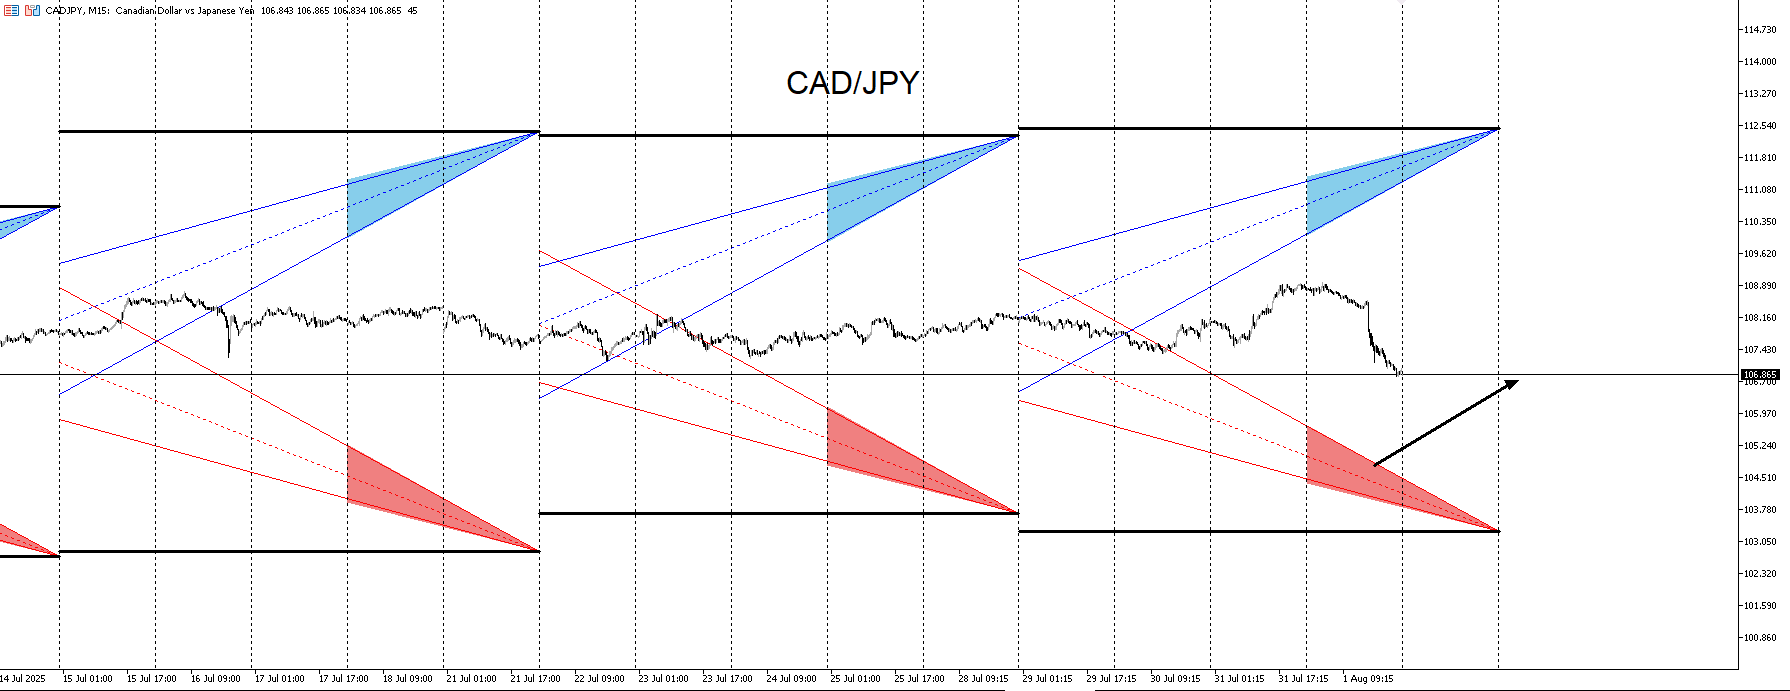
For this coming week I’m getting long signals on the Yen pairs. GBP/USD signaled long too and came just shy of my limit order before pumping up. Knowing that these pairs may continue their uptrends, this is where I want to enter and I’m looking forward to XXX/USD pairs to continue lower and move upwards once the Yen pairs start to consolidate after upward movement. If Yen pairs do continue up, I don’t expect them all to continue up. Maybe a small handful will but I would expect AUD/JPY and NZD/JPY to likely consolidate more and drop lower before continuing up. The USD/JPY chart with the black background is the indicator modified to display it in another template that I use. If I suspect the market will keep trending up, I will want to enter when that yellow tracer contacts the yellow line.