How to draw a line in the past candle.
-
Hi everyone,
Please help,
How to spot particular past candle and then draw a lines at the high and low in that candle.
Condition:
-
Candle ID, ranging from 10 to 100.
-
That candle must have high price that higher than certain market price (e.g the high of the candle must be higher than 1.500)
-
The same candle must also have low price that lower than certain market price (e.g the low of the candle must be lower than 1.450)
Thank you.
Cybust. -
-
Condition block candle high (with ID you want) is above x.xx, connected to a condition block (with the same ID) candle low is below x.xx, probably want to use ID1 so it is constantly checking the last closed candle.
-
@jstap Thx for your response.
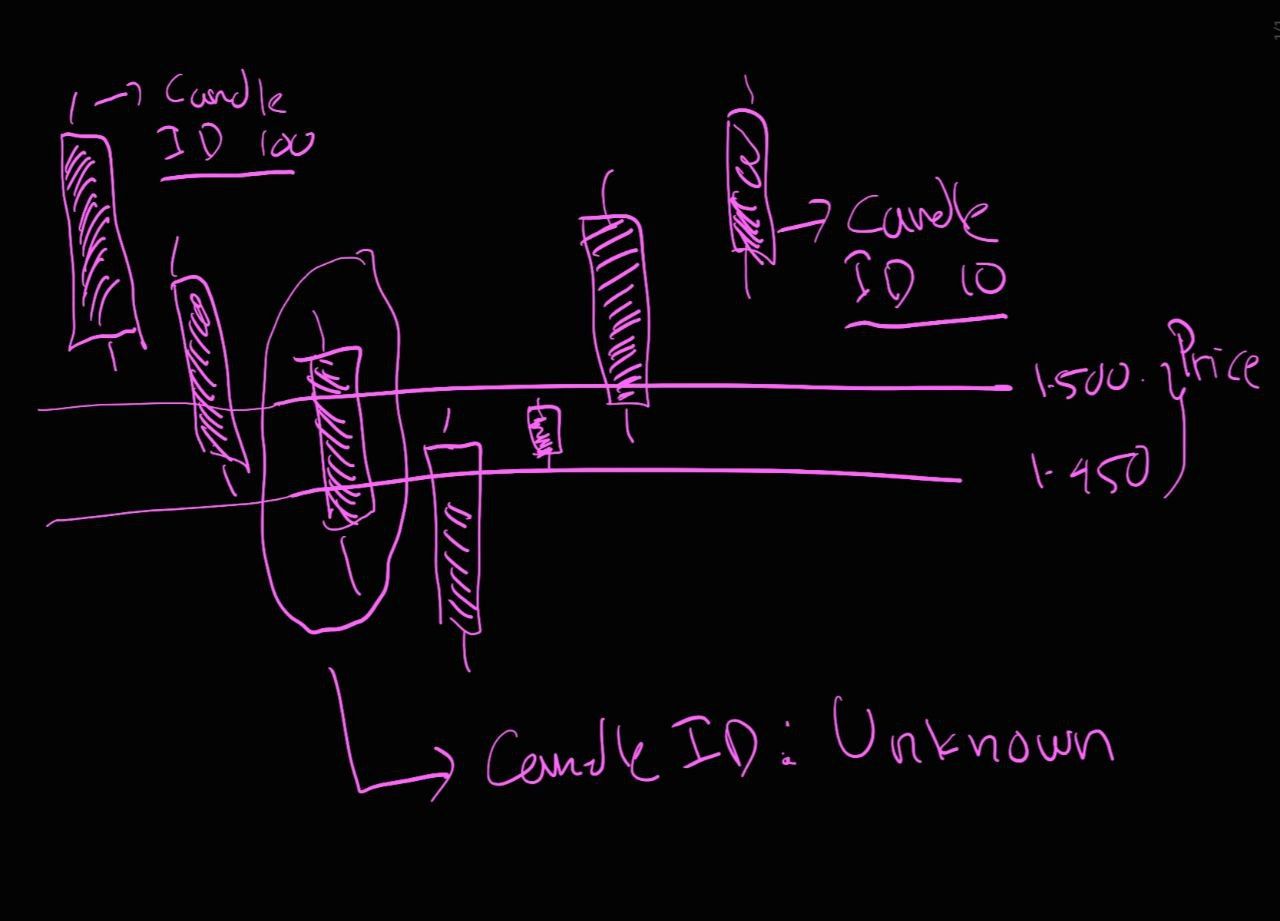
I don't know the exact candle id, i only know that the candle is somewhere between candle id 10 and candle id 100.
How to spot the exact 1 candle?
Image attached.
Thx.
-
You need to know the exact reason for why that candle is selected. is it the highest/lowest price?
-
@jstap Yes you're right, its the highest / lowest.
To be selected, the candle's high must be higher than 1.500, and the low must be lower than 1.450.
What block should I use to spot that specific candle?
thx.
-
Market property's highest/lowest price over x candles will give you the value, ID, price, or time, you can get this in most blocks.
-
@Cybust
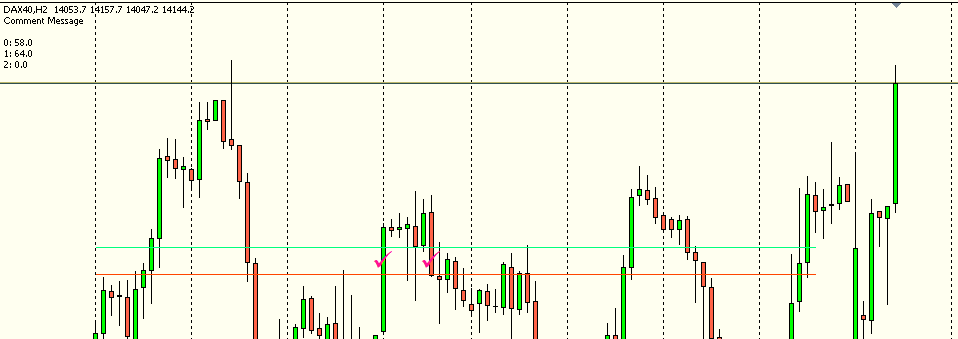
Interesting thought, I quickly put something together for you, take the DAX 40 from 2023 with this setting, that should work, what do you do with it, what is the strategyhttps://fxdreema.com/shared/OWJt2e11e
-
@jstap noted, thank you.
-
@RGoo wow amazing, thank you for your help, I'm studying your blocks right now.
Basically, the strategy is to find confluence area in the past data based on current market price. The high and low of that 1 big candle is used as key area for making either to buy or to sell decisions.
