Custom Indicator - double count at change
-
Hi,
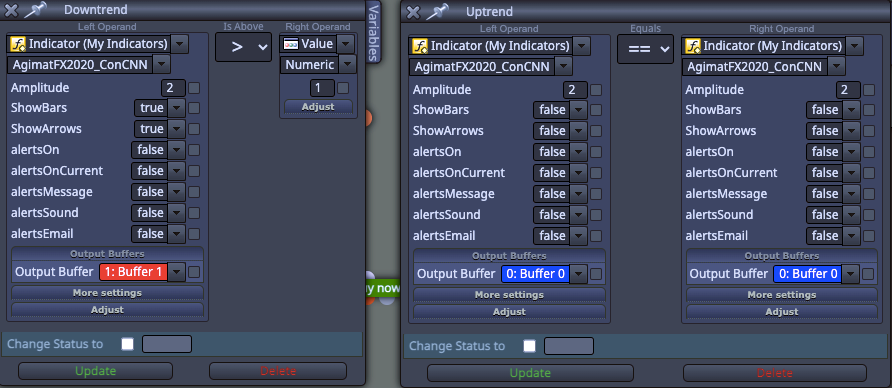
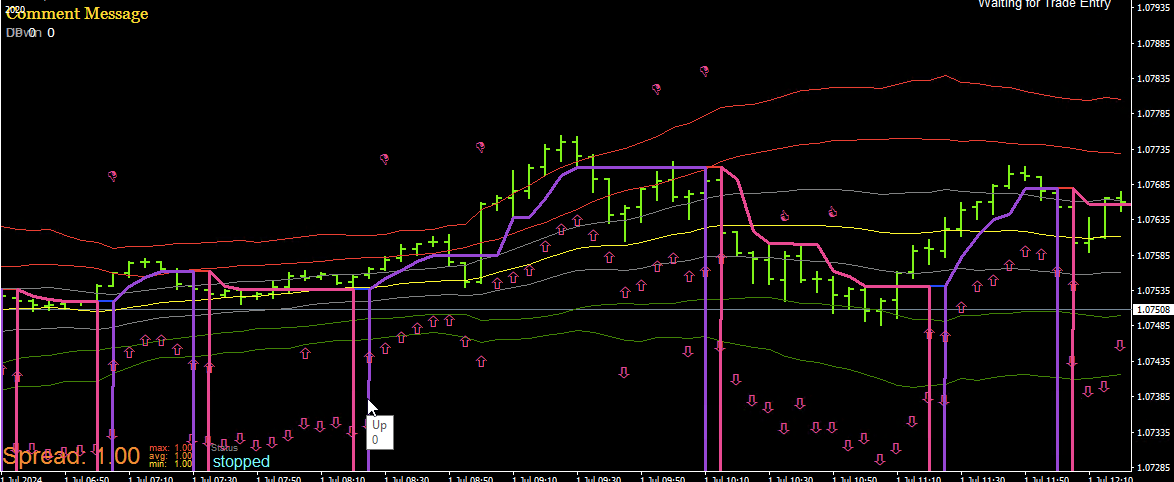
I started to play with fxDreema and want to test a simple strategy. It uses a kind of super trend as a custom indicator. The colour changes with buffer 0 and buffer 1.
If I display the values both values get fired at the first time the trend changes.

I tested 2 ways both give the same results:
Any idea?
Thanks -
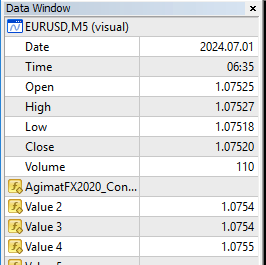
What value gets returned from the indicator buffer? Put into a comment to see what value you are working with, as for buffer 0 it will always ==, what are you expecting this to tell you?
-
Thanks for your reply.
the system is pretty easy. I have a band and a trend indicator. The trend indicator just changes the color red (buffer 1) to blue (buffer 2).
I made both now > value 0.1 since it uses price +- a few pips I think.
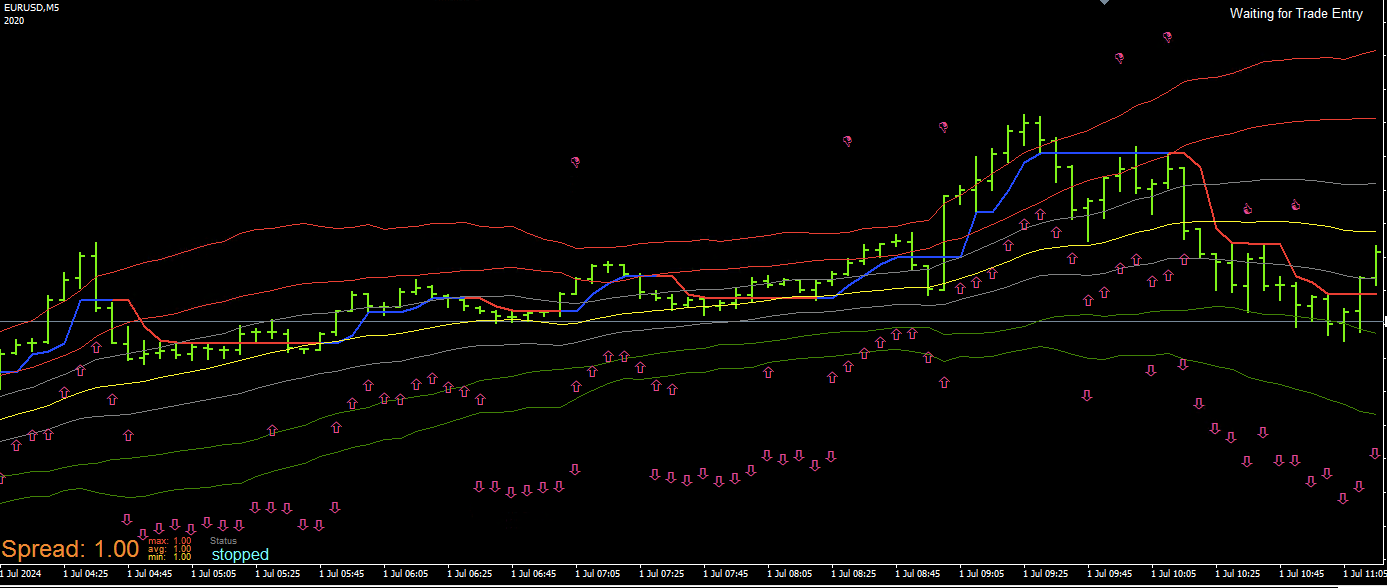
It's not perfect that I have the double but it should work nevertheless since the idea is it needs to be overbought/oversold first.
As soon as the price hits the red or green band. Indicated with the thumb up and thumb down
So far I'm using this blocks:
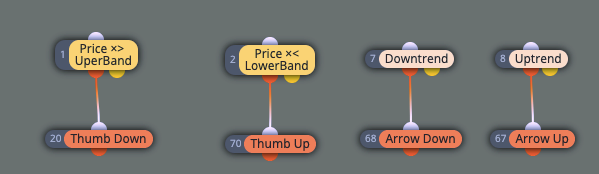
So my next "challenge" will be when I have a thumb down wait for the arrow down
")
-
Ok but what values are returned for you to calculate when it has changed?
-
Blue Line (up[]):
Purpose: Represents an uptrend. When the market is in an uptrend, the blue line is displayed.
Calculation:
The up[] value is set when the market switches from a downtrend to an uptrend.
It uses the maxlowprice, which is the maximum low price of the last few bars.
If the market was in a downtrend and switches to an uptrend, the blue line is adjusted to reflect the maximum low price from previous bars.
The blue line value is further adjusted with ATR to calculate atrlo[] and atrhi[]. -
// Indicator settings
#property indicator_chart_window
#property indicator_buffers 1
#property indicator_color1 Blue // up[]
#property indicator_width1 2// External parameters
extern int Amplitude = 2;// Indicator buffers
double up[];//+------------------------------------------------------------------+
//| Custom indicator initialization function |
//+------------------------------------------------------------------+
int init()
{
IndicatorBuffers(1); // We are only using one buffer for the blue lineSetIndexBuffer(0, up); // Assign the buffer for the blue line
SetIndexStyle(0, DRAW_LINE); // Draw it as a lineSetIndexEmptyValue(0, 0.0); // Set empty value for the buffer
return(0);
}
//+------------------------------------------------------------------+
//| Custom indicator iteration function |
//+------------------------------------------------------------------+
int start()
{
double atr;
double lowprice_i, highprice_i;
double lowma, highma;
double maxlowprice;
bool nexttrend = 0;int counted_bars = IndicatorCounted();
if(counted_bars < 0) return(-1);
if(counted_bars > 0) counted_bars--;int limit = MathMin(Bars - counted_bars, Bars - 1);
// Loop through each bar
for(int i = Bars - 1; i >= 0; i--)
{
// Get the lowest price and highest price over the amplitude range
lowprice_i = iLow(Symbol(), Period(), iLowest(Symbol(), Period(), MODE_LOW, Amplitude, i));
highprice_i = iHigh(Symbol(), Period(), iHighest(Symbol(), Period(), MODE_HIGH, Amplitude, i));// Calculate moving averages for low and high prices lowma = NormalizeDouble(iMA(NULL, 0, Amplitude, 0, MODE_SMA, PRICE_LOW, i), Digits()); highma = NormalizeDouble(iMA(NULL, 0, Amplitude, 0, MODE_SMA, PRICE_HIGH, i), Digits()); // Calculate ATR atr = iATR(Symbol(), 0, 100, i) / 2; // Initialize maxlowprice if(i == Bars - 1) maxlowprice = lowprice_i; // Check if the trend is up if(nexttrend == 1) { maxlowprice = MathMax(lowprice_i, maxlowprice); if(highma < maxlowprice && Close[i] < Low[i + 1]) { nexttrend = 0; } } else { maxlowprice = MathMax(lowprice_i, maxlowprice); if(lowma > highprice_i && Close[i] > High[i + 1]) { nexttrend = 1; } } // Set the blue line values if in an uptrend if(nexttrend == 0) { if(i < Bars - 1 && up[i + 1] != 0.0) { up[i] = MathMax(maxlowprice, up[i + 1]); } else { up[i] = maxlowprice; } } else { up[i] = 0.0; } }return(0);
} -
That is not what I meant, I mean what value is in the buffer, likely indicator appears and is visible will work for you.
-
Seems that it always has a 0 the first time the trend changes
-
If you move the arrow to the line as it's going up or across what value does it have?
-
the same values as in my second post.
The lowprice x candles away...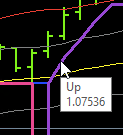
-
In that case, once per bar - condition buffer == 0 - buy/sell, maybe add a condition so candle id 1 or 2 opposite buffer is != to 0, some combination of this should create a signal.
-
@Domeonline
Indicators using start() are often not working well in EA. start() is quite old and rewrite the code with onCalculate() can help -
Please look at those few cases when there are two objects indicating both trends were detected. They happen exactly when trend is changing. I'm afraid your indicator is repainting in those circumstances. Are you ready to live with that?
-
It is not repainting until it recalculates and finds a change, so when both buffers are 0 it is changing direction, meaning previous candle two has a value so you know which direction it has changed to.
-
Thanks to all of you. This was very helpful and I learned a lot. I had issues with the way the buffer worked and was able to change the source code to use chart objects instead.
I will probably post a follow-up soon -
You changed the code?
 That means you are far beyond most of the user of this forum, including myself.
 ")
-
You would laugh. But chatGPT did the work perfectly

-
I use chatGPT all the time, if you ask it the right question it can work wonders
-
@Domeonline I see.
