fxDreema

    • Register
    • Login
    • Search
    • Back to the main page
    • Categories
    • Recent
    • Tags
    • Popular
    • Search

    Candle Low between two Vertical Lines

    Questions & Answers
    3
    6
    233
    Loading More Posts
    • Oldest to Newest
    • Newest to Oldest
    • Most Votes
    Reply
    • Reply as topic
    Log in to reply
    This topic has been deleted. Only users with topic management privileges can see it.
    • John Doe
      John Doe last edited by John Doe

      Hi Guys

      How can I place this horizontal line here?

      Please note that the two vertical lines are variable and will be updated as new trends take place.

      Thanks!

      Candle Low.png

      1 Reply Last reply Reply Quote 0
      • jstap
        jstap last edited by

        Need more information, an orange draw line will draw.

        Learn fxDreema Without the Wait!

        My comprehensive book, available on Amazon, is packed with examples and invaluable insights to help you fast-track your learning journey.

        The paperback and hardback editions include MT4 & MT5 QR codes for easy access to all prebuilt projects and robots, including my latest gold trading robot!

        Don’t miss out

        Click here➡️ https://mybook.to/fxDreema to get your copy today!

        Enjoy! 😊

        John Doe 1 Reply Last reply Reply Quote 0
        • John Doe
          John Doe @jstap last edited by

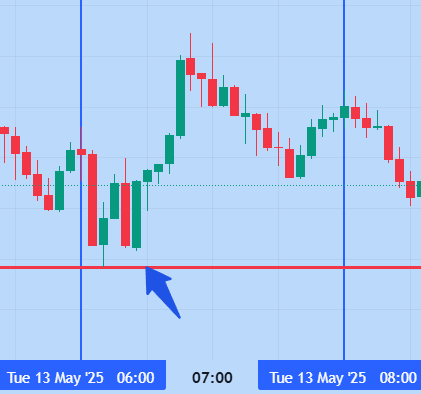
          @jstap On the Chart, the two lines drawn are two vertical lines. I would like to know how to detect the minimum candle low (in between the two vertical lines) and put a horizontal line there. (the blue arrow points towards what I need, the red horizontal line to be drawn)

          1 Reply Last reply Reply Quote 0
          • S
            sktsec last edited by

            Identify the candle ID of the 2 vertical lines first, then get the value max / min, and draw the line

            John Doe 1 Reply Last reply Reply Quote 0
            • John Doe
              John Doe @sktsec last edited by

              @sktsec ok, I do understand the logic but how do you actually do it in terms of placing blocks and the relevant settings please?

              Do pardon my lack of knowledge, I have spent a long time trying to work it out.

              1 Reply Last reply Reply Quote 0
              • S
                sktsec last edited by

                To find the candle ID, try
                For each object (select vertical line) --> Modify variable (select Object on Chart, enter Name of Object)

                To find the min / max,
                Modify variable (select Market Property, Lowest/Highest Price (CandlePeriod))

                When you get the price level, you can draw the horizontal line

                1 Reply Last reply Reply Quote 0
                • 1 / 1
                • First post
                  Last post

                Online Users

                A
                A
                E
                B
                M
                J
                B
                E
                R

                24
                Online

                146.7k
                Users

                22.4k
                Topics

                122.6k
                Posts

                Powered by NodeBB Forums | Contributors