How to Find PEAK Highs and PEAK Lows
-
Hi guys! as the Title Says. I want to find the PEAK Highs and Lows as the market structure defined by Candle Range.
I cannot use the market properties highest and lowest functions since it will only get the highest and lowest from a candle period, basically what will it do is to find the highest and lowest from the candle bars like find the highest of 20 bars so it can be the candle 1 is the highest or any candle.
What I want is to find the Middle Candle and the will be the Highest/Lowest Candle.
Example my candle period is 20,
so it will be 20+1(for middle candle)now the highest candle should be candle 21 so it the 20 candles to the left and to the right will be lower than the high of candle 21.
and that will be my high 1same as for lows.
hope you can help me with this guys!
Thanks in Advance!
-
So if I understand it correctly you need this:
Step 1. Find the highest high from candle 1 to 20 in the past.
Step 2. One you find it (let's imagine it was cabdle 8), check if all previous 20 candles from candle 8 meet the condition and same with the 7 on the right.
Step 3. If that is not true, search for a new candle until both sides cinditions are met.Is that correct?
-
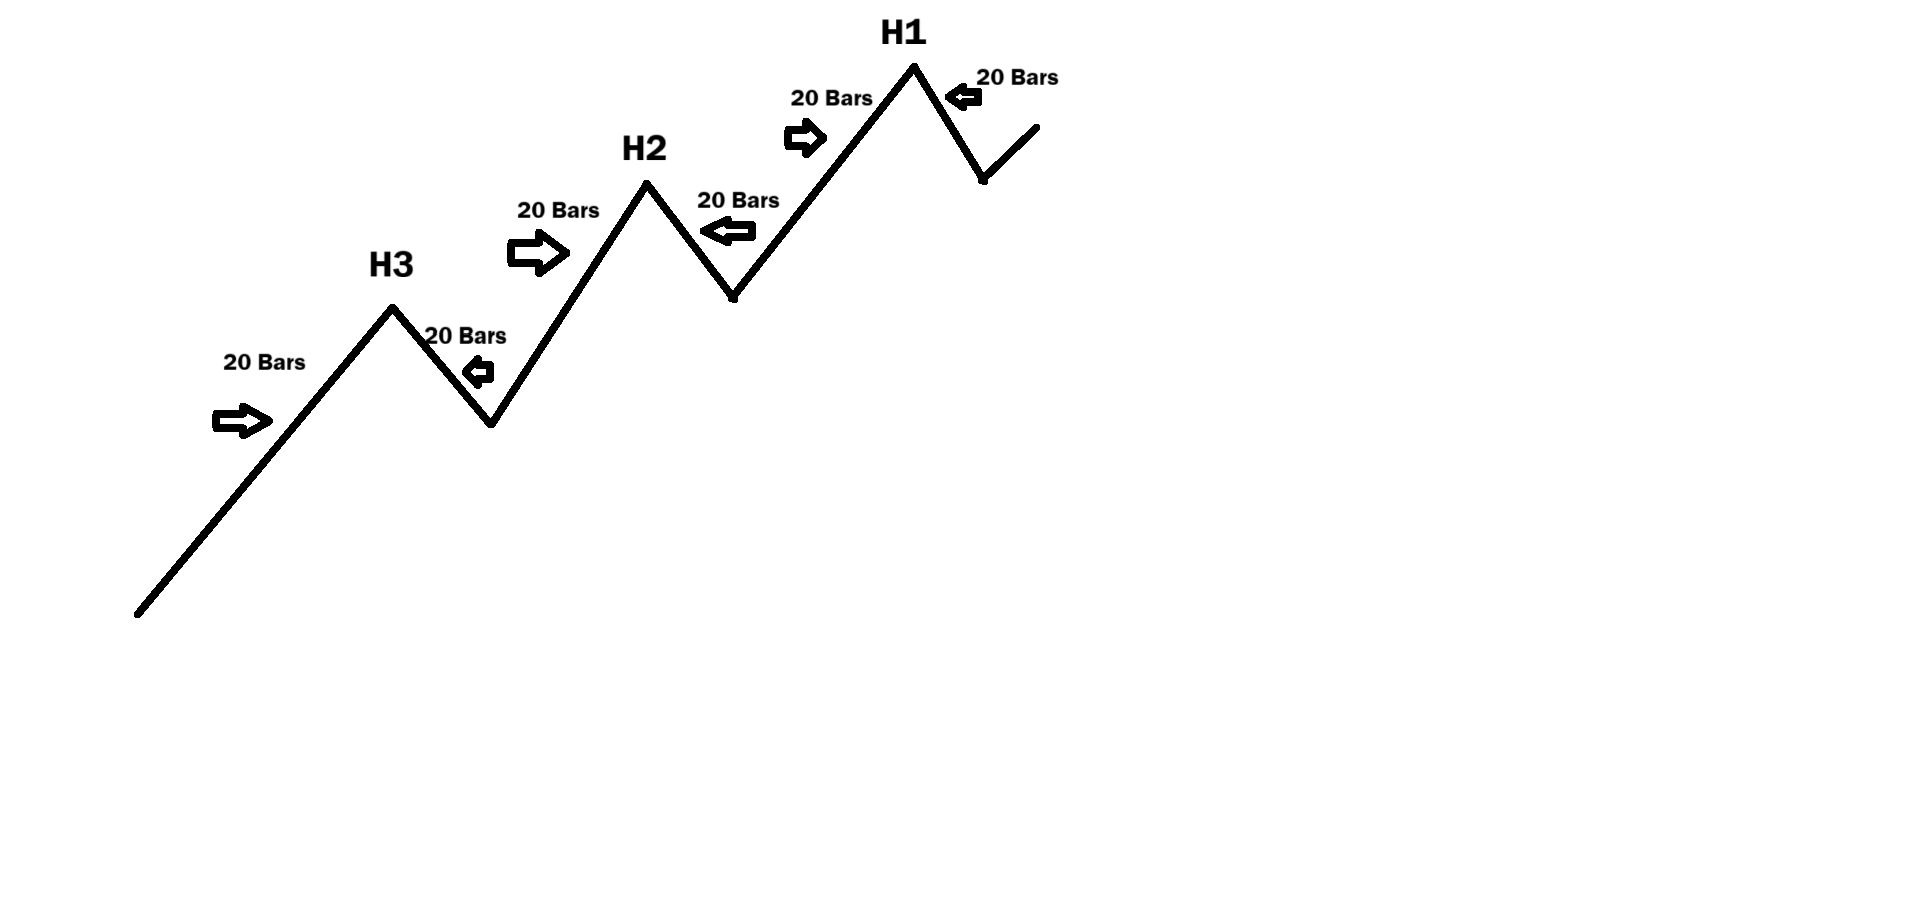
@l-andorrà yes sir, so to put it simply, then highest candlen should have equal candle bars from right and left.
so for a candle to be the highest one, it should have 20 lower candle bars on both sides
-
@l-andorrà Just like this Sir.
-
how to make
-
UP! @l-andorrà @jstap
-
this is not simple, you need a set reason to class a new high low, the ZigZag for example does this, but as with most indicators it is lagging, in various signals there is new top/bottom inn trend, test these and see if they are any good to you.