@cesar_defez
Solved.
The problem was solved by adding the condition to set the variables to zero.
I upload the project in case you are interested.
shared/J7qxLglUc
Thank you
@cesar_defez
Solved.
The problem was solved by adding the condition to set the variables to zero.
I upload the project in case you are interested.
shared/J7qxLglUc
Thank you
@l-andorrà Yeah that's right.
I want to see lots open for buy and lots open for sale
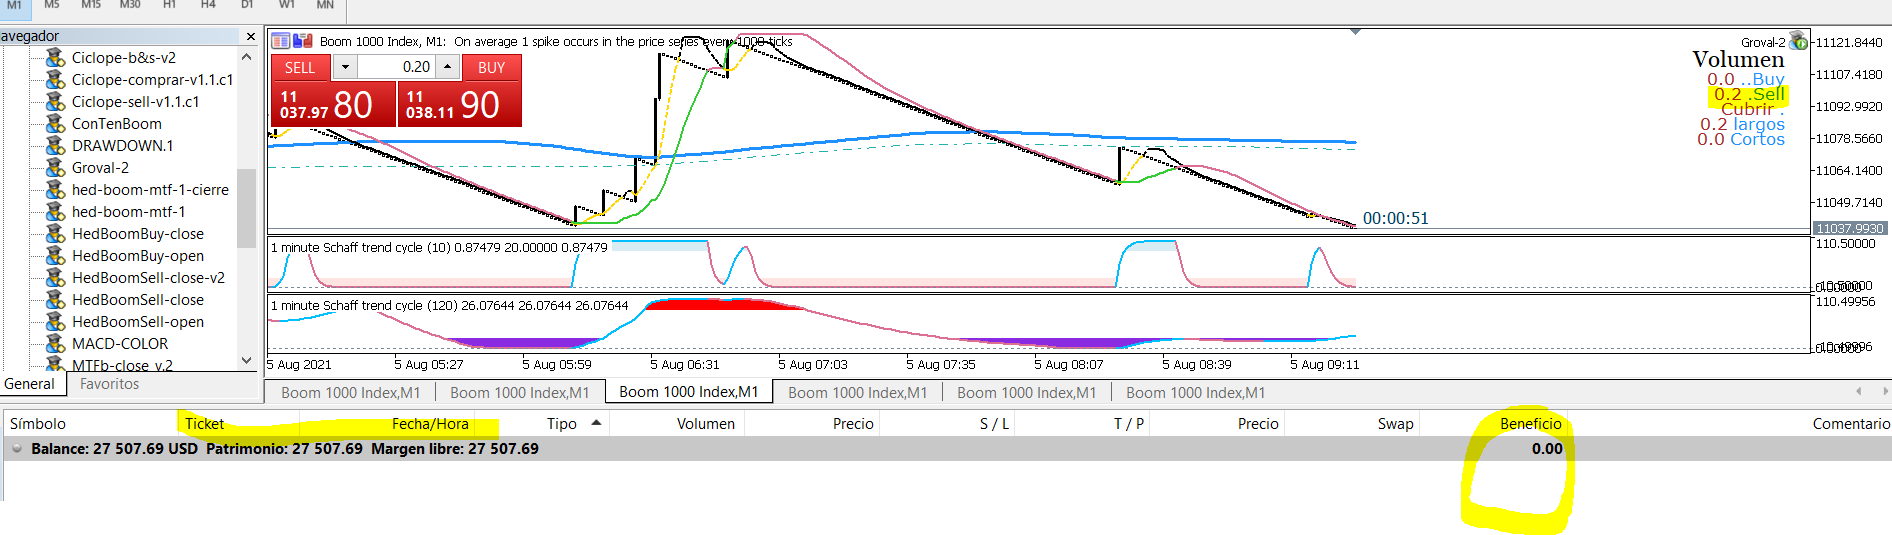
Hello. Well that.
I try to make a comment that indicates the lots that I have in long and short.
As lots are added, it takes it into account, and as I close, when there are no more open lots, I have lots to close.
I attach the project and a screenshot.
I'm going crazy and can't find the error. Can someone help me and correct it.
Thank you
@l-andorrà
Thank you.
I hope someone knows how to answer me.
Thank you
Hello.
I was wondering if an ea can launch a script.
As scripts can be launched by configuring a shortcut, I was wondering if it could be done from fxdreema.
Thank you
Hello. Can someone explain to me how the timeframe option of some boxes works.
example.
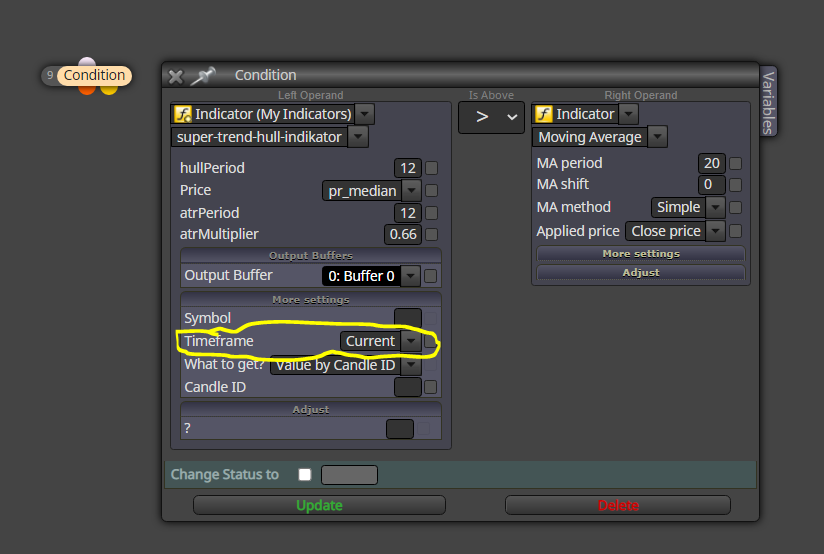
In the condition box we find a timeframe dropdown.
I thought that the EA could be placed in a timeframe of h1, and by configuring this box with timeframe m1, this prompt would take me values of m1. But I must be wrong, because when I do this, the EA doesn't work.
Can someone tell me how it is used and what it is for.
Thank you
Yes, but it is very curious that it only works well on demo accounts.
the same platform, with the EA loaded, I connect a real account, and it does not keep the rounding, I return to the demo account, and it is corrected. same asset, same bloker, same platform, same EA.
¿¿¿¿¿
curious
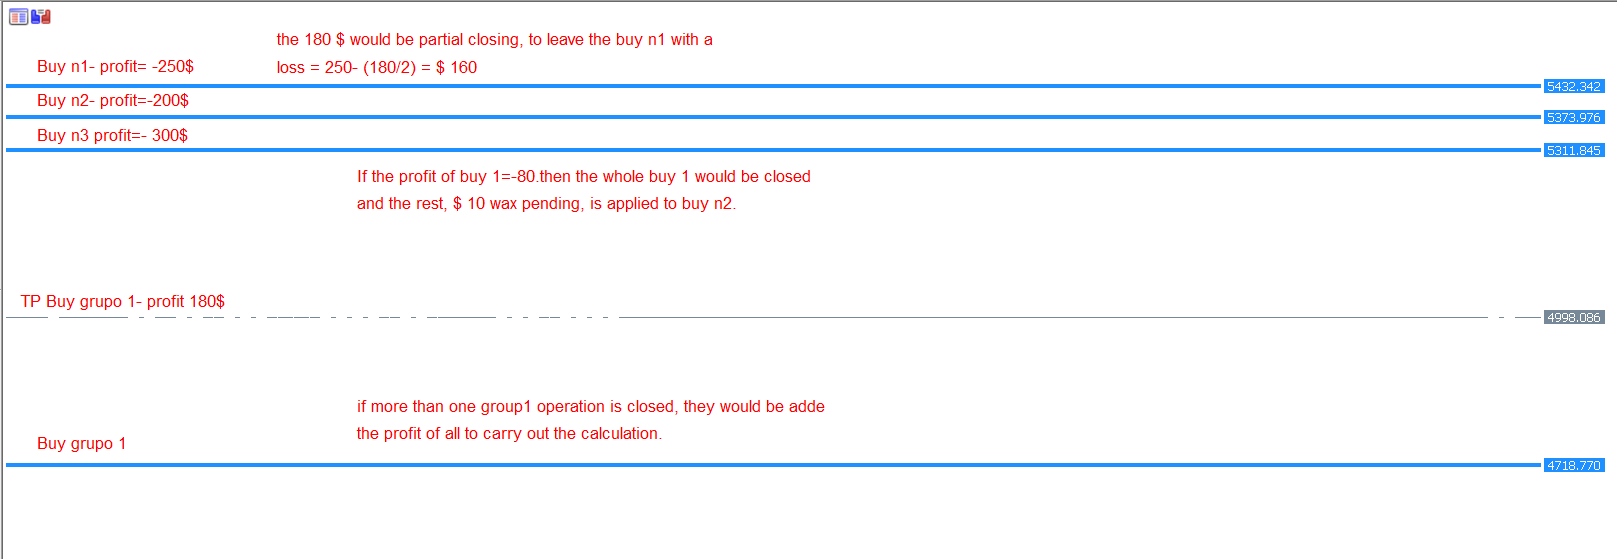
Hello, I need help to make an EA, to manage losses.
the idea to manage these losses are:
When I put a buy operation to cover I organize it by group .. (group1).
If the operation to hedge is a sale, it will be group 2.
When I close a group 1 trade, I determine the profit from that trade (or deals).
and I dedicate 50% of the profit to carry out a partial closing of buy-in-losses.
In addition, it will close from where the opening price is farthest from the current price.
same in shorts.
I close group 2, I determine profits and 50% of the profits I use to close the equivalent of lot sell.
example-
I close group 1 with $ 100
$ 50 will be of benefit, and $ 50 to assume closing losses in long trades.
it may be the case that more than one operation of group # is closed. and evidently there are group # operations previously closed, which do not have to be taken into account at this time (as they were already calculated at the time of closing).
I leave you a sketch to illustrate the situation.
If anyone is interested in helping me, we can share ideas.
Thank you so much
Hello. The rounding thing works when he wants and how he wants. it already has me desperate.
the same EA, (which I leave you in the link), on two different platforms, from the bloker ism, gives me different results.
in one it works perfectly. (demo account).
in another it works badly. (real account).
I share the project, and a screenshot of the two results.
If someone can explain why this happens, I would greatly appreciate it.
link : https://fxdreema.com/shared/fzbSfsvVc
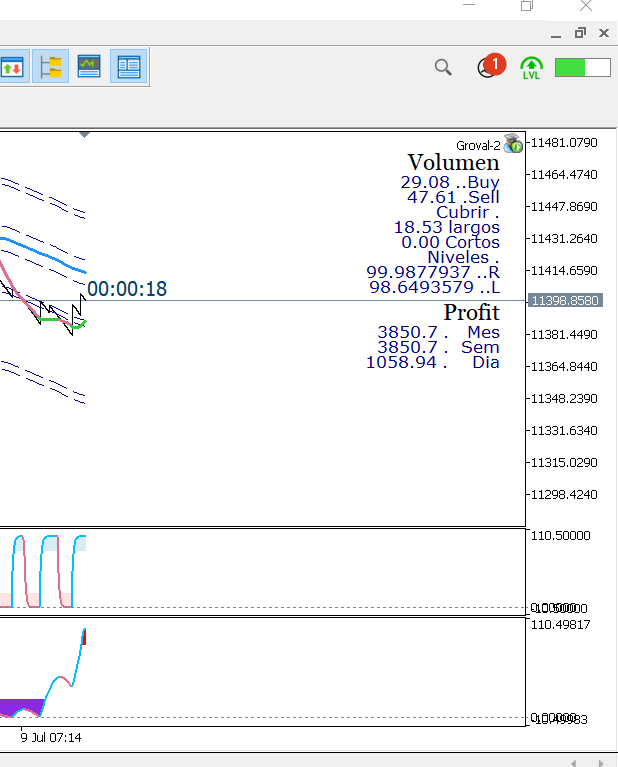
Hello.
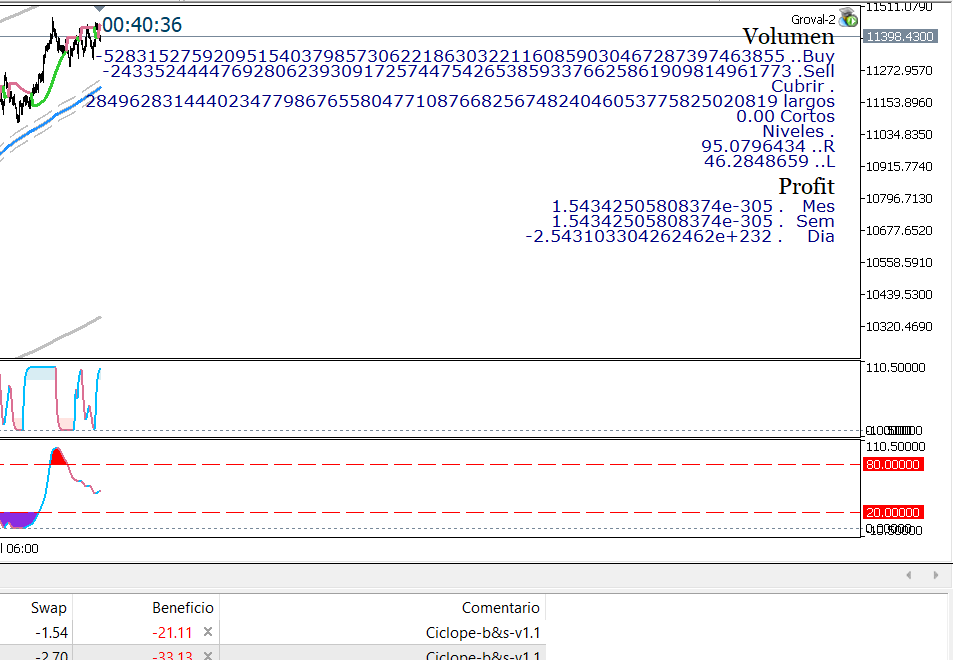
I want to show the gains or losses that are obtained.
earnings day
profit of the week
profit of the month
I only get to have the day gain.
the weekly and monthly, it is not possible for me to coincide with the history of mt4.
I leave you the link of what I am trying.
if someone can explain how to get it.
Thank you
lo utilicé en ajuste, =DoubleMathRound(variable,digitos decimales)
pero no funciona, al menos ahi, o con ese formato.
it is possible to use this mt5 function in fxdreeam
Thank you
it does not work, I have tried the two formulas:
NormalicezeDouble (variable, 2)
DoubleToString (variable, 2)
I have also tried with = sign in front
= NormalicezeDouble (variable, 2)
= DoubleToString (variable, 2)
and it works randomly, sometimes yes, sometimes not, sometimes it respects the n of decimals, others not, and others it puts it in scientific format
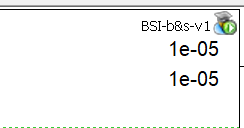
Hello how can I avoid the exponential format,
I want to get a value with 6 decimal digits.
I attach an image of the confguration and the result, which is sometimes correct and another gives me an exponential format.
setting
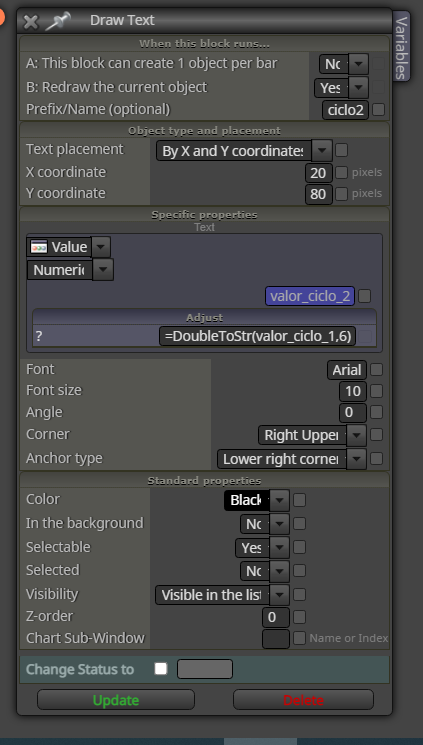
Outcome
@vonmunchy Thanks,
Indeed, a buffer 2 appears, which changes from 1 to 2, depending on the color of the indicator.
Thank you so much
@vonmunchy
Thank you very much vonmunchy.
Indeed this is too complex for me.
I give you an attachment to share the indicator.
Could you please look at it, and tell me step by step how to solve it.
https://drive.google.com/file/d/1N2KOy4PQUBt1Wj0zuoH8SW9jE1XW8E2v/view?usp=sharing
Thank you
@vonmunchy Hello. thanks for answering.
In the link you give me, I can't find the solution. only speak for mt4.
Let me explain, tracking the buffet is easy on mt4. We imagine an average that changes color, when it increases in value it is blue, and if its value decreases, it is red. This indicator has three buffets:
0- the value of the mean.
1- the value of the mean if it is blue = its values ** increase . and matches buffet 0.
2- the value of the mean if it is red = its values decrease **. and matches buffet 0.
I choose the buffe 1 in the indicator box appears, when I look for an uptrend.
I choose the buffe 2 in the indicator box appears, when I look for a downtrend.
easy.
but in mt5 I only have a buffet:
0 value of the mean, (regardless of what color the mean takes).
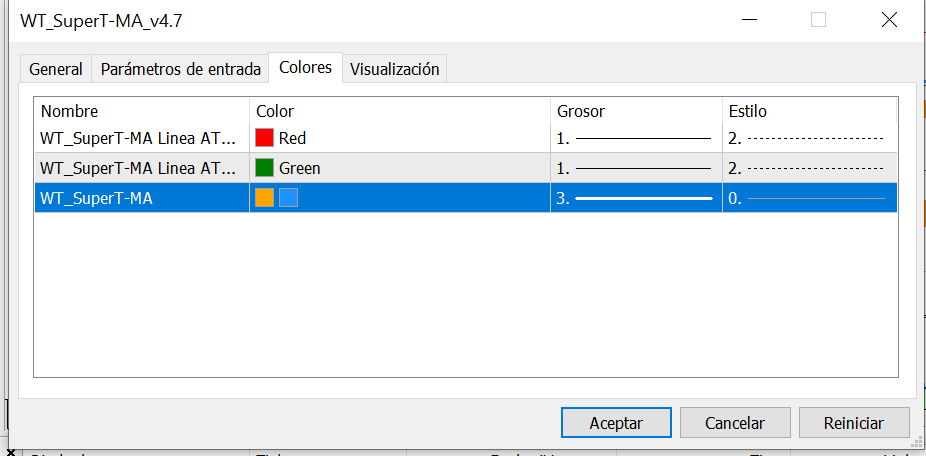
in the example in the image above:
0-upper band
1: lower band
2: Average value. (2 colors are configured, but the output buffet is the same)
I DON'T KNOW HOW TO TRACE IT. with the condition indicator appears, indicator disappears
It is not an insurmountable problem, since we can compare the value of the mean of candle 1, with the value of candle 3.
if (value n) - (value 1)> 0 is bearish,
if (value n) - (value 1) <0 is bullish.
but I put another example of another indicator, an oscillator:
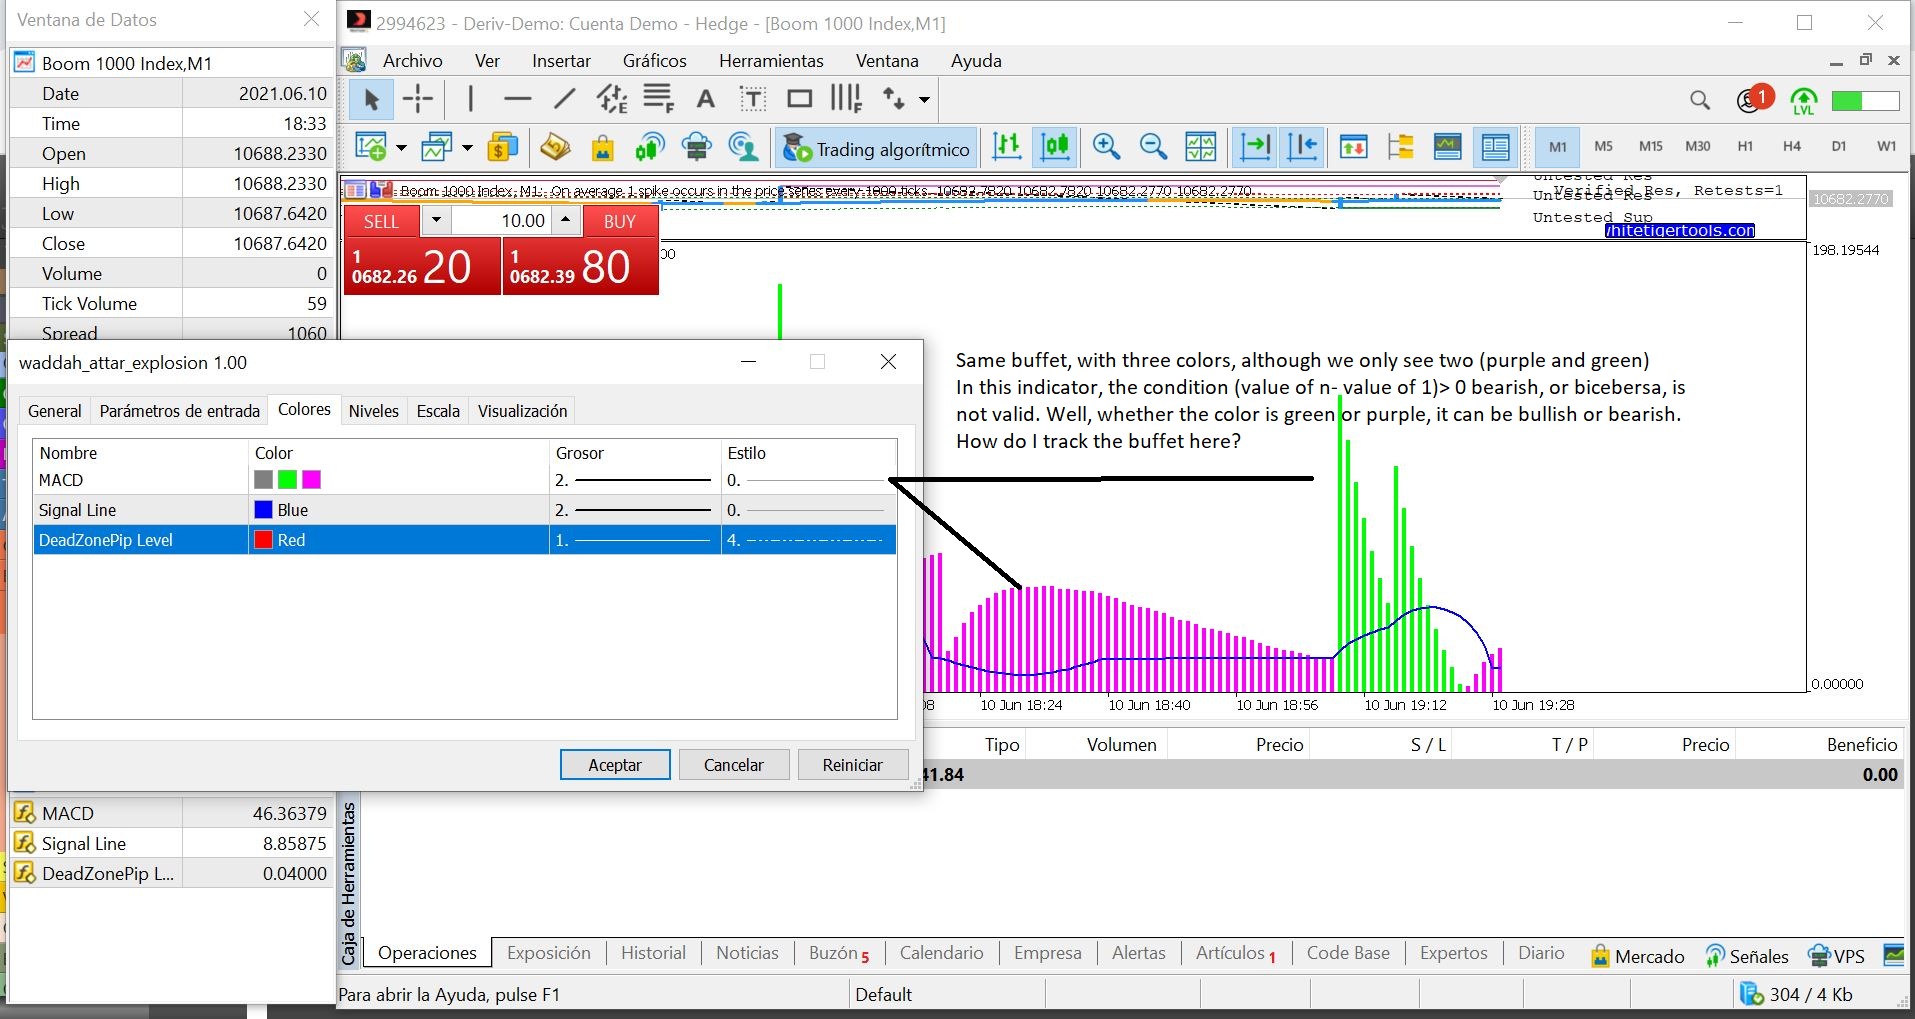
Same buffet, with three colors, although we only see two (purple and green)
In this indicator, the condition (value of n- value of 1)> 0 bearish, or bicebersa, is not valid. Well, whether the color is green or purple, it can be bullish or bearish.
How do I track the buffet here?
Thank you