Thank you for the explanation.
I changed it as well as you said.
But what about my question? Create a button on the chart that immediately closes the SELL trade in progress? I just need that check.
D
Posts made by Denim
-
RE: Button Close SELLposted in Questions & Answers
-
Button Close SELLposted in Questions & Answers
I would like to have on the chart of this EA project a button to interrupt the trade when I see the price moving away from the opening, waiting for the moment when the price gets as close as possible to the opening to have the possibility to close the trade losing as little as possible. One way to manually intervene. I tried various solutions and examples but failed. How can I do? Here's the simple EA I'm testing:
-
RE: Open e Close pending Orderposted in Questions & Answers
@l-andorrà The project is this. Maybe I didn't quite understand how to implement closing an order for minimum loss and how to set the movement of pending orders closer to the current price. Here is the project (if you can call it that..)
-
RE: Open e Close pending Orderposted in Questions & Answers
@l-andorrà Sorry for the constant questions. I tried to apply the suggested filter but evidently I didn't quite understand how to apply it in the scheme to close open or pending operations. I also have another question: pending orders away from the current price. can they progressively "move" closer to the current price to either close or open?
-
RE: Open e Close pending Orderposted in Questions & Answers
Thank you for the explanation! I applied the filter and now it works almost fine. The only thing I still haven't figured out is how to close the order that remains open (if it's not in profit) by 10pm on the same day at the latest. If it doesn't close that one, it doesn't open others.
-
Open e Close pending Orderposted in Questions & Answers
I intend to experiment my first ea with this strategy : Calculate the minimum and maximum from 2.00 to 3:30 am and set two pending buy and sell orders on these two values with the trade closing at 20:00. the stop loss should be 10/15 pips and go to breakeven if the direction is in profit in the opposite direction (in profit). I've now sketched out (with very little FX experience) something like this, but it opens many trades (not just two) and doesn't close at the specified time. moreover, the last trades in the backtest do not close them at all. I am attaching the code diagram. I would also like to implement a trailing for profitable positions and the consequent breakeven for the opposite position. If anyone could help me figure out the steps, the functions to insert, and what's missing in the logic I'd be grateful.
shared/pHuPOi6Lb
-
RE: "Right Price" Targetposted in Questions & Answers
@Alan-paredes2 I understand. I tried to reproduce this bot because it allows me to make one or two trades a day. Not having much time to devote to trading, I have an indicator that works like this, which constantly points to the distance from the MA and when the price goes over and over in both directions it gives me a signal. I wanted to automate it because in the backtests the results were minimal but progressive. That was enough for me. I haven't found any robots that open one or two daily trades around. I was wondering if it was that hard to at least create the base like I described it, and then work on top of it to add endings and stuff. I understand that I would have to study all the FX voices and figure out how each one works to make that happen, but it would take me too much time. having at least the basis and seeing why it works this way would help.
-
RE: "Right Price" Targetposted in Questions & Answers
I have seen the suggested videos, but I didn't find how I can fix the EA which I did. Does anyone have any practical suggestions or explanations on how this can be done? It should open positions when it breaches and re-enters the low or high line and aim for the magenta EMA as the TP. But I just can't. If anyone can help me I would be grateful. Thank you
-
RE: "Right Price" Targetposted in Questions & Answers
since I've been experimenting for a few days, I submit to you the small (unprofitable) and much simpler project that I've started to do that I was talking about which I can't quite understand how it works. Why do the lines of the maximum or minimum and also of the MA150 remain stationary as soon as the negotiation opens? Where am I wrong? Thanks for the help.
shared/QYsxduC8
-
RE: "Right Price" Targetposted in Questions & Answers
Okay. thanks for the tips. I'm really new to FX, and I've tried those simple strategies by copying from some Youtube videos, but what I still haven't learned how to do and haven't found any tips, is how to make the Takeprofit be the achievement of a line like the MA. Furthermore, again to test and understand how it works, I didn't understand how to set the lines of the maximum and minimum of the 24h and 48h and make sure that once they have been crossed and returned, I can issue an order. as I said, I understand that it is not a working strategy, but I don't know which strategy I could bet on to try to develop it with tests. I had asked on another forum what could be one of the best strategies that would allow me to make one or two daily trades (having little time to devote to checking charts and transactions) even of a few pips, but I didn't find any specific advice. If anyone has suggestions, I'm happy to hear.
-
RE: "Right Price" Targetposted in Questions & Answers
Basically the above indicator has a central MA150 (yellow) 48h and 72h min and max price lines and what the EA is supposed to do is open Buy or Sell positions when the price goes below or above the 48h min or max price and falls. The target is the yellow line. Is it easy to build?
-
RE: "Right Price" Targetposted in Questions & Answers
@CPxiom
Is there already an EA based on an ADR indicator?
Or could you at least build the indicator and then build a strategy around it with FX? -
RE: Bollinger band signal &cross profitposted in Questions & Answers
@jstap
Okay. I understand what you mean. I wish there was the possibility of doing even one operation a day or almost every day that brings 20-30 pips that had statistically high probabilities (certainly not sure) of being successful. Understanding which strategy and how to build an EA (if it doesn't already exist) is more suitable for this type of operation would already be a good start. -
RE: Bollinger band signal &cross profitposted in Questions & Answers
@jstap Thank you very much. I weighed this very simple indicator because I don't have much time to devote to continuous monitoring during the day, I was looking for something that, even if with small pips, could bring a "small" income from a small account at the end of the month. I don't expect any EA to bring me $1000 a month, but I was looking for something I could practice with faster and that was statistically profitable. I know we're all looking for something like this, but if you could give me some advice on which strategy to start using that I can refine and if there's already an EA that does this, I could study it better and I'd be very happy already.
-
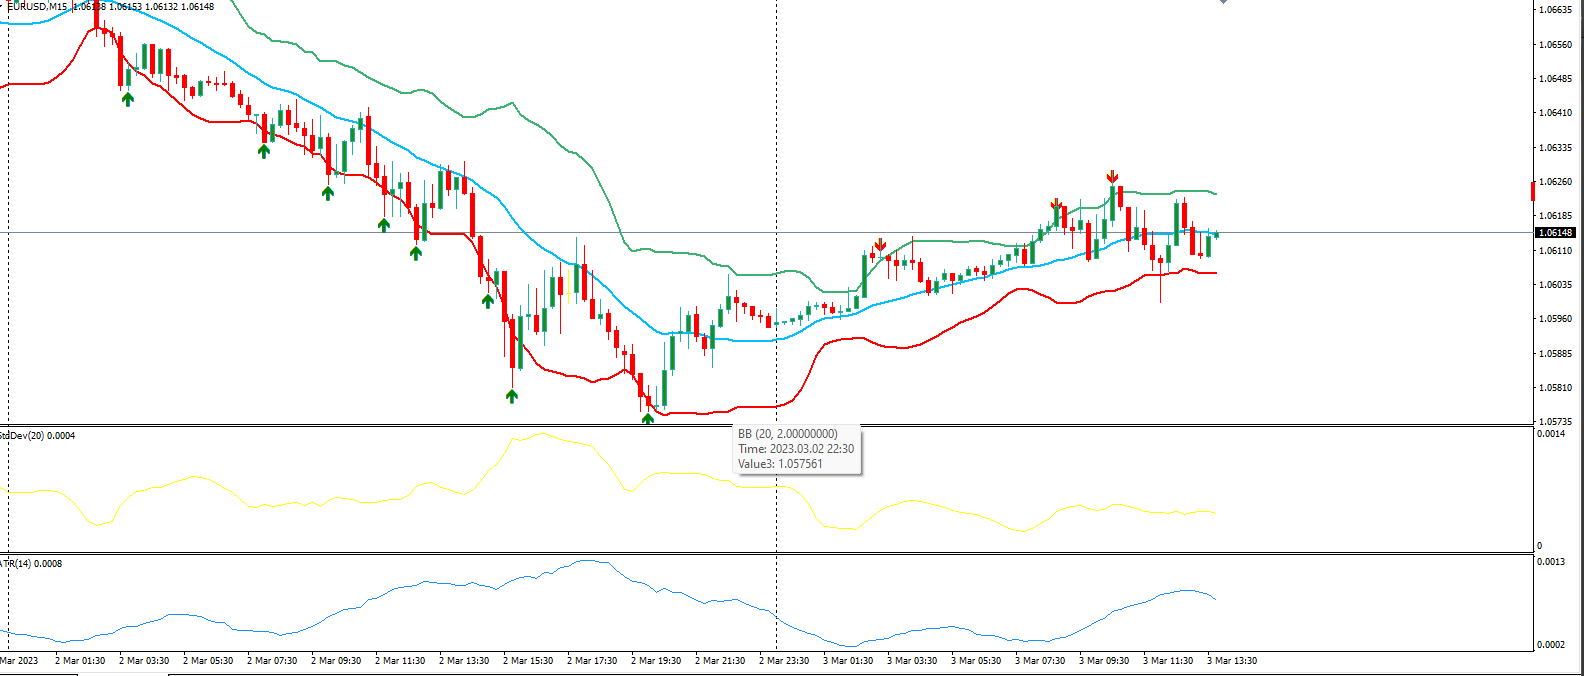
Bollinger band signal &cross profitposted in Questions & Answers
Hi everyone. I have been experimenting with FX for a few days and I found, in my tests, an indicator that allowed me, manually of course, to place orders when the signal appeared on the bollinger bands. I have a screenshot showing the indicator in my possession. What I would like to do is automate these small trades of a few pips with FX. In practice, when the order is issued by the signal, the TP should stop at the central Bollinger Band, both in Buy and in Sell. But I just couldn't figure out the conditions with candle movements and contact with the bollinger bands. Can anyone help me make it? Thanks in advance to everyone.![alt text]
-
RE: "Right Price" Targetposted in Questions & Answers
The timeframe used was M30 so I wouldn't be able to identify the right volume for the 24/48H calculation. Just as volatility always refers to the 24/48h average. This is where I wanted suggestions on how to identify this frequent "attraction" price that was "touched" 1-2 or more times a day from what I saw. Then I guess the "area Buy" and "areaSell" sections are resistances and supports.
-
RE: "Right Price" Targetposted in Questions & Answers
I am sorry. I understand that it is a bit confusing. But that central line called "GP" in Italian "right price" he explained to me that it is the synthesis of the closing price + opening + max24h + min24h +max48h+min48h+volatility + volume. It's tricky to put together, but I've seen it work and it looked very neat. More I can't say.