@Mitchp yes use the condition block and link them one after the other
D
Posts made by DG8805
-
RE: How to identify swing highs/lows?posted in Questions & Answers
-
RE: How to identify swing highs/lows?posted in Questions & Answers
When identifying candles, candle 1 = the most recently closed candle, where candle 0 is the current open candle
Bearish swing
- Candle 3 high < candle 2 high
- Candle 2 high > candle 1 high
Bullish swing
- Candle 3 low > candle 2 low
- Candle 2 low < candle 1 low
-
RE: QUASIMODO FOREX STRATEGYposted in General Discussions
@MattCoward I don't use it particularly, just applied it to that current chart to show an example of what I meant .. the zig zag can be adjusted to suit how you view swing points but at the same time it may not identify a swing that you would or it would identify a swing which you won't consider swing...
The problem I believe, from my short time trying to put my ideas into an ea.. is that there is no actual single variable or set of variables that repeat consistently enough to be profitable if coded into an ea, if price printed in sequence a repeating set of variables that yielded a specific outcome, then someone would have already identified this and created the money printing ea we all are searching for

this leads me to believe that profitability from an ea lies not so much in the entry confirmation but rather the way risk is applied and running trades are being managed.
-
RE: QUASIMODO FOREX STRATEGYposted in General Discussions
@A7 the zig zag will give you false signals when liquidity is being run midway through the trend..
QML/MSS/CHOCH is 5 point reversal pattern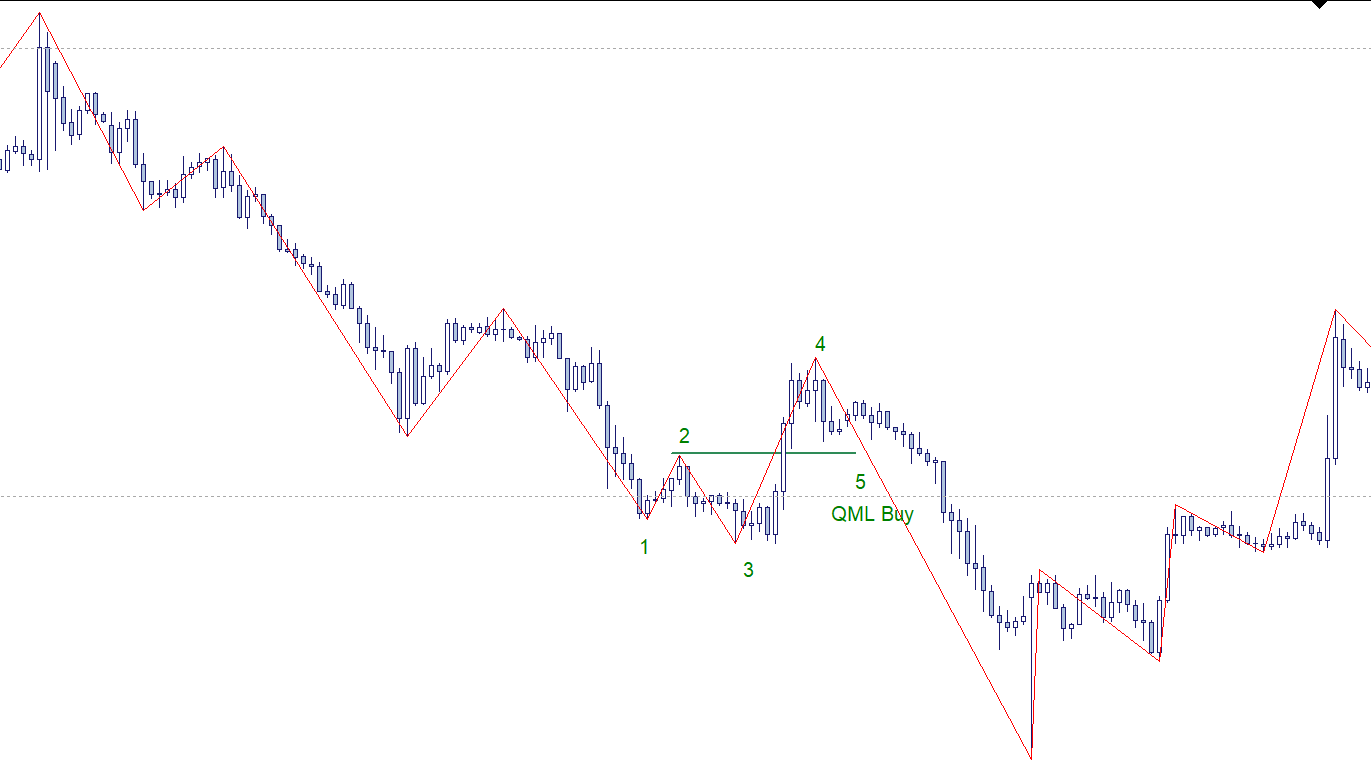
The problem is coding context into an EA..
-
RE: Trend lineposted in Questions & Answers
@l-andorrà Thank you for you response
 I would appreciate if you could have a look at this idea i have come up with from staring blankly at charts
RN_EALogic >>> Price is trading from round price level to the next. Once a level is reached, only 2 things can happen from there, either it goes up or down to the next.
Observations >>> 50 pip price level increments are ideal for intraday targets but I noticed that a lot of the times, price doesn’t make it all the way to the next level and either retests the level it broke or reverses. Further investigations find that there is a higher probability of price going sooner to 25 pips from a 50 pip level than it is going to the next 50 pips levels, keep in mind that this is regular trading times and behaviour is different between high volatility times/news.
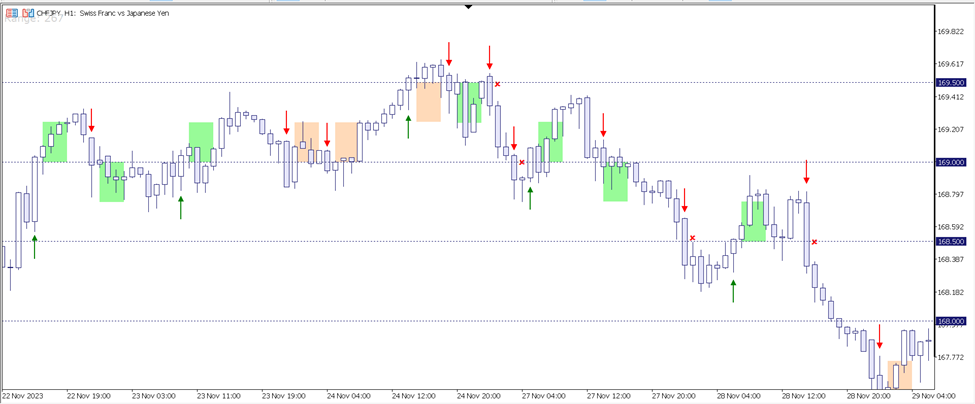
The screenshot above shows what I observed.
The BLUE LINES are in 50 pip increments. The ARROWS indicates a candle that crosses a level and closes above/below, if price retests the level on the next candle then we can target the next 25 pip price level.
The GREEN or RED blocks indicate a win or loss and are 25 pips in size.
The SMALL X indicates no tag after confirmation candleWith this logic, put together an idea for an EA that does the below .. Based on H1 chart
Time Filter
No Trade
Once per Bar
Round Number
User defined Level Increments
Buy Entry Confirmation
Bullish candle (C1) open/low is < level, crosses and close > level
(Basically price is breaking through levels/highs from below and we trying to buy into the momentum)Buy Pending Order
Place BPO at level that Bullish candle (C1) closed above
No offset
TP 25
SL 25
Expire in 1H (Immediate retest)Sell Entry Confirmation
Opposite of Buy Conditions
Sell Pending Order
Opposite of Buy Conditions
I have attempted it but its not doing what i want it to do
https://fxdreema.com/shared/XnVieAO4c
Please let me know what you think.
-
RE: Trend lineposted in Questions & Answers
When choosing your price points for a trend line to extend into the following week/day (prev week/day OHLC), time and price 1 should reference the candle id you want projected (if for previous day/week) but time 2 should be id 0 and price 2 should be id 1
-
RE: Trend lineposted in Questions & Answers
https://fxdreema.com/shared/FfIFDbfF
This is how i'v compiled it, please can any one correct me
@jstap please kindly assist sir, i have seen you resolve many queries
-
Trend lineposted in Questions & Answers
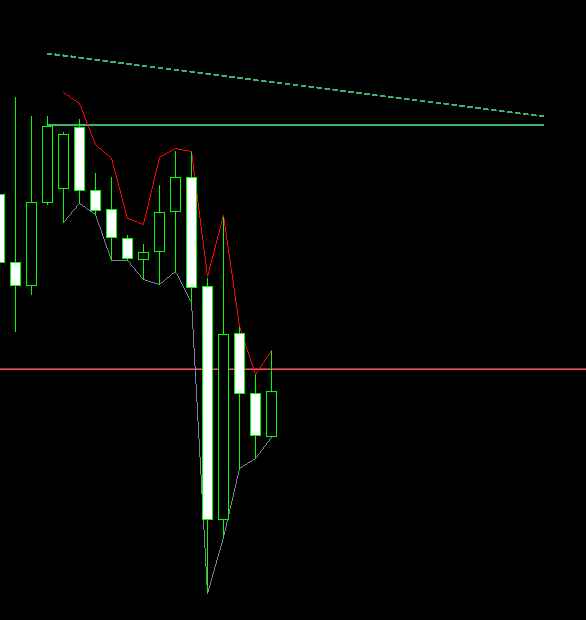
Hi guys, im new to FXDreema but i managed to put this together. So basically i wanted the ea to plot the high/low and close price of the previous weekly candle which remains visible in the following week even on lower timeframes, i was able to do this for the close price with the draw line block with a 1 week shift, i then copied the same block used for the close price and changed to candle high price but i keep getting the high trendline outcome drawn as in the pic attached, could someone please please assist with this, thank you
-
RE: How to use this block? NEW TOP and NEW BOTTOM in trend.posted in Questions & Answers
You can use 3 candle swing points (3 bar fractal or even the standard 5 bar) as a reference point but I don't know how to put it together) see when price is in an uptrend u will find that the swing lows keep getting higher and the swing highs keep getting traded through & vv for a down trend, swing lows break while swing highs hold.. so ideally in a down trend you wanna sell when a swing high forms and in an uptrend you wanna buy when a swing low forms