Hello,how can i have a backround and not only text in my chart showing better the profit?
my chart above.
i want to be like this below:
Hello,how can i have a backround and not only text in my chart showing better the profit?
my chart above.
i want to be like this below:
@l-andorrà Thank you very much!
But i do not have anywhere variables.I just have blocks which draw prices(e.g candle size in pips )
Hello,has anyone found a way to round the decimal?
@seb-0
All is ok.I managed it.
Thank you very much for your concern.
@seb-0
The thing is that the line is always below price.
I want something like the picture,so,depending on where the price is (above or below the line,to develop conditions for buys and sells.
@seb-0
Thank you for the reply.
I am sharing my try...
I do not want to be always below bars.I know it is a mistake the hole project i made.
Just see the conditions.
https://fxdreema.com/shared/XC12CtJMb
Hello,
I want to create an indicator like the picture below.
What i mean: I have my own conditions.I just need to draw the line such as the example of picture.Is it posible?
@miro1360 @l-andorrà @q8carpenter @Xfire or anyone else pls???!
@l-andorrà
I am trying all.
I know that you have right,but all depends on the strategy.
Hello to all.
Is it possible to help me with this:I need every 1000$ my starting lot to increased by 0.01 automatically and follow a martingale strategy.
Mean:0.01/0.02/0.04 etc when the balance is 1000-1999.
Then,starting 0.02/0.04/0.08 etc when balance is 2000-2999
maybe @q8carpenter ? or any one else?
thank you!
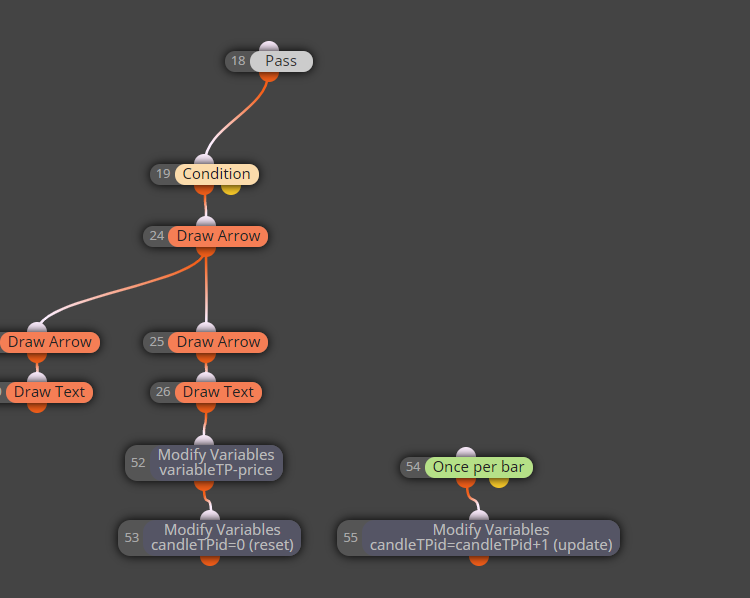
@miro1360 said in Draw only once if TP hit and not draw the SL and vice versa.:
use variables for saving the price and candleID in the time when the object is created, update the candleID for each candle (+1), reset the variables when a new signal appears, otherwise you will have to create a search system (using loops or specific names)
Thank you very much for your kindness .I am still not able to do this as i am not a programmer and do not understand the variables(double,int,boolean etc),so it is difficult for me.If you can show me exactly a picture i would be greatful so i can understand.If it is annoying asking so much,thank you again for your help!
@miro1360
I have searched but the thing is that i can not define the candle where i have the signal.
That is my problem because it varies from 5 candles away to 20 or more and i am not able to solve it as i do not understand how to do it with variables.
@miro1360
Hello sir,
Thank you .
One more question:
i can not draw a trendline from the signal to the TP point or SL point.
I would very much appreciate if i had a solution for these.
Thank you!
@l-andorrà
No.all is made by conditions.
Hello to all.
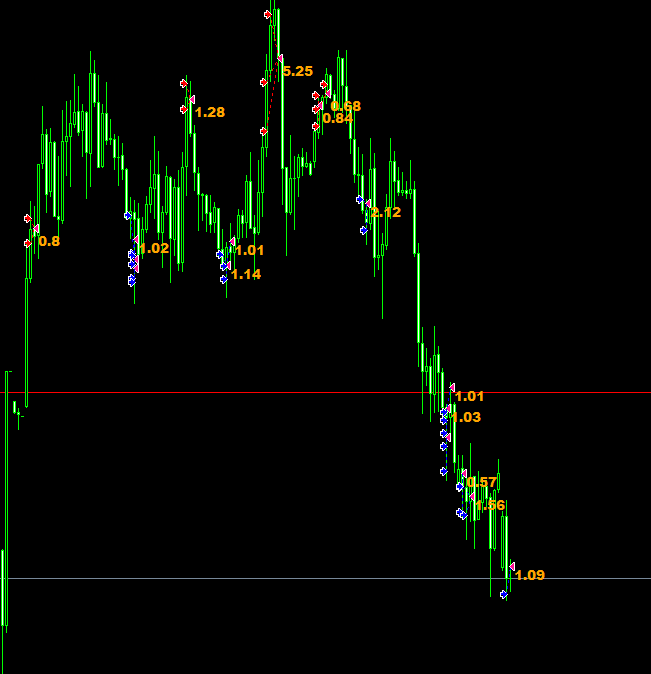
1st picture:I am trying to create a signal and need to draw once only the TPis hit and THEN,NOT TO draw the SL.
The same to be applied continuously.
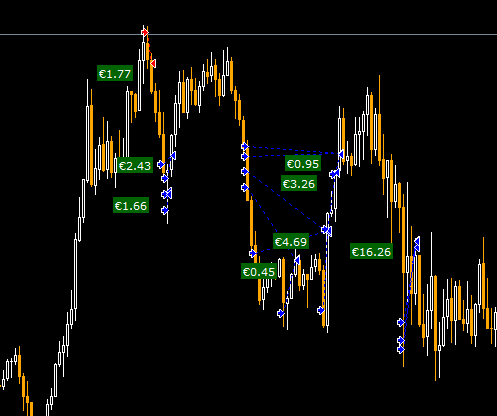
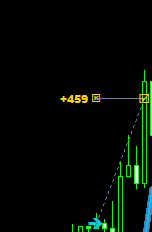
2nd picture:
Also,is it possible to draw the TP when hit or the SL as picture?
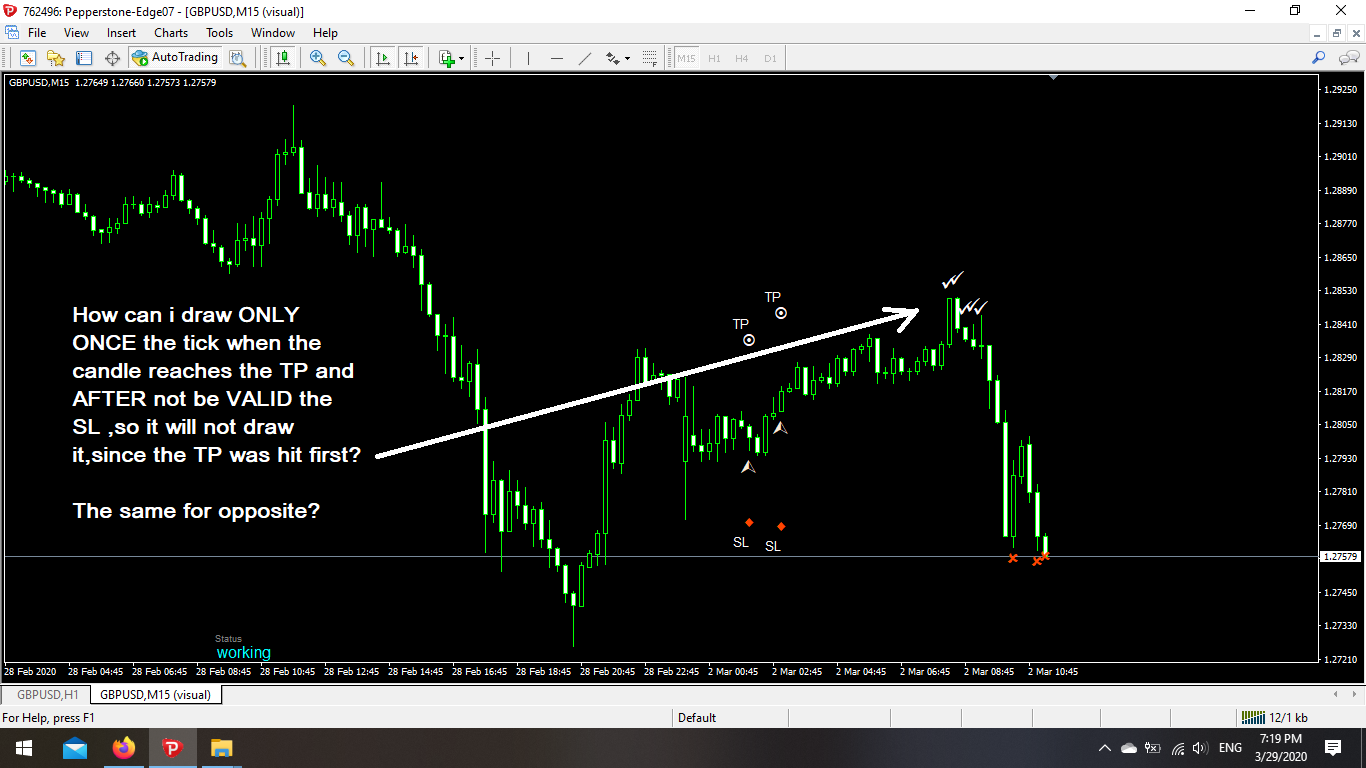
picture 2
@seb-0
Thank you sir.I will try !!
@varso
I do not how to use variables...