Hello,
I would appreciate some help with this:
(High candle 1 - Low candle 1) >=1.2*(High average last 10 candles - Low average last 10 candles)
Thanks
Hello,
I would appreciate some help with this:
(High candle 1 - Low candle 1) >=1.2*(High average last 10 candles - Low average last 10 candles)
Thanks
Hello.
I was wondering how can I make the EA draw arrows in regular charts. I made the EA and after some conditions on different indicators are met, it draws arrows but it only works on the strategy tester. When I attach the EA to any regular chart I don't see any arrow...
Thanks in advance.
I only want to know by that kind of interface when the price touches one Moving Average.
I create a EA and put as an output to draw a line o a message to the MT4 but that's not what i'm looking for.
Hi,
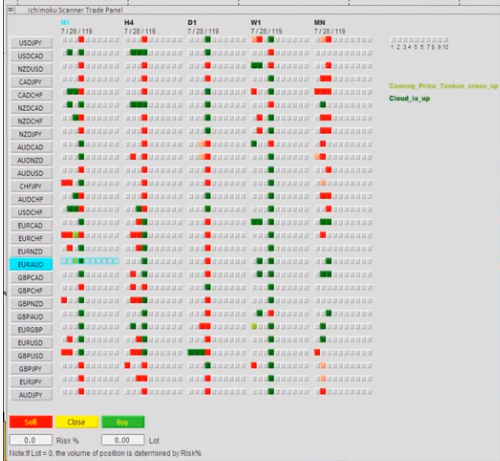
I want to built a EA or scanner that shows me when the price is reaching an indicator. It would be very helpful having an inter phase like the one I attached. 28 pairs, 6 time frames. Where can I learn that? Because the code it's pretty simple but as I said, I have no idea how to show that.