Hi @xfire ,
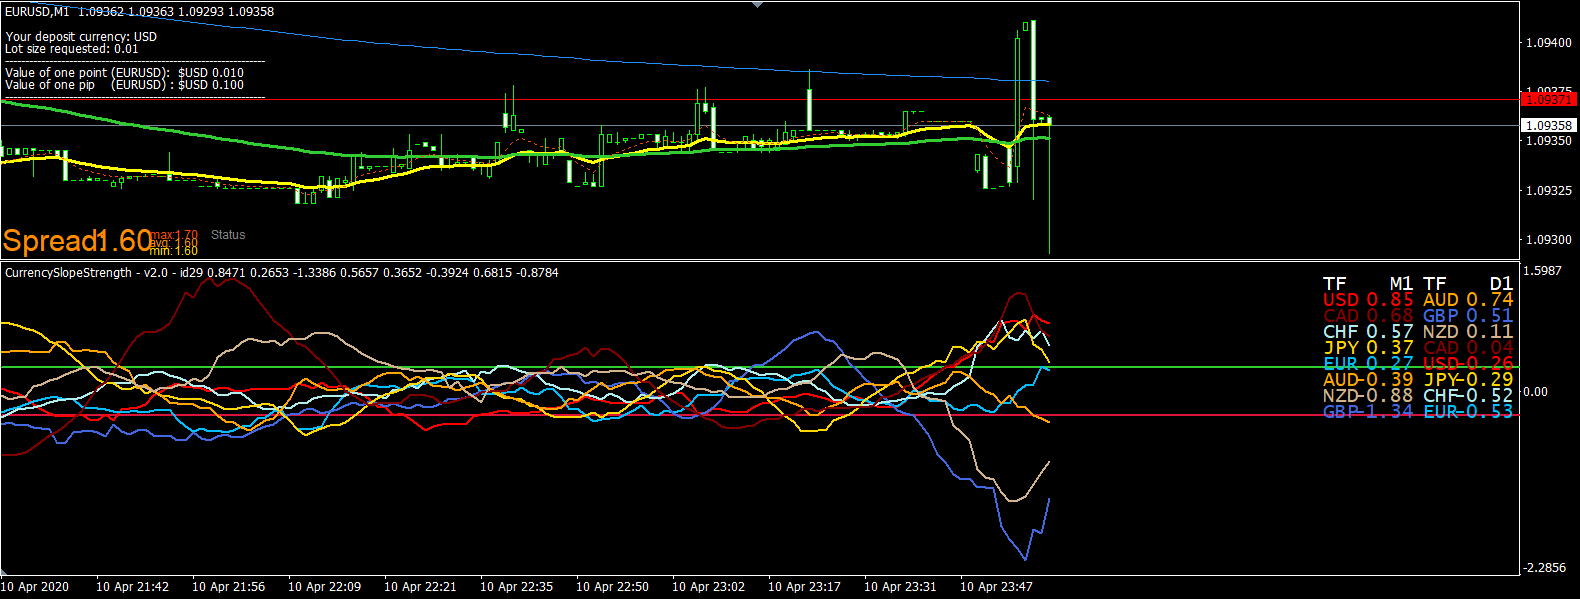
It essentially compares the strength of the 8 main currencies to each other. There are "strong" currencies and "weak" currencies in this comparison. One would trade those which are the furthest away from each other. So if at a moment the EUR is indicated as the strongest while the CHF as the weakest, you would look for opportunities to enter a long trade on EURCHF. This is the main idea.
Of course, the notion of "strong" and "weak" currencies is nonsense. If a high value is indicated on the chart for a given currency, it means the currency has been strongly trending in the recent past. So with the previous example, if EUR is indicated as the strongest, it means we have some sort of bullish move on EURUSD, EURCHF, EURCAD etc. The strength of this move depends on the strength of the other currencies: if CHF is the weakest, EURCHF will experience the strongest bullish move, while all pairs with CHF will see the value of the CHF against the other currency fall.
Hope this helps to clear it out a bit. ")
P.S.: In real time I'd surely not use the indicator chart as it is shown above. Luckily, it is possible to switch off those currencies which are not relevant for the evaluation of the current currency pair. On the image above, we have a chart of the EURUSD so, in this case, I'd switch off the other 6 currencies so that I am only left with the strength of EUR and that of USD. Then it is not confusing to use it