Simple strategy with over 75% accuracy and Payoff above 3:1
-
Hello everyone,
last week I made a post saying that I am a trader and have been in the market since 2015. I have good strategies and would like to turn them into robots, but I am starting out on FXDreema and I don't have the ability to make a robot yet! My proposal is to provide tested and high-level strategies (I don't work with martingale or hedging), so that anyone who is interested in helping me can make the robot and benefit too. Of course, after the robot is developed, there will still be adjustments and a series of tests to be done, but I will take care of this part, because I know the strategy well.I am posting the first strategy that I adapted with indicators to simplify and make it easier for whoever is going to make the robot. The strategy is not complete because it is just a test and it is also not easy to transform a manually analyzed strategy into a systematic strategy for a robot, but the way it is, you will get great results.
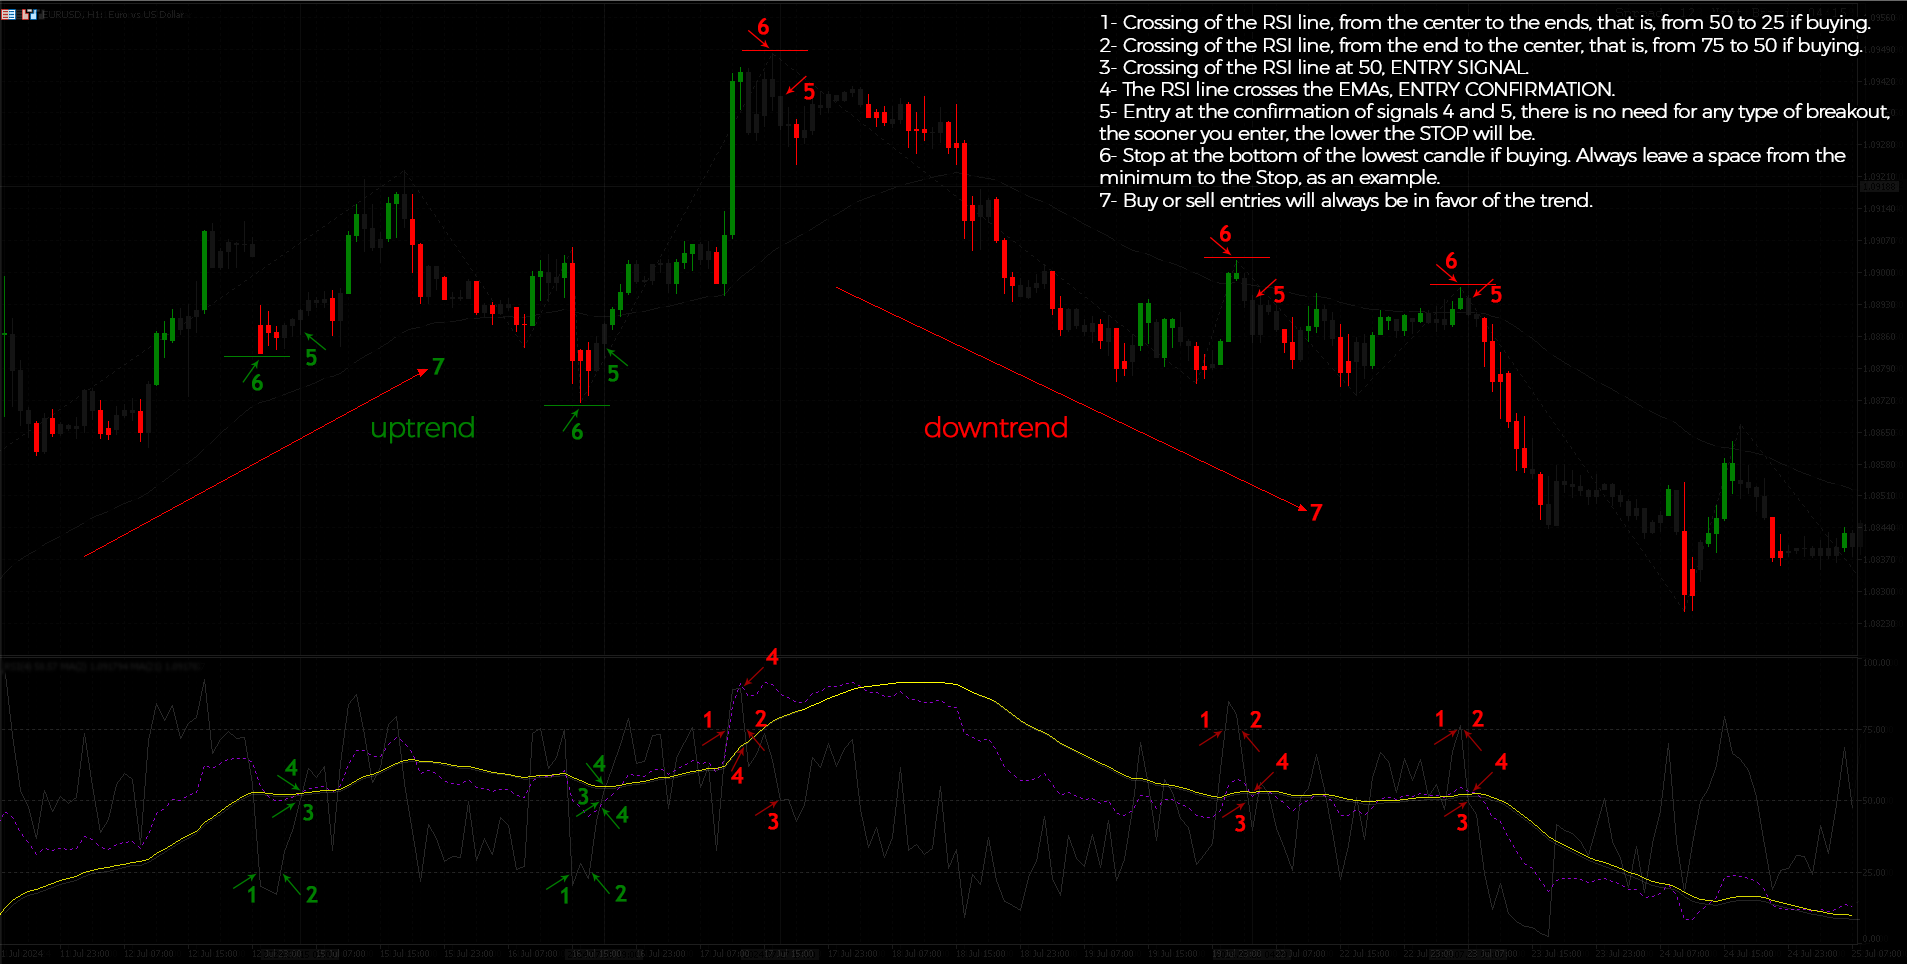
This strategy is a trend correction strategy. In my opinion, trend-following strategies are the best and most profitable because they have a very short stop compared to the target. Therefore, the payoff can reach up to 10:1 in this type of strategy. At least that's what I've observed over the years. Anyway, I adapted the strategy to work 100% with indicators. I think it turned out well.
1- Crossing of the RSI line, from the center to the ends, that is, from 50 to 25 if buying.
2- Crossing of the RSI line, from the end to the center, that is, from 75 to 50 if buying.
3- Crossing of the RSI line at 50, ENTRY SIGNAL.
4- The RSI line crosses the EMAs, ENTRY CONFIRMATION.
5- Entry at the confirmation of signals 4 and 5, there is no need for any type of breakout, the sooner you enter, the lower the STOP will be.
6- Stop at the bottom of the lowest candle if buying. Always leave a space from the minimum to the Stop, as an example.
7- Buy or sell entries will always be in favor of the trend.
STOP: Para acompanhar a tendência, gosto de usar um trailing stop com Super Trend ou mesmo com EMA.
TAKE: Você também pode usar ou deixar essa opção no robô, usando o próprio STOP como parâmetro como referência, por exemplo, o stop estava em 50 pips, então TP 2x (100 pips) ou 3x (150 pips), o tamanho do Stop.Tks.
-
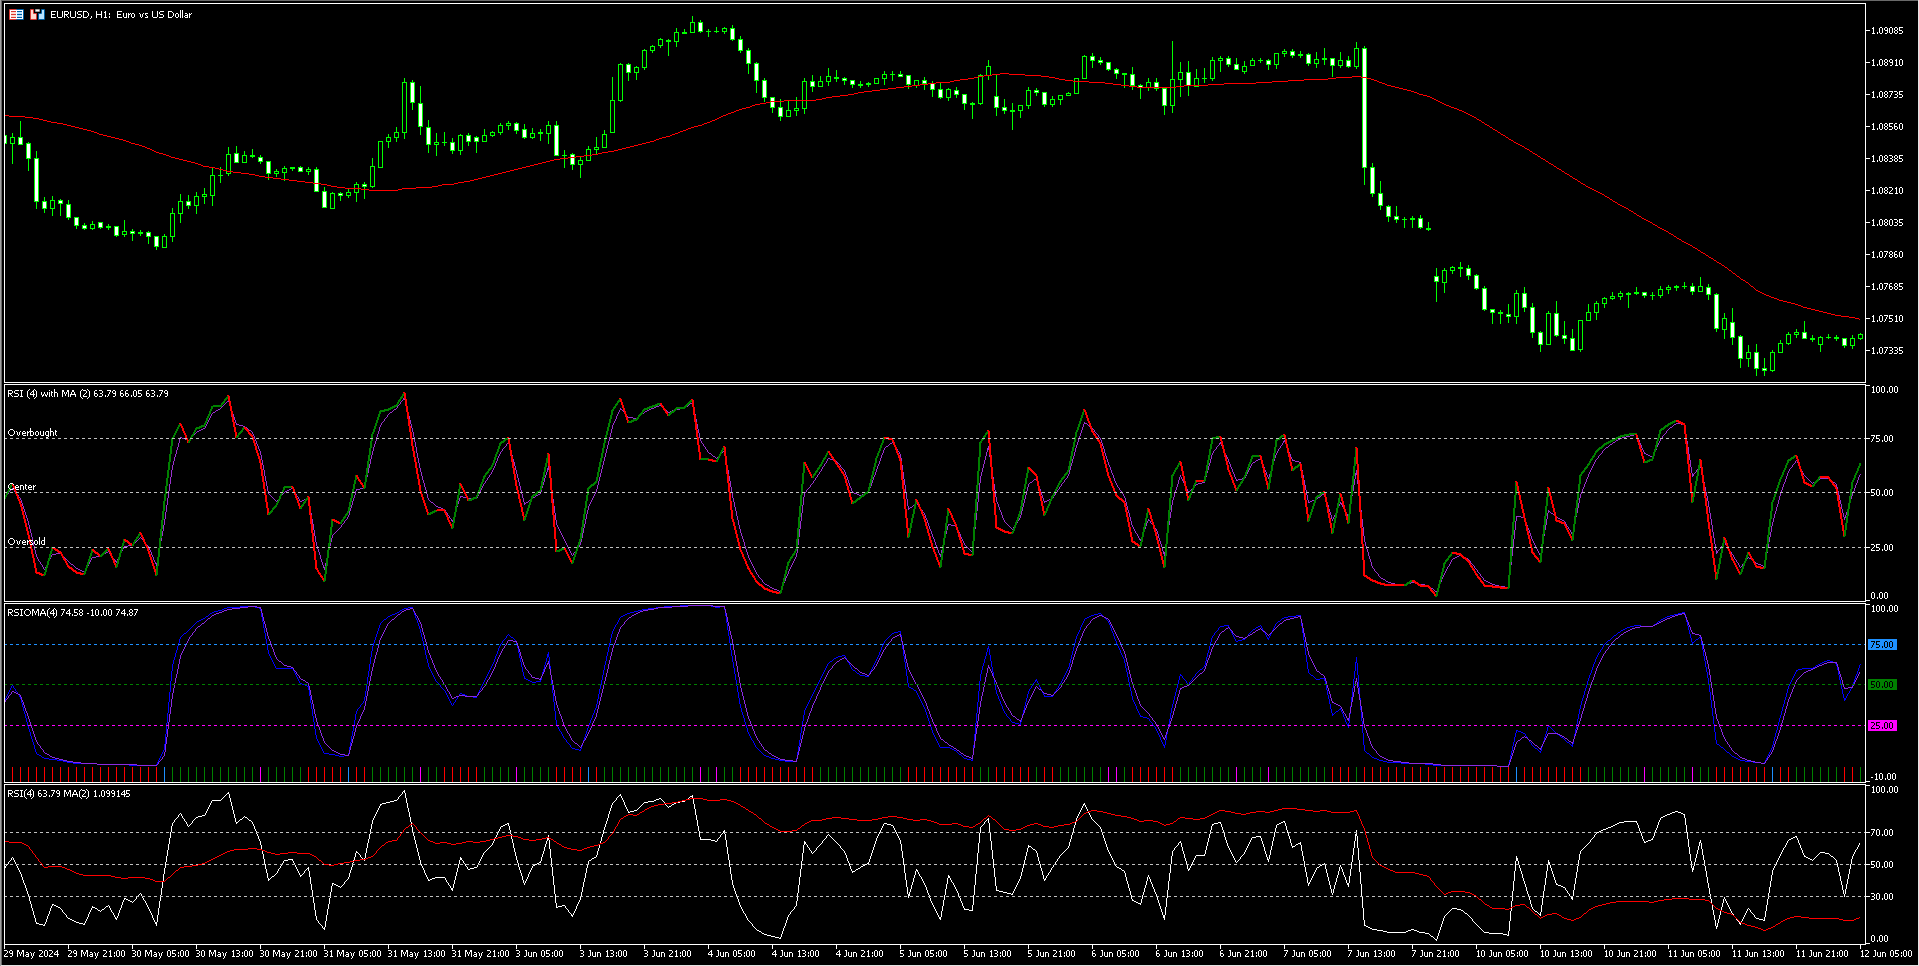
Hmm.. Unfortunately RSI can't cross MA correctly in the subwindow. Still need to create a custom indicator to make it work better.
I think there are lots of request before from others to do the same thing, RSI cross MA.
-
RSI Period? EMA Period? I see 2 emas there
-
@biztet Hello, tks for replying. I can try to make some kind of adaptation to the setup.
-
@biztet Hello, tks for replying. These variables change according to the asset and the time frame. You can use a fast EMA of 3 to 5 periods and slow EMA of 9 to 21, RSI you can use the levels with 75 and 25.
-
@Byens Hello, tks for replying. These variables change according to the asset and the time frame. You can use a fast EMA of 3 to 5 periods and slow EMA of 9 to 21, RSI you can use the levels with 75 and 25.
-
@biztet If you do the RSI crossover as I have already explained, with stop and take as I wrote, then the strategy will aready work well! Now I am creating a way of reading the market "in range" (market stopped), to complete to robot. If someone can deliver what I need, I will pass on the second part of the robot which makes in very accourate. Tks.
-
you can start with this indicator, the rest is easy
-
@Byens Hello, thanks for your tip, I thought it was great. But for me, implementing this is still a challenge because I don't understand how FXDreema works, I don't understand anything about programming yet. I tried to install the indicator you provided on my MT5, but it's not showing up on my chart. Did I do something wrong? Was it supposed to be this way? Was it just the calculation? Sorry for the silly question, but I really don't understand. Usually the indicator shows up on the chart. Using your idea, I downloaded 2 other RSI indicators with MA, they all showed up, but you can see on the screen that there is a difference between the first 2 indicators I downloaded and the third one, which is the one I use to trade (RSI + MA), it seems that the average is using different parameters. Thanks for your help.
-
Please loot at what biztet said. You are requiring two indicators to be combined (crossing) while in different windows of the chart. Sadly fxDreema cannot do that. You will need a custom indicator as he said.
(English) I will try to help everyone in these fxDreema forums. But if you want to learn how to use the platform in depth or more quickly, I can help you with my introductory fxDreema course in English at https://www.theandorraninvestor.eu.
(Català) Miraré d’ajudar tothom en aquests fòrums d’fxDreema. Tanmateix, si vols aprendre a fer servir la plataforma amb més profunditat o més de pressa, t’hi puc ajudar amb el meu curs d’introducció a fxDeema en català a https://www.theandorraninvestor.eu/ca.
(Español) Intentaré ayudar a todo el mundo en estos foros de fxDreema. Sin embargo, si quieres aprender a usar la plataforma en profundidad o más deprisa, te puedo ayudar con mi curso de introducción a fxDreema en español en https://www.theandorraninvestor.eu/es.
-
@l-andorrà @Byens has already shared an indicator doing this...
Learn fxDreema Without the Wait!
My comprehensive book, available on Amazon, is packed with examples and invaluable insights to help you fast-track your learning journey.
The paperback and hardback editions include MT4 & MT5 QR codes for easy access to all prebuilt projects and robots, including my latest gold trading robot!
Don’t miss out
Click here➡️ https://mybook.to/fxDreema to get your copy today!
Enjoy! 😊
-
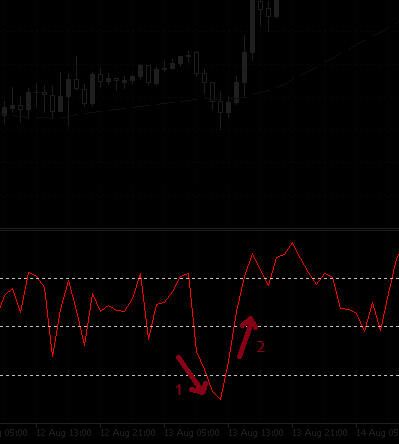
@l-andorrà Thank you for replying to my message. I didn't know about this limitation of FXDreema. But is it possible to do it in FXDreema as illustrated by the illustration I made? RSI crosses below 25 (1), and then crosses above 50 (2) to open the order? Respecting the trend? I tried to do this but I couldn't.
-
@jstap Yes. But the indicator unfortunately does not work according to the RSI + EMAs that I use in my MT5, I left an image above with the reference of 3 RSI, the last one is the one I use.
-
@Adriel-Pereira Yes, it is technically possible, but I'm not sure you are using two separate indicators (no problem there) or want to use them combined (that fxDreema cannot do on its won. You will need a custom indicator for that). Which option are you considering?
(English) I will try to help everyone in these fxDreema forums. But if you want to learn how to use the platform in depth or more quickly, I can help you with my introductory fxDreema course in English at https://www.theandorraninvestor.eu.
(Català) Miraré d’ajudar tothom en aquests fòrums d’fxDreema. Tanmateix, si vols aprendre a fer servir la plataforma amb més profunditat o més de pressa, t’hi puc ajudar amb el meu curs d’introducció a fxDeema en català a https://www.theandorraninvestor.eu/ca.
(Español) Intentaré ayudar a todo el mundo en estos foros de fxDreema. Sin embargo, si quieres aprender a usar la plataforma en profundidad o más deprisa, te puedo ayudar con mi curso de introducción a fxDreema en español en https://www.theandorraninvestor.eu/es.
-
@l-andorrà Ok, I understand. I'm considering trying to get the same result using other indicators. But this may take some time, because in addition to finding a solution to the problem, I will still have to do a lot of testing and then test it on a real account. Tks.
-
Ok. Please be back here when you find the right indicator's combo.
-
@Adriel-Pereira hello i can help you if you want just dm me on my telegram t.me/kiki0805 , you need costume indicator code btw