heikin ashi bear to bull find low size
-
Hello,
Can someone help to find the heikin ashi candle going from bear to bull, but only if the total size of the first bull heikin ashi candle is smaller than the bear heikin ashi candle before(2) or the HA candle before that one (3).What I have now in fxdreema gives an irregular outcome.
thanks for your help
-
Not sure what you exactly mean. Could you please share a screenshot with a visual example of what you need?
-
@l-andorrà
Hello L'Andorrà, hereunder a screenshot from the EA and what it is doing wrong.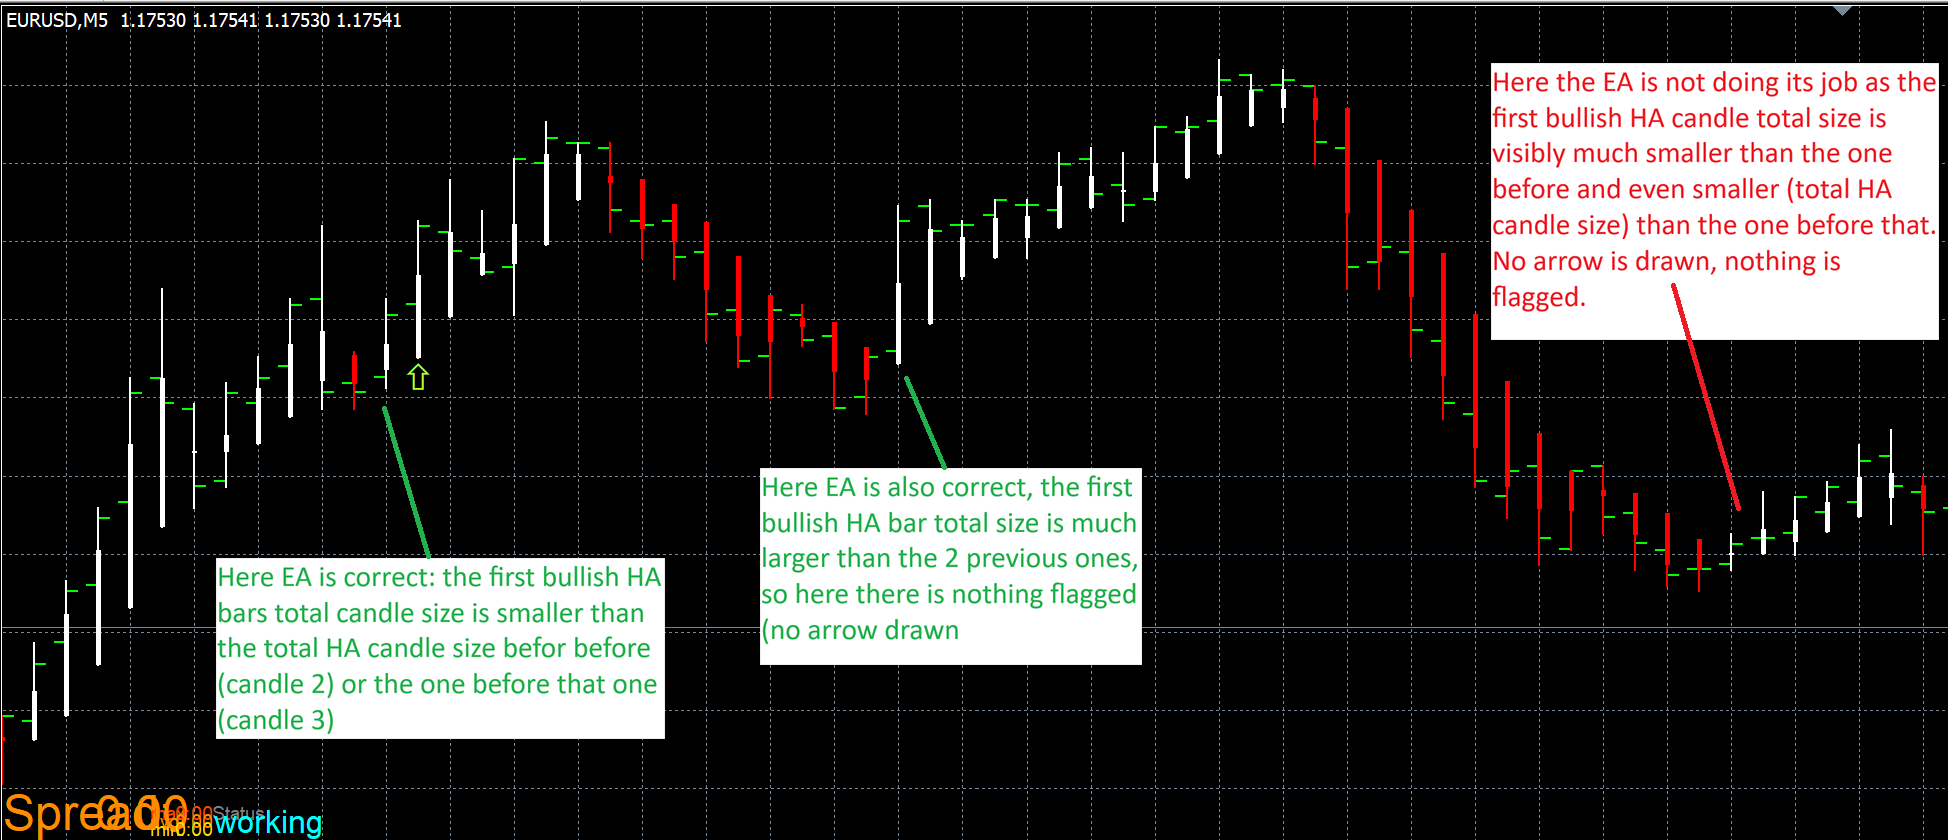
-
I think the HA problem is how it measures the candles, try this and see if it works correctly: https://fxdreema.com/shared/bIah92CYd
-
@jstap
Hello, thanks for your reply. I already thought there is a problem in the HA. However I would still like to use the coding in condition blocks. Could you check the custom code in my EA and tell me where I go wrong? I think the problem is finding the high and low of each heikin ashi candle. test_2026_03_4_d.mq4 -
Add a shared project link rather than mq4. project screen - projects - create project link -open in browser - copy address bar and past here. As for using the standard blocks they cannot amend the candle ID so will have to use custom code regardless.
-
Hope this works:
https://fxdreema.com/shared/b4uO2RLDc -
You'll have to say if it does/doesn't, not recently I have tried to use HA this way, but didn't show the right candle, why I used ChatGPT and it said:
Why the lines appear on the wrong candle
Your logic is correct, but the visual mismatch happens because of how MT4 handles:- Heikin‑Ashi indexing
- Shift timing
- Bar completion
- Redrawing on every tick
Two things cause the lines to appear on the 3rd candle instead of the 1st:
- Heikin‑Ashi is not aligned with the chart candles
You’re drawing lines on the real chart, but your logic is detecting HA candles, which do not line up 1:1 with the visible candles.
So:
- HA shift 1 ≠ real chart shift 1
- HA shift 2 ≠ real chart shift 2
This alone can move your line forward by 1–2 candles.
- Your code uses Time[1], but the HA candle you detected may actually correspond to Time[2] or Time[3]
Because HA candles are synthetic, the “bullish HA candle at shift 1” might visually appear on the chart two candles later.
So the line is drawn correctly according to your logic, but not where your eyes expect it.
so good luck relying on the standard blocks... as in your picture above it looks like this is the problem you are facing.