Doodling in Excel
-
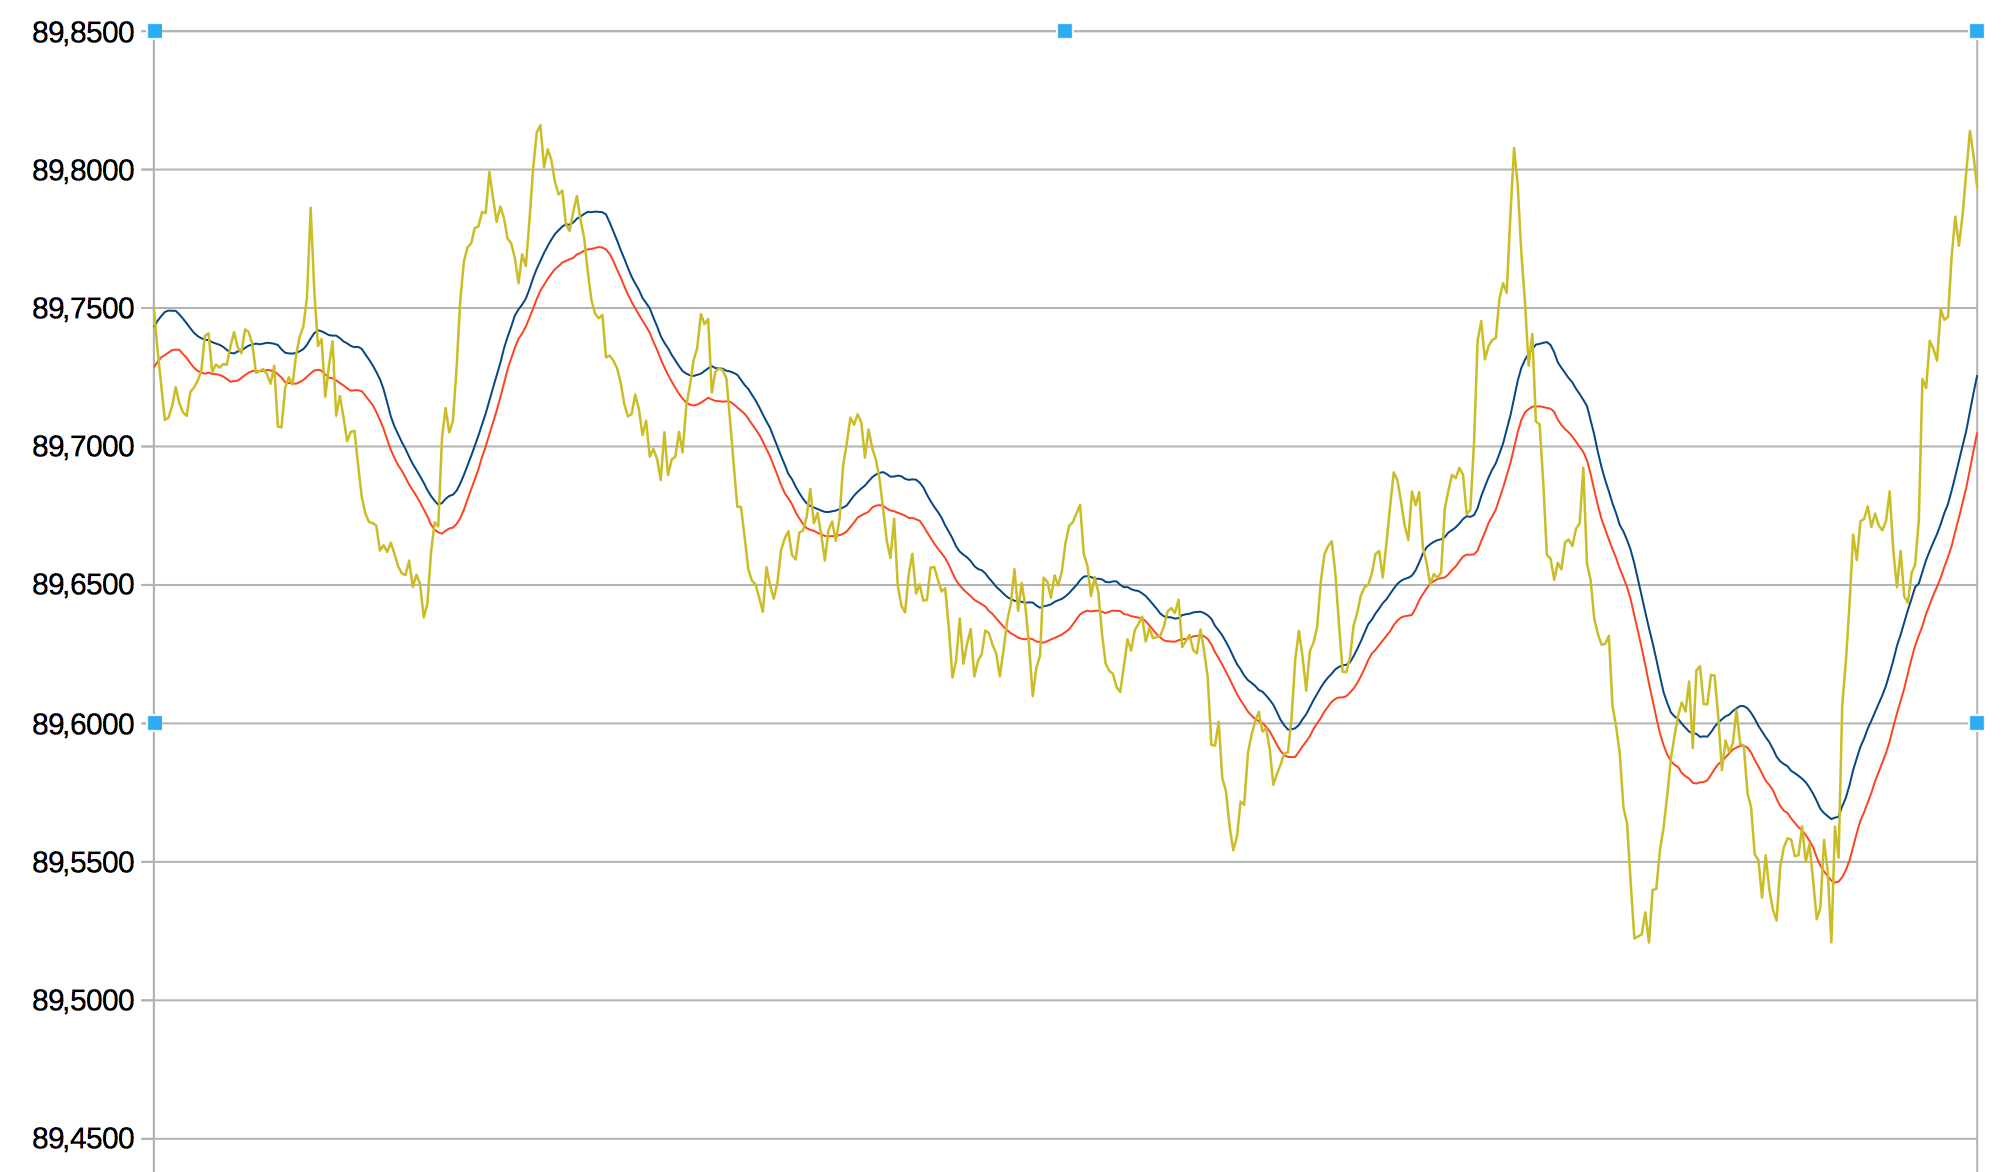
Hi. Ive been doodling with market data in Excel and came up with this. The idea is to produce a filter for market noise and have an indicator line working from that. Ive omitted the Close Price cause it made the graph a bit hard to read. But it roughly follows the two black lines.
So sell is when the orange line crosses below the lower black line. Buy is when it crosses over the upper line. Close is when Buy/Sell crosses the black line again.
What do you guys think? Could this work as an EA?
/Thanks + Regards
-
few years ago I tried something similiar, with tons of optimalizations and result was not as expected, even if the robot traded properly under the conditions

-
Ohh... I see. Thanks for the heads up
")