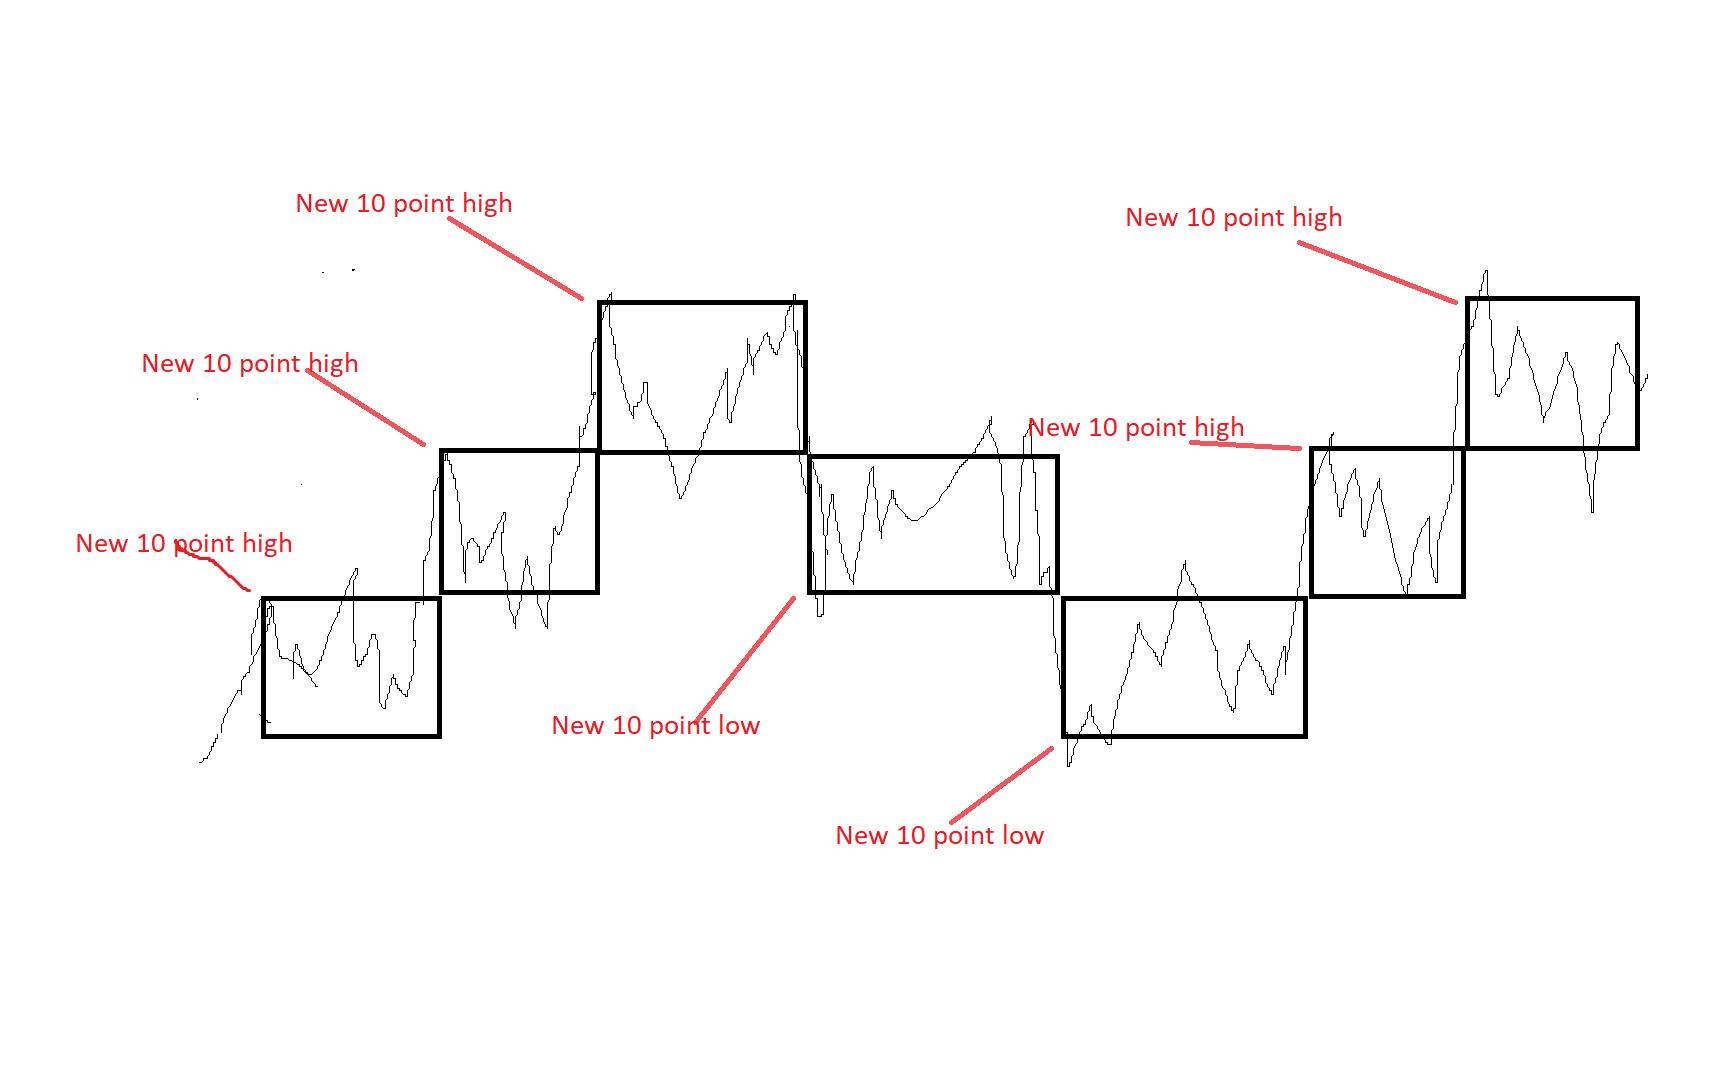
High and low range boxes
-
I am trying to figure out how to identify new high and low ranges. This would be something similar to Renko charts and Darvas Box.
There would be a start point and when the market moves up or down in the set range (10pips in this drawing) the high and low would be logged and a box would be drawn on the chart.
I am thinking the new highs and lows could be stored to a string to be able to reference them.
How would something like this be accomplished?
-
There is a block "Round numbers detector", but if you only want to draw all of these rectangles on the chart, I think this is a job for some custom indicator