example: Trendline EA
-
Here I show you how to work with trendline.
Use this example only with Demo account and learn perfectly how it is working. I am not responsible for your money losses.
https://fxdreema.com/shared/Q13po8uvc

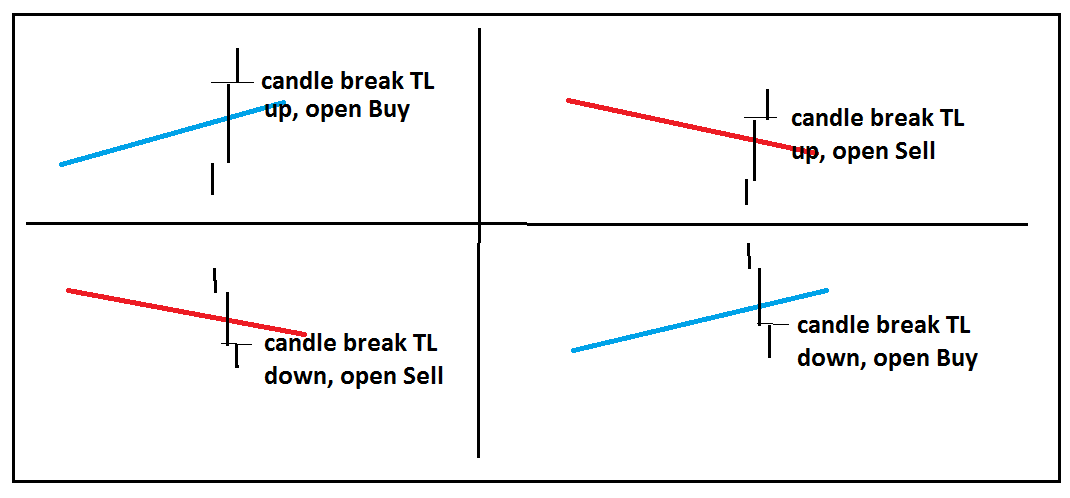
In example I will open trade on 4 possible situations:
you need create trendlines manually (for this example, but you can do this also automatically with EA using buttons, check my previous tutorial how to work with buttons)
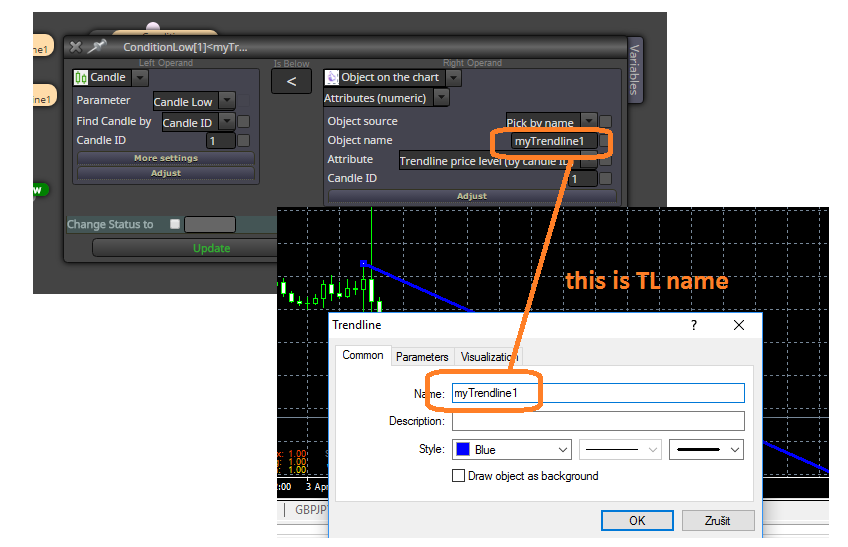
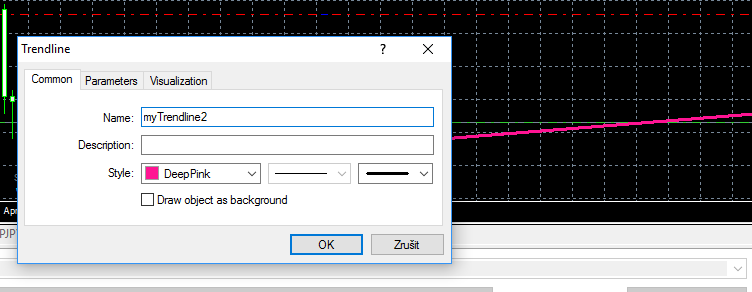
in EA give name for this trendline in condition, and also the same name in chart for your trendline:
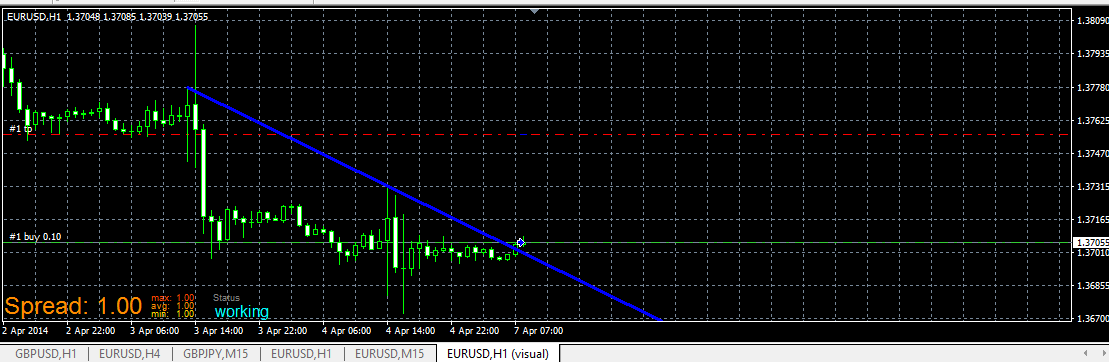
and this is live example:
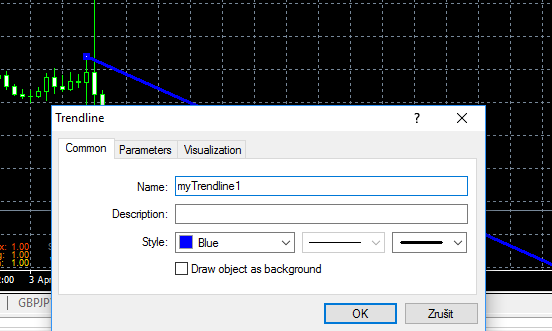
dont forget, right name for trendline in chart:
trade when price break your TL from bellow above (buy based on conditions for myTrendline1):
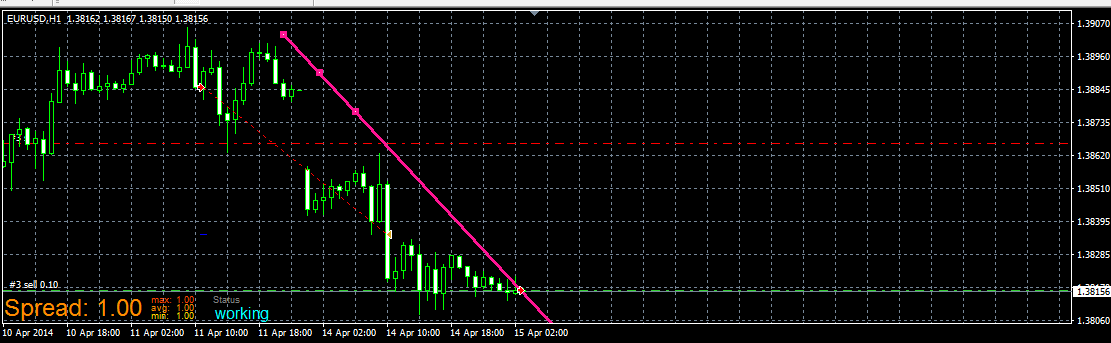
or Sell for myTrendline2:
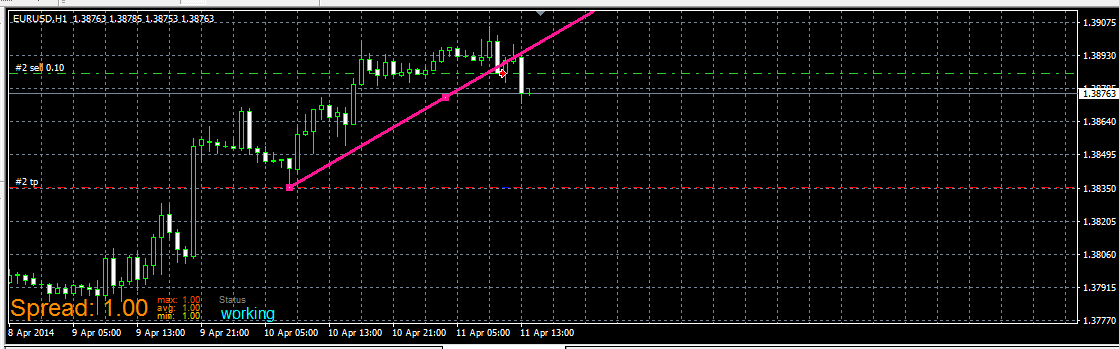
and when you place myTrendline2 (for Sell trade) above price, you wait for Sell when it break it from bellow, like this:
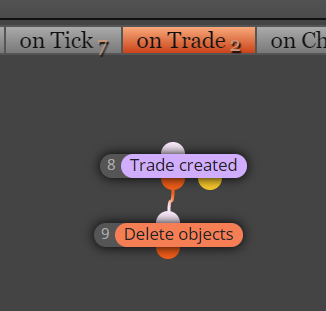
you can improve this example by other things, like delete TL after trade is opened (to prevent open another trades when your first is closed) or other things ...
have a fun
")
-
You can add that EA opens the positions after breaking the trend line and not waiting for the candle to close?
-
yes, change Candle ID from 1 to 0
-
OK THX.......
-
To have more than two lines in this ea, you need to add trendline condition 4 and 5, etc.
-
Hi @miro1360 How are you? How can I delete the TL after trade is opened? Could send me an example, please? Thank you a lot!
-
-
Great explanation. Just one question, what do "if trade b" & "if trade s" blocks mean? What do those blocks do?
-
@marianomartinez next to each block on the left hand side there is an explanation of the block, if you hover your mouse over the left side a question mark will appear. http://icecream.me/46c93ca7dfc6f2d7e6ab5198b3ffac0c
-
My EA is not working, it's not taking any trades. Can you take a look at it and see what's wrong?
fxdreema.com/shared/STIQckgCcIn this case I want it to open trades when price breaks support / Resistance lines that I draw on the chart not trendlines.
-
You are requiring the candle close 1 to be AT THE SAME TIME above and below that object. That cannot happen.
-
@l-andorrà it is what miro1360 does in the example, I just copied the project and adapted to break price lines instead of trendlines, I don't understand what I am doing wrong
-
@marianomartinez You are missing the if trade blocks. Have you renamed your line if you are drawing it ?.
-
Sorry I didn't clarify that I already tried with the if blocks, but it didn't work either. I tried deleting them because didn't understand what they were for. Yes I name the line just like I named it in the EA
-
@marianomartinez Check the the candle blocks, miro's project he uses candle high and candle low as you have candle close ?
-
@miro1360 Hello brother
Can i use X> or X< instead of > or < with this?
im new on fxdreema
Thank you and have a ncie day...
-
Hello, when i try this EA at demo account
Why Buy & Sell not working?
I already draw Trendline manually,
and give similar name of manually draw trendline with block input.
any help to this issue? -
@aeivan The original thread is 4 years old. The platform has been updated meanwhile. You should try to rebuid it from sctrach.
-
@l-andorrà
Any example of using trendline price level (by candle ID)?
or how to use other properties of object on the chart? -
you most probably forget to put a name for the trendline on the chart, the example from my first post is working fine
