Does anyone know why this picture doesn't even show up, not even the indicator....
-
-
@len-1 this is not a time value
-
edit: nevermind
-
@roar thanks. I just got from FXdreema an email....
FxDreema Support
5:41 AM (6 hours ago)
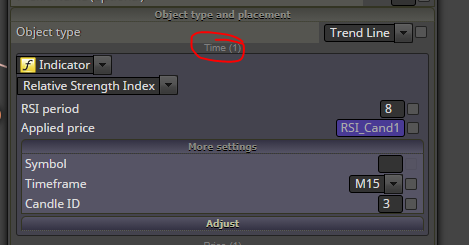
to meHi. If you want to draw an object on a subwindow instead of the main window where the chart is, try this:
Try value 1. If it has to be the Name of the indicator, it should be the short name, something like MACD(12,26,9)
However, this block only draws a trendline. For trendline you need to somehow calculate its 2 coordinates. It depends, but I imagine that this requires some calculations.
About timeframes, these are arrays of data. You know, OHLC and Volume of the candles. The EA has this information, normally for the current timeframe. But if you specify another timeframe, it can get that data as well. If it's some indicator, this is where to specify that:
Then you can be on H1 for example, but the indicator will be calculated with data from M15.
-
@len-1 oh, seems they do work after all.
Here's an example drawing a trend-line in RSI, from ID 0 to ID 3
https://fxdreema.com/shared/X2m5ZccXNeed small help? Tag me in your post
Need big help? https://www.fiverr.com/big_algo/automate-your-winning-strategy-in-mql4-or-mql5 -
@roar This information should be available for all users in a sticky thread. Thank you for sharing Len1.
-
@roar, hey Thanks!
Quick question, is there any way to lengthen this line segment to the right more?
-
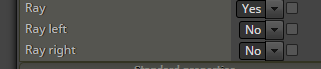
@len-1 use the left/right ray option. Negative candle ID's doesnt seem to work.